EcoGRAFI
2nd International Conference on Bio-based Building Materials & 1st Conference on ECOlogical valorisation of GRAnular and FIbrous materials June 21th - 23th 2017 Clermont-Ferrand, France
CHARACTERIZATION OF MECHANICAL PROPERTIES OF HEMP-CLAY
COMPOSITE
B. Mazhoud1*, F. Collet2, S. Prétot2, C. Lanos2
1 INSA Rennes, Laboratoire de Génie Civil et Génie Mécanique, Equipe Matériaux Thermo Rhéologie, IUT Génie Civil – 3, rue du Clos Courtel, BP 90422, 35704 Rennes, France 2 Université de Rennes 1, Laboratoire de Génie Civil et Génie Mécanique, Equipe Matériaux Thermo Rhéologie, IUT Génie Civil – 3, rue du Clos Courtel, BP 90422, 35704 Rennes, France
* Corresponding author; e-mail [email protected]
Abstract
The need to reduce greenhouse gases emission produced by the building sector leads to the research of renewable and less impacting materials that can replace traditional ones. This study focuses on development of a new sustainable building material using hemp and natural clay. In this work, experimental investigation was carried out to study the mechanical performance of hemp clay composite. The composites are made with different Hemp to Binder mass ratio. The hemp to Binder ratio is estimated regarding traditional mix proportioning of hemp concrete used for floor, wall and roof. Firstly, hemp shiv was characterized in term of density, particle size distribution and water absorption. Then, the mechanical properties are determined to compare the mechanical behavior of the hemp clay composites with hemp concrete. The results show that the density of the composite materials varies with the H/B ratio. The density range between 373 kg/m3 and 510 kg/m3. It is shown that mechanical properties depend strongly on the Hemp to Binder ratio and on density. The tensile strength ranges from 0.021 to 0.026 MPa and the compressive strength ranges from 0.39 to 0.48 MPa.
The results show that the mechanical performance of produced composite materials meets the requirements of the intended use.
Keywords:
Hemp; Clay; Mechanical properties.
1 INTRODUCTION
In a context of sustainable development, bio-based building materials are developed to replace conventional products in order to reduce the impact on environment. Bio-based materials are relevant because they are made from renewable raw materials and allow carbon storage during their growing [Amziane 2013]. Among them, hemp based materials have been studied a lot these last years because hemp shiv have many advantages (renewal, carbon sequestration…) [Amziane 2013]; [Pretot 2014]; [Boutin 2005]; [Cerezo 2005]; [Collet 2012]; [Collet 2014]; [Evrard 2006]; [Tran Le 2010]. Up to now, many researches have been conducted on hemp concrete [Laurent 2012]; [Collet 2013]. This material is usually made of hemp shiv and lime based binder. In such material, the LCA exhibit that the lime is the more impacting component during the production phase [Pretot 2014].
In order to reduce the environmental impact of hemp composite, this study aims to replace lime based binder by natural clay. Actually, the overall environmental impact of natural clay is low: the resource is available in large quantities, the energy
required to extract, transform and produce materials from earth is extremely low and it is a recyclable material.
The use of earth as a construction material is not new. It has been used for several thousand years in various regions of the world [Montgomery 2002]. Several researches have studied the effect of plant particle addition on the mechanical properties of earth-based composites. Bouhicha et al., showed that the strength of the most clayey earth (between 28 and 40% of clay) was improved by 10–20% by adding 1.5% of barley straw [Bouhicha 2005]. Another study has been conducted by Millogo [Millogo 2014] on two fibers lengths and different proportions. The optimum determined was a fiber content of 0.4%, which increased the strength by around 16% for short fibers (3 cm) and 8% for the longest fibers (6 cm). This increase of compressive strength was correlated with the characteristics of the plant used. But other authors reported that adding natural fiber reduce compressive strength. [Algin 2008] showed that the dry compressive strength was inversely proportional to the cotton content: a decrease of 71% was reached for an addition of 7% of cotton.
This study aims to developing a novel sustainable building material by coupling bio-based aggregate with a mineral binder. For environmental reason, natural clay was used. Such mineral matrix is highly interesting on hygric point of view, due to its capacity to regulate ambient relative humidity [Cagnon 2014]. On thermal point of view, clay is not a good thermal insulator due to its high density. For this purpose, the natural clay was coupled with hemp shiv for different hemp to binder ratio in order to reduce the composite thermal conductivity. The hemp to Binder ratio is estimated regarding traditional mix proportioning of hemp concrete used for floor, wall and roof.
In this study, we are interested in the mechanical properties of developed composites. The characterization is based on the measurement of compressive strength, tensile strength and elastic modulus. The effect of H/B ratio on these properties is also investigated. Optimization of clay-hemp composite formulation is then discussed.
2 MATERIALS AND METHODS
2.1 Binder
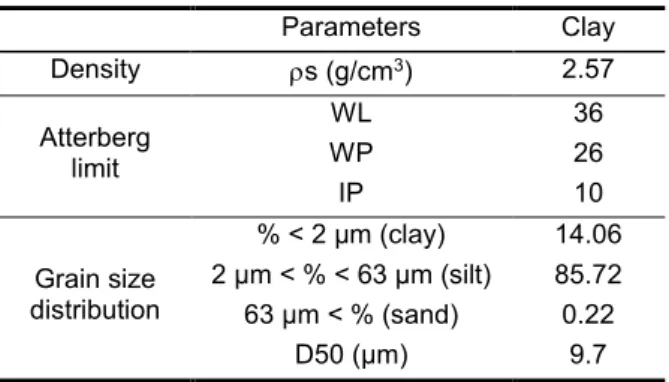
The used natural clay corresponds to a washing mud taken from a gravels production site. After decanting, the mud is dried in an oven at 100°C. After drying, the material is milled with a knife mill. The powder is then sieved with a square mesh of 2 mm side to remove the larger particles. For this material, the particle-size distribution curve determined by laser technique is shown in Fig. 1 and the main physical characteristics are summarized in Tab. 1. This material is mainly composed of silt (2 µm < D < 63 µm) with a medium value of the Atterberg liquid limit.
Fig. 1: Particle size distributions of clay
Fig. 2: X-ray diffractograph of clay
Fig. 2 gives the X-Ray diffractograph of the tested clay. The clay is composed of quartz, muscovite and kaolinite.
Tab. 24: Physical characteristics of natural clay
Parameters Clay Density s (g/cm3) 2.57 Atterberg limit WL 36 WP 26 IP 10 Grain size distribution % < 2 µm (clay) 14.06 2 µm < % < 63 µm (silt) 85.72 63 µm < % (sand) 0.22 D50 (µm) 9.7 2.2 Hemp shiv
The used shiv are commercial products Biofibat (from CAVAC France). Different characterization tests were performed in laboratories; they include among others: bulk density, water absorption and particle size distribution by two methods: mechanical sieving and image analysis. The characterization is performed following the recommendation of RILEM Technical Committee 236 Bio-aggregate based Building Materials [Amziane 2017].
Bulk density
The tests of bulk density were conducted according to the experimental protocol defined by RILEM TC 236. Before the test, the hemp shiv is dried in an oven at 60 °C until the mass change is less than 0.1% in 24 h. The bulk density of hemp shiv was measured at room temperature (21 ± 2°C) after cooling in sealed container. A glass cylinder of 10 cm in diameter and 20 cm in height and a balance accurate to 0.04g were used. The glass cylinder was filled with dry shiv (to about half the height of cylinder), the level was marked after up-ending the glass cylinder ten times, and the corresponding volume was measured with water. The bulk density of the hemp shiv is determined by the equation (1):
ρHS=MMS
WρW (1)
ρHS: Bulk density of Hemp shiv (kg/m3) MS: Mass of dry hemp shiv (g)
MW: Mass of water corresponding to the dry hemp shiv (g)
ρW: Density of water (1000kg/m3)
The bulk density of hemp shiv was the mean value of the measurements made on five different dry samples. The bulk density of hemp shiv is about 107± 3.3 kg/m3. This value is within range of values found in the literature [Arnaud 2012] [Nozahic 2012b].
Particle size distribution
The particle size distributions of hemp shiv are analysed by using two methods: mechanical sieving and image analysis [Amziane 2017].
The mechanical sieving method is the reference technique when dealing with characterization of mineral aggregates [AFNOR 1996]. For the analysis of vegetal origin aggregates, square mesh sieves are inappropriate because they do not take into account the elongation of aggregates [Igathinathane 2009].
Hence, the image analysis method was performed using a color scanner and ImageJ software to analyse scanned at 600 DPI images. This method was carried out on the hemp shiv sample weighing around 6g.
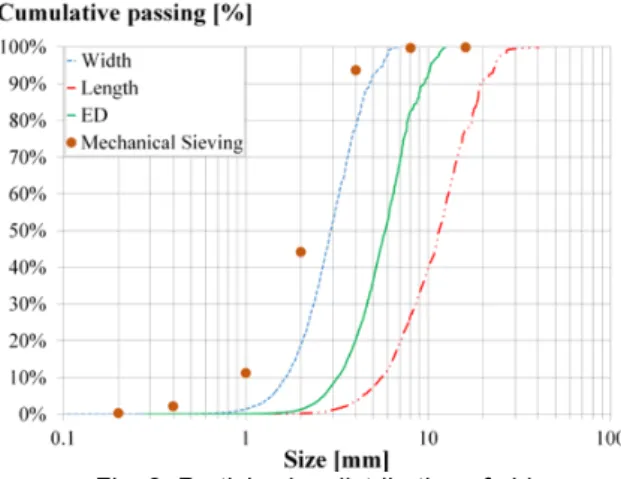
Fig. 3: Particle size distribution of shiv
Fig. 3 shows the particle size distribution of hemp shiv obtained with mechanical sieving and image analysis using ImageJ software. This figure indicates that the size distribution of hemp particles according to the width is very close to the distribution obtained by the sieve method. This result is in accordance with the literature [Nguyen 2010] [Nozahic 2012a] [Picandet 2012].
The result shows that hemp particle size was distributed from 0.14 mm to 6.8 mm, from 0.6 mm to 40.6 mm and from 0.36 mm to 12.48 mm according to the width, length and equivalent diameter respectively. The mean width of particles (w50) is 2.9 mm and the mean length is 11.5 mm.
Water absorption
The tests of water absorption were conducted according to the experimental protocol developed by the RILEM TC 236.
Before test, the shiv is dried in an oven at 60 °C until a mass change less than 0.1% in 24 h. The water absorption of hemp shiv was determined on five samples. The quantity of each dry sample is around 25g. The samples were immersed in water in a synthetic permeable bag and the mass was measured after 1, 15, 60, 240 minutes, and 48 hours. Before each weighting, the material was quickly dried with a salad spinner (100 rounds at approximately 2 rounds per second). The aim of this step was to eliminate the water adsorbed at the surface of plant particles or located among them.
The water absorption of the hemp shiv is calculated gravimetrically by the equation (2):
W(t) =m(t) − mm 0
0 ×100
(2) Where W (t) is the water absorption ratio at time t, m(t) the soaked hemp shiv aggregate mass at time t, and m0 is the initial mass after oven drying. The weighing is performed with a balance accurate to 0.04 g.
The variation of water absorption W versus time is fitted with the equation (3):
W(t) = IRA + K1. Log(t) (2)
Where K1 is a kind of diffusion rate in shiv cells (which correspond to the slope of the curve W (t) in function of logarithmic time), IRA represents the characteristic factor of the external water adsorption on the shiv
surface, and is related to the first minute measurement (which correspond to W (1min)).
Fig. 4 shows the water absorption capacity of hemp shiv. Obtained results are similar to the one produced in previous studies [Cérézo 2005] [Nguyen 2009] [Nozahic 2012b].
Fig. 4: Water absorption test of hemp shiv
We can observe two phases of absorption. The first one is a surface absorption phase which causes an almost instantaneous increase of the aggregates mass. It highlights the rapid nature of the wetting of hemp particles. The second phase is the slow absorption into the vegetable structure. This demonstrates the diffusive behavior of the water propagation in the structure up to 48 hours.
It can be seen that hemp shiv is able to absorb a large amount of water in a short period of time. Within 15 minutes of submersion, all five samples had absorbed around 200 % of their own weight in water. At the end of the test after 2 days of submersion, the all five samples had absorbed around 300 % of their own weight in water. These results confirm the high water absorption and retention capacity of hemp shiv, attributed to their high porosity and capillary structure in previous studies [Arnaud 2012], [Nozahic 2012b]. 2.3 Formulations and specimens production In this study, different composites were produced by mixing hemp shiv with natural clay binder with four Hemp/Binder ratios (0.4, 0.455, 0.5 and 0.75). The hemp to Binder ratio is estimated regarding traditional mix proportioning of hemp concrete used for floor, wall and roof [CEC 2007].
The hemp shiv was weighed and mixed by hand for about 2 min in a container with water to hemp mass ratio of 0.4.
At the same time, binder powder and water are mixed with the mixer to form a binder paste. In order to reach the same consistency of the mixtures for the production of the manufactured samples the W/B ratio was adjusted. The different ratios and mix compositions are summarized in Tab. 2.
The moist hemp was progressively added to the binder paste and mixing is continued for approximately 5 min until a homogeneous mix is obtained.
The mixture is then placed in cylindrical moulds of 10 cm of diameter and 20 cm in 4 layers: each layer is compacted at 0.1 MPa using a compressive testing machine [CEC 2007](Fig. 5). The moulds are oiled to facilitate sample extraction from the mould.
Fig. 5: Production process: a) Binder mixing; b) Hemp mixing by hand; c) Addition of the moist hemp and
mixing; d) Compaction
A cover is put and the specimens are kept for a period of at least 5 days after which the specimens were removed from the mould. The specimens are then kept at 23 °C and 50% of relative humidity until the day of the mechanical test. The mass was regularly measured after removing the specimens from the moulds.
Tab.2: Composition of the studied materials
Ratio Mass percentage (%) H/B W/B Binder Hemp Water
HCC-0.4 0.4 0.56 51.0 20.4 28.6
HCC-0.455 0.455 0.58 49.1 22.3 28.6
HCC-0.5 0.5 0.60 47.6 23.8 28.6
HCC-0.75 0.75 0.80 39.2 29.4 31.4 2.4 Specimen preparation
Saw-cutting the specimen ends for surface preparation was tried but proved unsuccessful; the cohesion of material is insufficient for the cutting. Specimens are prepared with a fast-hardening plaster to cap both ends in order to ensure flat and parallel end surfaces, and to ensure homogeneous distribution of loading (Fig. 10). Although this introduces a small amount of water to the ends of the specimens, this was found to be the best technique.
Fig. 6: specimen preparation
2.5 Mechanical properties
Mechanical tests are made with a universal machine (Instron®) of capacity 400 kN controlled in displacement (cyclic loading) with a data recording at 0.10 Hz. Displacement control tests were conducted with a loading rate of 10 mm/min.
For compressive strength three cylinders per formulation were tested. The test protocol includes two loading unloading cycles. The first unloading is started when the load reaches 1KN and the second unloading is started when the displacement reaches 10 cm. Cyclic loading allows the analysis of the effect of loading and unloading on elastic behavior.
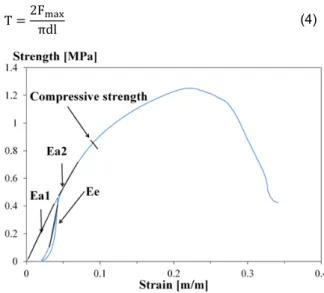
The identification of compressive strength in the case of compacting behavior is not defined by the community. Wood industry uses the strength obtained for 10% of strain. In our case, compressive strength is understand as the transition between reversible behavior and compacting behavior. Then the compressive strength was established as the slope change stress on the curves strain-stress.
Three moduli are determined, which can be calculated as shown in Fig. 7. The initial apparent modulus Ea1 corresponds to the slope at the beginning of loading in the strain-stress curve. The elastic modulus Ee corresponds to the slope of linear portion of unloading cycle. The second apparent modulus Ea2 corresponds to the slope of linear portion at the second cycle of loading in the strain-stress curve.
For tensile strength by splitting, two cylinders per mix were tested by applying a linear load onto the specimen generator. Splitting tensile strength, T, in MPa was calculated using Eq. (4).
T =2Fπdlmax (4)
Fig. 7: Identification of apparent and elastic modulus
3 RESULTS AND DISCUSSION
3.1 Density of formulations
The variation of the specimen density with different H/B ratios was measured as a function of drying time (Fig. 8). The density of each formulation was the mean value of the measurements made on five different specimens. The typical drying time is about 35 days whatever the H/B ratio (the stabilization time is reached when the change in density of the sample was less than 0.1% in 24 h). This result is in line with the observation realized in a previous study [Nguyen 2010] and [Nozahic 2012a], which show that the mass stabilization is reached after around 40 days. The variations are the most intense during the first week of drying and these variations were insignificant after 25 day.
Fig. 8: Variation of the specimen’s density as a function of drying time
Fig. 9 shows the variation of density at 23 °C and 50% RH versus H/B ratio. It can be observed that this density decreases logarithmically with H/B ratio. The correlation coefficient is very close to 1. In fact, the density ranges between 373 kg/m3 and 510 kg/m3. The decreases of density can be explained by the lower hemp density itself and by higher water content. The relation between the density and the H/B ratio can be presented by the following Eq. (5) for H/B ratio between 0.4 and 0.75:
ρHCC= −212.8 ×ln (HB) + 310.22 (5)
Fig. 9: Variation of density at 23 °C and 50% RH versus H/B ratio
3.2 Compressive strength
To characterize the influence of H/B ratio on mechanical properties of hemp clay composite (HCC), five specimens of each formulation were manufactured and tested after 3 months of setting and drying. Fig. 10 shows typical compressive stress-strain curves for hemp clay composite with different H/B ratio. For HCC formulations with H/B ratio equal to 0.4, 0.455 and 0.5 the failure of specimen is between 25% and 30% of strain. For the formulation with H/B ratio equal to 0.75, the compression does not lead to the failure of specimen, but induces a continuous compaction with increase of the stress. This compaction phenomenon is similar to what is observed in some highly porous materials under compression, constrained compression or indentation [Arnaud 2012] and [Nguyen 2009].
The compressive strength was established as the slope change stress as mentioned on each curve on Fig. 10. The different mechanical properties obtained are summarized in Tab. 3.
The variation of the compressive strength of the composite as a function of H/B ratio is shown in Fig. 11. The results show that the average compressive strength of all formulations ranges between 0.39 MPa and 0.48 MPa. For the lime–hemp concrete, the average compressive strength varies from 0.1 MPa to 0.8 MPa [Arnaud 2012] and [Elfordy 2008]. It can be seen that the compressive strength of all the produced composite materials meets the requirements of the intended use recommended by the French professional rules for hemp concrete structures [CEC 2010].
It can be seen that the compressive strength decreases with H/B ratio. Actually, the compressive strength decrease by 17% when the H/B ratio varied from 0.4 to 0.75. The decrease of compressive
strength with H/B ratio can be explained by the increasing of porosity, which agrees with some previous works [Jorillo, 1992] and [Mac Vicara et al., 1999].
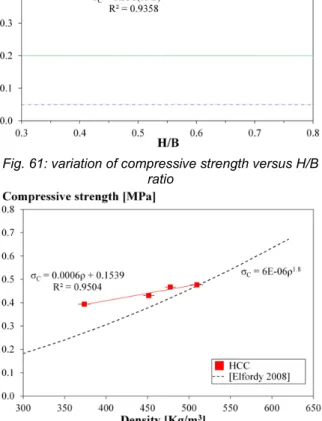
In fact, the compressive strength of the studied materials is greatly influenced by the variation of the density (Fig. 12). The resistance of the composites is improved when the density increases. The relation between the compressive strength and density can be presented by the following Eq. (6):
σHCC= 0.0006×ρ + 0.1539 (6)
Similar relationship between mechanical resistance and density are found for lime–hemp concrete [Arnaud 2012] [Elfordy 2008].
Fig. 10: Compressive strength tests on the hemp clay composite after 3 month with curing at 23°C and 50%
RH
Fig. 61: variation of compressive strength versus H/B ratio
Fig. 12: variation of compressive strength versus density
Tab. 3: Mechanical properties of different formulations
Formulations ρ (kg/m3) σ
C (MPa) σT (KPa) Ea1 (MPa) Ee (MPa) Ea2 (MPa)
HCC-0.4 509.48 0.48±0.01 26.24±2.30 3.27±0.24 26.12±0.67 4.04±0.14
HCC-0.455 477.36 0.47±0.01 25.99±1.00 2.80±0.14 23.52±0.84 3.74±0.16
HCC-0.5 451.51 0.43±0.01 21.63±0.87 2.76±0.04 20.19±0.61 3.73±0.05
HCC-0.75 373.71 0.39±0.001 20.61±1.76 2.62±0.09 16.25±0.09 3.64±0.1
3.3 Tensile strength
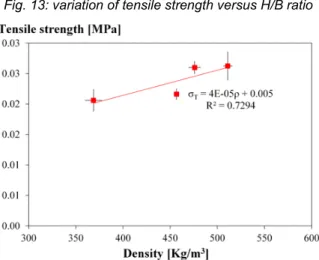
The variation of the tensile strength of the composite as a function of H/B ratio is shown in Fig. 13. The tensile strength is strongly influenced by the H/B ratio. In fact, it decreases by 17% when the H/B ratio varied from 0.4 to 0.75. Like for compressive strength, the tensile strength increases quite linearly with density (Fig. 14).
The tensile strength increases when compressive strength increases. This evolves according to exponential function with very good correlation as shown in Fig. 15 (yielding correlation coefficient of R2 = 0.9869). The relation between the compressive strength and the tensile strength can be presented by the following Eq. (7):
σT= 0.0058×𝑒(3.1806×𝜎𝑐) (7)
Fig. 13: variation of tensile strength versus H/B ratio
Fig. 14: variation of tensile strength versus density
Fig. 15: variation of tensile strength versus compressive strength
3.4 Elastic modulus
Fig. 16 shows the variation of elastic modulus of the composites as a function of H/B ratio.
The elastic modulus decreases with H/B ratio. This result is in agreement with other studies incorporating hemp Fibers [Quagliarini et al., 2010]. The relation between the elasticity modulus and H/B ratio can be given by Eq. (10):
Ee= 12.878 × (HB) −.0742
(8)
Fig. 16: variation of elastic modulus versus H/B ratio
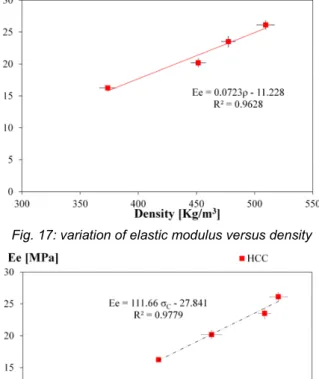
Fig.17 presents the variation of elastic modulus in function of density. The results show a linear relation. The linear evolution of elastic modulus and compressive strength with density lead to highlight a linear relation between elastic modus and compressive strength. This relation is presented in 18 with very good correlation.
Fig. 17: variation of elastic modulus versus density
Fig. 18: variation of elastic modulus versus compressive strength
3.5 Apparent modulus
The effect of H/B ratio on apparent modulus is shown in Fig. 19. As it can be seen, the apparent modulus decreased as the hemp content increased, in accordance with other studies incorporating hemp fibers in lime [Del Valle-Zermeño 2016] [Tronet 2016]. The apparent modulus Ea1 decrease by 20 % when H/B ratio varied from 0.4 to 0.75.
Fig. 19: variation of apparent modulus versus H/B ratio
It can be clearly seen that Ea2 is higher than Ea1 by 24–39% depending on the H/B ratio used. In fact, the cycle loading unloading enhances the apparent modulus due to little compaction effect.
The effect of density on apparent modulus Ea1 and Ea2 is shown in Fig. 20. It appears that the influence of density is negligible on Ea1 and Ea2 which are quite constant. The composite with H/B ratio equal to 0.5
have lower apparent modulus (Ea2) than the minimum apparent modulus for wall recommended by the French professional rules for hemp concrete structures [CEC 2010], which equal to 15 MPa. However, the roof formulation of composite have higher value than the minimum apparent modulus for roof recommended by the French professional rules for hemp concrete structures [CEC 2010], which equal to 3 MPa.
Fig. 20: variation of apparent modulus versus density
4 CONCLUSION
This study investigates the use of clay as binder for hemp composite with several hemp to binder ratios and studies their effect on mechanical properties. The density of the hemp composites decreases with H/B ratio. The composite materials shows similar density as traditional hemp-lime concrete which ranges generally between 350 kg/m3 and 550 kg/m3.
The mechanical properties depend strongly on the H/B ratio. The compressive strength ranges from 0.39 to 0.48 MPa and the tensile strength ranges from 0.021 to 0.026 MPa for hemp clay composite when H/B ratio ranges between 0.4 and 0.75.
The experimental results show that all formulations have ductile behavior. Note that formulations with highest H/B ratio show steadily increasing strength with deformation. Since the force–displacement curve does not show a peak in this case.
The results show that the hemp clay composites have an apparent modulus lower than the requirements of the intended use [CEC 2010]. The apparent modulus is not very representative of the real elastoplastic behavior of this kind of material. For this reason, we will take the elastic modulus, which is determined on loading/unloading cycles as representative value of these materials that satisfies the value recommended by the French professional rules for hemp concrete structures [CEC 2010].
The mechanical strength drops with a decrease in density. But, the ductility increases, which could induce settlement of the wall and reduce the crack occurrence.
The results show that the mechanical performance of produced composite materials meets the requirements of the intended use.
5 REFERENCES
[AFNOR 1996] AFNOR, Essais pour déterminer les caractéristiques géométriques des granulats – Partie 2: détermination de la granularité – Tamis de contrôle,
dimensions nominales des ouvertures-Norme NF EN 933-2, 1996.
[Algin 2008] Algin, H.M.; and Turgut, P.; Cotton and limestone powder wastes as brick material. Construction and Building Materials, 2008, Volume 22, pp. 1074–1080.
[Amziane 2013] Amziane, S.; Arnaud, L.; Bio-aggregate-based Building Materials, Applications to Hemp Concrete, ISTE Ltd and John Wiley & Sons, Inc, 2013.
[Amziane 2017] Amziane, S.; Collet, F.; eds., Bio-aggregates Based Building Materials, Springer
Netherlands, Dordrecht, 2017.
http://link.springer.com/10.1007/978-94-024-1031-0 (accessed February 23, 2017).
[Arnaud 2012] Arnaud, L.; Gourlay, E.; Experimental study of parameters influencing mechanical properties of hemp concretes, Construction and Building Materials, 2012, Volume 28, pp. 50-56.
[Bouhicha 2005] Bouhicha, M.; Aouissi, F.; and Kenai, S.; Performance of composite soil reinforced with barley straw. Cement and Concrete Composites, 2005, Volume 27, pp. 617–621.
[Boutin 2005] Boutin, M.-P ; et al. ; Analyse du cycle de vie de: Compounds thermoplastiques chargés fibres de chanvre et Mur en béton de chanvre banché sur ossature en bois ,INRA Lille, 2005.
[Cagnon 2014] Cagnon, H.; et al. ; Hygrothermal properties of earth bricks, Energy and Buildings, 2014, Volume 80, pp. 208–217.
[Collet 2012] Collet, F.; and Pretot, S.; Experimental investigation of moisture buffering capacity of sprayed hemp concrete. Construction and Building Materials, 2012, Volume 36, pp. 58–65.
[Collet 2013] Collet, F.; et al. ; Comparison of the hygric behaviour of three hemp concrete. Energy and Building, 2013, Volume 62, pp. 294–303.
[Collet 2014] Collet, F.; & Pretot, S.; Thermal conductivity of hemp concretes: Variation with formulation, density and water content, Construction and Building Materials, 2014, Volume 65, pp. 612–619. [CEC 2007] Association Construire en Chanvre; FFB ; Règles professionnelles d'exécution d'ouvrages en béton de chanvre, Ed. SEBTP, 2007. ISBN 9782915162448.
[CEC 2010] Construire en Chanvre, «Construire en Chanvre - Règles Professionnelles (RP2C)», France, 2010
[Cérézo 2005] Cérézo, V.; Propriétés mécaniques, thermiques et acoustiques d'un matériau à base de particules végétales: approche expérimentale et modélisation théorique. PhD. thesis. Institut National des Sciences Appliquées de Lyon, 2005.
[Del Valle-Zermeño 2016] Del Valle-Zermeño, R.; Aubert, J.E.; Laborel-Préneron, A.; Formosa, J.; and Chimenos, J.M. ; Preliminary study of the mechanical and hygrothermal properties of hemp-magnesium phosphate cements. Construction and Building Materials, 2016, volume 105, pp. 62–68.
[Elfordy 2008] Elfordy, S.; Lucas, F.; Tancret, F.; Scudeller, Y.; Goudet, L.; Mechanical and thermal properties of lime and hemp concrete (“hempcrete”) manufactured by a projection process. Construction and Building Materials, 2008, Volume 22, pp. 2116– 2123.
[Evrard, 2006] Evrard, A.; Sorption behaviour of Lime-hemp concrete and its relation to indoor comfort and energy demand, in: 23rd Conference on passive and low energy architecture, Geneva, Switzerland, 2006, pp.6–8.
[Igathinathane 2009] Igathinathane, C.; Pordesimo, L.O.; Columbus, E.P.; Batchelor, W.D.; and Sokhansanj, S.; Sieveless particle size distribution analysis of particulate materials through computer vision. Computers and Electronics in Agriculture, 2009 Volume 66, pp. 147–158.
[Jorillo 1992] Jorillo, P.; Shimizu, G.; Coir Fibre Reinforced Cement Based Composite. Part 2. Fresh and Mechanical Properties of Fiber Concrete Fibre Reinforced Cement and Concrete: The Fourth International Symposium Held by RILEM, University of Sheffield, E and FN Spon, UK, Sheffield (1992) [Laurent 2012] Laurent, A.; and Etienne, G.; Experimental study of parameters influencing mechanical properties of hemp concretes, Construction and Building Materials, 2012, Volume 28, pp. 50–56.
[Mac Vicara 1999] Mac Vicara, R.; Matuanab, L.M.; Balatinecza, J.J.; Aging mechanisms in cellulose fiber reinforced cement composites. Cem. Concr. Compos., 1999, Volume 21, pp. 189–196.
[Millogo 2014] Millogo, Y.; Morel, J.-C.; Aubert, J.-E.; and Ghavami, K.; Experimental analysis of Pressed Adobe Blocks reinforced with Hibiscus cannabinus fibers. Construction and Building Materials, 2014, Volume 52, pp. 71–78.
[Montgomery 2002] D.E. Montgomery, Dynamically-Compacted Cement Stabilised Soil Blocks for Low-Cost Walling, Thesis, University of Warwick, Warwich, 2002.
[NF 06] Norme NF EN 196-1 « Méthodes d’essais des ciments Partie 1: Détermination des résistances mécaniques », 2006.
[Nozahic 2012a] Nozahic V. ; Vers une nouvellement démarche de conception des bétons de végétaux lignocellulosiques basée sur la compréhension et l’amélioration de l’interface liant/ végétal application à des granulats de chènevotte et tige de tournesol associés à un liant ponce/ chaux”. Thèse de doctorant. Université Blaise Pascal, 2012.
[Nozahic 2012b] Nozahic, V.; Amziane, S.; Torrent, G.; Saïdi, K. et al.; Design of green concrete made of plant-derived aggregates and a pumice–lime binder. Cement & Concrete Composites, February 2012, Volume 34, Issue 2, pp. 231-241, ISSN 0958-9465. [Nguyen 2009] Nguyen, T.T.; Picandet, V.; Amziane, S.; Baley, C.; Influence of compactness and hemp hurd characteristics on the mechanical properties of lime and hemp concrete. European Journal of Environmental and Civil Engineering, November 2009, Volume 13, Issue 9, pp. 1039-1050, ISSN 1964-8189. [Nguyen 2010] Nguyen, T.T. ; Contribution à l’étude de la formulation et du procédé de fabrication d’éléments de construction en béton de chanvre (Contribution to the mix design and the manufacture process for products made of hemp concrete) Ph.D. thesis, Université Européenne de Bretagne, France, 2010 (in French).
[Picandet 2012] Picandet, V.; Tronet, P.; and Baley C.; Caractérisation granulométrique des chènvottes. XXXe Rencontres AUGC-IBPSA Chambéry, Savoie, 2012.
[Pretot 2014] Pretot, S.; et al.; Life cycle assessment of a hemp concrete wall: impact of thickness and coating, Building and Environment, 2014, Volume 72, pp. 223– 231.
[Quagliarini 2010] Quagliarini, E.; and Lenci, S.; The influence of natural stabilizers and natural fibres on the mechanical properties of ancient Roman adobe bricks. ResearchGate, 2010, Volume 11, pp. 309–314.
[Tran Le 2010] Tran Le, A.-D.; and al.; Transient hygrothermal behaviour of a hemp concrete building envelope. Energy and Buildings, 2010, Volume 42, pp. 1797–1806.
[Tronet 2016] Tronet, P.; Lecompte, T.; Picandet, V.; and Baley, C.; Study of lime hemp concrete (LHC) – Mix design, casting process and mechanical behaviour. Cement and Concrete Composites, 2016, Volume 67, pp. 60–72