Effect of fouling on performance of pressure
retarded osmosis (PRO) and forward osmosis (FO)
The MIT Faculty has made this article openly available.
Please share
how this access benefits you. Your story matters.
Citation
Nagy, Endre et al. "Effect of fouling on performance of pressure
retarded osmosis (PRO) and forward osmosis (FO)." Journal of
Membrane Science 565 (November 2018): 450-462 © 2018 Elsevier
B.V.
As Published
http://dx.doi.org/10.1016/J.MEMSCI.2018.08.039
Publisher
Elsevier BV
Version
Author's final manuscript
Citable link
https://hdl.handle.net/1721.1/128545
Terms of Use
Creative Commons Attribution-NonCommercial-NoDerivs License
Effect of fouling on performance of pressure retarded osmosis (PRO) and forward osmosis (FO)
Endre Nagya,*, Imre Hegedüsa, Emily W. Towb, John H. Lienhard Vb
a Chemical and Biochemical OperationResearch Laboratory, Research Institute of Biomolecular and Chemical Engineering, University of Pannonia, Egyetem u. 10, H-8200, Veszprém, Hungary
bRohsenow Kendall Heat Transfer Laboratory of Mechanical Engineering, Massachusetts Institute of Technology, Cambridge, Massachusetts, USA
Corresponding author: Tel.: 0036-20-351-8727; Fax: 0036-88-624038; email: nagy@mukki.richem.hu; nagye@mik.vein.hu
Abstract
A layered model is developed to describe mass transport through fouled membranes in pressure retarded osmosis (PRO) and forward osmosis (FO) processes. This resistance-in-series model accounts for salt and water transport through the active layer, support layer, external boundary layers, and the cake layer formed by foulants. Closed-form algebraic expressions for the water flux, salt flux, salt concentration profile, and overall transport coefficients are presented for FO membranes in both membrane orientations. Organic fouling experiments using alginate are used to validate the model and observe the effects of feed salinity, cross-flow velocity, membrane orientation, feed spacers on foulant accumulation rates. Increasing feed salinity and cross flow velocity both lead to a decrease in foulant accumulation in PRO orientation. Under identical operating conditions, foulant accumulation rates are comparable in FO and PRO modes, suggesting that the drivers of cake formation are independent of membrane orientation. Feed spacers reduce foulant accumulation rate. The model is then evaluated to show how foulant accumulation affects FO system performance in both membrane orientations. The model is also used to elucidate the effect of fouling on power production in PRO: fouling affects the optimal PRO operating pressure, and a 0.5 mm-thick cake layer can reduce power production by 50%. The mathematical expressions developed serve as a simple tool to predict the performance of fouled membranes in both PRO and FO processes.
Nomenclature
A water permeability, m/(s bar) B salt permeability, m/s
C salt concentration, kg/m3, g/L
dp equivalent particle diameter of the porous support layer, m
D fluid diffusion coefficient, m2/s Dh hydraulic diameter, m
Js solute transport rate, kg/m2s
Jw water flux, m/s
k convective mass transfer coefficient, m/s S structural parameter, m
v convective fluid velocity perpendicular to the membrane surface, m/s Greek
transport coefficient, m/s osmotic pressure, bar
porosity
kinematic viscosity, Pa-s tortuosity
P hydraulic pressure difference, bar
Δ osmotic pressure difference of the active layer, bar Φ fractional extent of support layer infill
Subscripts
c cake layer
d draw solution
f feed solution
m membrane active layer
ov overall
s interface between selective and the support layer (with P, π, , or C) s support layer (with S, , , , or D)
sp external interface of the support layer
1. Introduction
Osmotically-driven membrane processes (ODMPs), such as pressure retarded osmosis (PRO) and forward osmosis (FO), are promising and intensively researched membrane technologies in energy generation processes [1-7] and water desalination [8-10]. However, the ability of these systems to produce water or power economically (see Ref. [11]) is affected by the accumulation of foulants on the membrane over time. In order to predict long-term system performance, models are needed for salt and water transport through fouled membranes. McGovern et al. [12] used a simple layered model of unfouled membranes, neglecting salt permeation and external concentration polarization, to examine the membrane orientation that maximized flux in PRO or FO in terms of dimensionless groups. Nagy [13] developed a resistance-in-series model of mass transfer through each layer of a clean FO/PRO membrane, including both salt permeation and external concentration polarization. This model included algebraic expressions for salt and water transfer rates and the concentration distribution throughout the clean membrane. By adding a fouling layer to Nagy’s model (Ref. [13]), Tow and Lienhard [14] modeled mass transport through fouled FO and RO membranes with the active (selective) layer facing the feed solution and enabled the estimation of fouling layer thickness from measured flux decline. However, the Tow and Lienhard model required the solution of several equations simultaneously and did not address fouled membranes in PRO mode. In this paper, algebraic expressions are developed for salt and water transport through fouled FO membranes with the active layer facing either the feed or the draw solution (FO or PRO mode, respectively).
This work builds on past models of fouling of porous membranes as well as ODMPs. Several models have previously been developed to describe rates and mechanisms of foulant accumulation and flux decline in porous membranes such as microfiltration and ultrafiltration [15,16]. Although such models do not include the cake-enhanced concentration polarization that occurs in ODMP fouling due to the high salt rejection of osmotic membranes [17], they still provide insight into the mechanisms and rates of foulant deposition and removal. The classic resistance-in-series model [16] effectively describes the time-dependent fouling resistance for porous membranes that do not have significant cake-enhanced concentration polarization. Colloidal filtration models, friction force models and empirical particle adhesion models have been proposed to describe the behavior of different forms of fouling [16]. Bowen and Jenner [18] review colloidal foulant accumulation and removal mechanisms
and models, including gel polarization theory (see [15]), which uses concentration-dependent diffusivity and viscosity to describe the behavior of fouling macromolecules. Mechanisms and models of fouling specific to ODMPs were reviewed by She et al. [19]. Hoek and Elimelech [17] describe cake-enhanced concentration polarization and hydraulic resistance using the Carman-Kozeny equation for a cake layer modeled as an agglomeration of spherical particles. Using a similar approach, Tow and Lienhard [14] considered both hydraulic resistance and cake-enhanced concentration polarization in modeling the relationship between foulant cake thickness and flux decline in FO and RO. Semi-empirical models have also been developed for flux decline in full-scale RO systems [20,21]. She et al. [22] investigated fouling in PRO systems with real wastewater containing both organic and inorganic foulants and found that the limiting flux was independent of the applied pressure.
Most of these ODMP models agree that solute transport through the support layer in RO, PRO and FO systems is determined by convection and diffusion processes, while water transport is governed by viscous flow through a porous medium. However, the equations used to describe these flows and the parameters used to quantify foulant layer structure vary between models. In the simplest model [14], the effect of fouling layer structure on water and solute transport is characterized by only two parameters: cake structural parameter (analogous to that of the membrane support layer) and the pore hydraulic diameter. Incorporating the foulant cake transport model of Tow and Lienhard [14] into the layered transport model of Nagy [13], an algebraic relationship can be defined between foulant accumulation and flux decline in both FO and PRO processes. Through this model, the salt and water fluxes through fouled membranes can be calculated using closed-form mathematical expressions.
In this paper, this layered model of transport through fouled FO and PRO membranes is presented and used to analyze experimental measurements and predict the effect of fouling on the performance of FO and PRO. Effect of foulant accumulation on both water production in FO and power production in PRO are predicted. Experimental flux decline measurements due to alginate fouling in FO and PRO are analyzed to determine the evolution of foulant thickness over time and highlight effects of feed salinity, cross-flow velocity, and feed spacers on foulant accumulation. Through the development and evaluation of this transport model, this study enhances understanding of the mechanisms of fouling-induced ODMP performance decline and provides a new tool for predicting the effect of fouling on water and power production.
2. Theory
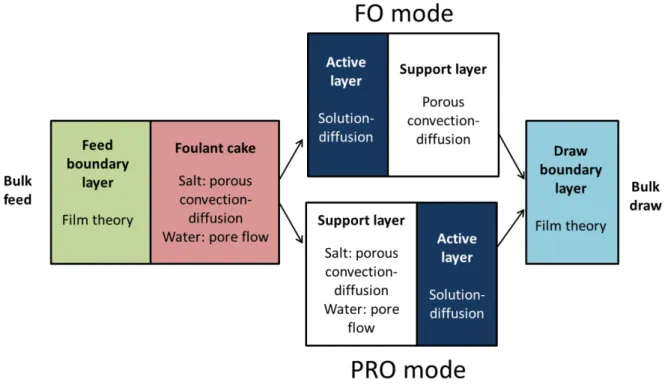
In this section, expressions are developed for the solute and water fluxes through fouled FO membranes in FO or PRO mode. Solute transfer rates are defined for every transport layer, including the fouling layer, and set equal to enable calculation of solute flux, solute concentrations at interfaces, and water flux. The transport layers considered in this model are shown for PRO mode (when the high-salinity draw solution faces the active layer) in Fig. 1a and FO mode (when the draw solution faces the support layer) in Fig. 1b. Figure 2 illustrates the present layered transport model, including the relevant transport phenomena for each layer. The methodology used for determining solute and water fluxes through a fouled membrane with five distinct transport layers is analogous to that used for the four layers of an unfouled FO or PRO membrane [13] with the addition of convective–diffusive solute transport and viscous water flow through the foulant layer (as in Ref. [14]) and, in PRO mode, the fouled support layer.
structural parameter of FO membranes, can be defined to describe the effective thickness of the cake layer [14]: , (1) c c c c S
where c, c, and c are the thickness, tortuosity, and porosity of the cake layer, respectively. The high porosity and correspondingly low tortuosity of alginate gels [23] (the foulant used in the experimental section of this paper) dictate that the value of c/c is close to unity, and thus the equality c=Sc is a
reasonable approximation in the case of alginate. Having defined a cake structural parameter, salt transport through the cake layer can be predicted with the same equation used for the membrane’s support layer [13,14] (i.e., with Eq. (2e) in the following section).
In PRO mode, some foulant material may also deposit within the support layer. However, highly hydrated foulants like alginate have high porosity and low tortuosity, so the structural parameter of the support layer should not change significantly as a result of foulant infill. Therefore, the structural parameter of the support layer will be assumed to be constant during fouling in both membrane orientations. If dispersion (convection-enhanced diffusion; see Sec. 2.5c) occurs in the support layer in PRO mode, internal deposition of foulants could reduce the pore hydraulic diameter, thus limiting dispersion and reducing flux. However, dispersion has not been previously studied in PRO, and the effective diffusion coefficient in the support layer is assumed not to change as a result of fouling in this model.
2.2. Solute transport in PRO mode
In PRO mode, the high-salinity draw solution is facing the active layer, while the feed solution is in contact with the support layer. Due to convection of foulants toward the membrane, the fouling layer tends to form on the feed-facing side of the support layer, but fouling may also occur inside of the support layer because of its porous structure [19]. The solute concentration distribution in PRO mode is illustrated in Fig. 1a. Equation (2) expresses the salt flux, Js, as a function of concentrations at
interfaces surrounding: (a) the draw boundary layer; (b) the active layer; (c) the support layer; (d) the feed boundary layer, as derived in Ref. [13]; and (e) the fouling layer, as derived in [14]:
; (2a) ; (2b)
J / kw d
s d d m J C e CJ
s
B C
m
C
s
; (2c) ; (2d)
J S / Dw s s
s sp s sp J C e C J / kw f s f c f J C e C ; (2e)
J S / Dw c c
s c sp cJ
C e
C
where the transport coefficients, β, are defined as follows:
; (3a) ; (3b) ; (3c) 1 w d J / k w d J e 1 w sp J S / D w J e 1 w c J S / D w c c J e . (3d) 1 w f J / k w f J e
Js denotes salt transport rate, C denotes solute concentration, and denotes transport coefficient.
Subscripts d, m, s, sp, c, and f denote interfaces and are defined in Fig. 1a. Ss and Sc denote the
structural parameter of the support layer and cake layer, respectively. Ds and Dc denote the solute
diffusion coefficient within the support layer and cake layer, respectively, which differ somewhat because of the dependence of diffusion coefficient on concentration (see, e.g., Ref. [24] for sodium chloride).
As discussed in Sec. 2.1, it is assumed that foulant accumulation inside the support layer does not change the membrane support layer’s structural parameter appreciably, which is reasonable in the case of a highly-hydrated foulant like alginate gel. However, foulant accumulation inside the support layer may reduce its hydraulic diameter and thus raise the hydraulic pressure drop through the support layer, as will be discussed in Sec. 2.4.
Combining Eqs. (2a-e) and (3a-d) to eliminate unknown interface concentrations, the salt transfer rate can be expressed as a function of the feed and draw concentrations and water flux (see Ref. [13] for analogous analysis in the absence of a fouling layer):
. (4)
1 1 1 Jw / kf S / Dc c S / Ds s J / kw d d f s Jw / kf S / Dc c S / Ds s J / kw d w w C e C e J e e J B J Substituting Eq. (4) into Eq. (2b), the concentration difference across the active layer can be expressed as follows: . (5)
1 11
Jw / kf S / Dc c S / Ds s J / kw d d f m s Jw / kf S / Dc c S / Ds s J / kw d wC e
C e
C
C
B
e
e
J
This expression for concentration difference across the active layer of a fouled membrane in PRO mode closely resembles that of an unfouled membrane (see Ref. [13]), but includes SC/DC in two of the
exponents because the fouling layer adds a resistance in series with the support layer and feed boundary layer. By adding to the total feed-side mass transfer resistance, a cake layer reduces the concentration difference across the membrane and thus the transmembrane flux.
For ideal feed and draw solutions, the osmotic pressure is proportional to solute concentration, and the osmotic pressure difference across the active layer will be:
. (6)
1 11
Jw / kf S / Dc c S / Ds s J / kw d d f m Jw / kf S / Dc c S / Ds s J / kw d we
e
B
e
e
J
2.3. Solute transport in FO mode
In FO mode, the feed solution faces the active layer, while the draw solution is in contact with the support layer. Due to convection of water from the feed toward the membrane, a fouling layer tends to form on the feed-facing side of the active layer [19]. The solute concentration distribution in PRO mode is illustrated in Fig. 1b. Equation (7) expresses the salt flux, Js, as a function of
concentrations at interfaces surrounding (7a) the draw boundary layer, (7b) the support layer, (7c) the active layer, and (7d) the feed boundary layer, as derived in Ref. [13], as well as the fouling layer (7e):
; (7a) ; (7b)
J / kw d
s d d spJ
C e
C
J
s
sp
C e
sp J S / Dw s s
C
s
; (7c) ; (7d)
s s mJ
B C
C
J
s
c
C e
m J S / Dw c c
C
c
; (7e) J / kw f s f c f J C e C where subscripts d, sp, s, m, c, and f denote the bulk draw, support layer on the draw side, support layer where it meets the active layer, active layer where it meets the foulant cake, feed-side of the foulant cake, and bulk feed, respectively, and transport coefficients (β) are defined in Eqs. (2a-2d).
Combining Eqs. (7a) to (7e), the salt flux can be expressed as a function of the known feed and draw concentrations and the water flux:
. (8)
1 1 1 11
1
J / k S / D Jw / kd S / Ds s w f c c d f s Jw / kf S / Dc c Jw / kd S / Ds s wC e
C e
J
e
e
B
J
The concentration difference across the active layer can then be expressed as:
, (9)
1 1 1 11
J / k S / D Jw / kd S / Ds s w f c c d f s m Jw / kf S / Dc c Jw / kd S / Ds s wC e
C e
C
C
B
e
e
J
If the feed and draw solutions can be considered ideal, the osmotic pressure difference between the draw and feed sides of the active layer can be expressed as:
. (10)
1 1 1 11
J / k S / D Jw / kd S / Ds s w f c c d f m Jw / kf S / Dc c Jw / kd S / Ds s we
e
B
e
e
J
Comparing Eqs. (8–10) to those for an unfouled membrane (see Ref. [14]), the cake layer resistance, Sc/Dc, is simply added to the feed-side boundary layer resistance. Equation (9) can be used
to calculate water flux through a fouled membrane as described in Sec. 2.5. This model can also be used to calculate the solute concentration at interfaces within the membrane using the equations shown in Appendix B.
2.3. Overall transport coefficients
The salt flux can be expressed as the product of an overall transport coefficient, ov, and an
overall driving force. Evaluation of the overall transport coefficient can aid in understanding transport through fouled membranes. Equation (4) for PRO mode and Eq. (8) for FO mode can be rearranged into the following form:
, (11)
1 1
Jw / kf S / Dc c S / Ds s / kd s ov d f J C C e where ov depends on the membrane orientation. In PRO mode,
, (12)
1 1
1 1 1 ov J / k w d Jw / kf S / Dc c S / Ds s / kd w e e B J and in FO mode: . (13)
1
1 1
1 1 1 ov J / k S / D w d c c Jw / kd S / Dc c S / Ds s / kf w e e B J 2.4. Water transportRegardless of membrane orientation, water flux can be calculated from the membrane’s water permeability, A, and the hydraulic and osmotic pressure differences across the active layer:
, (14)
𝐽𝑤= 𝐴(∆𝜋𝑚‒ ∆𝑃𝑚)
where ΔPm is the hydraulic pressure difference across the active layer (defined, here, as the draw side
minus the feed side pressure). The osmotic pressure difference, Δπm (defined, here, as the draw side
minus the feed side osmotic pressure), is given by Eq. (6) in PRO mode and Eq. (10) in FO mode. The pressure on the feed side of the active layer may be lower than the feed pressure due to hydraulic resistance to flow through the foulants. The hydraulic pressure difference across the active layer depends on the feed pressure, Pf, draw pressure, Pd, and pressure drops through the cake layer,
ΔPC, and support layer, ΔPS:
. (15)
The pressure difference across the cake layer is given by Eq. (16)1 [17]: , (16) 2 2 32 c c w 32 c w c h h S J S J P D D
where μc is the dynamic viscosity of water, τc is the tortuosity of the foulant cake (which is close to 1
in the case of alginate gel), and Dh is the hydraulic diameter of the foulant cake. The pressure
difference across the support layer, ΔPS, is typically assumed to be negligible. We assume ΔPS = 0 in
FO mode, but may become significant in PRO mode because foulants may fill in the pores of the support layer [19] and reduce the hydraulic diameter of the water flow path. In PRO mode, the pressure drop through the support layer can be estimated using an analogy to the external foulant cake, assuming the cake hydraulic diameter is much less than the support layer hydraulic diameter:
, (17) 2 2
32
s c s w32
s s w s,PRO c h hS J
S J
P
D
D
where Φ represents the fractional extent of support layer foulant infill, τS is the tortuosity of the
support layer, φc is the cake porosity (close to 1 for alginate gel) and Dh is, again, the hydraulic
diameter of the foulant cake. Comparison of Eqs. (16) and (17) demonstrates that the pressure drop through a fouled support layer in PRO mode may be greater than the pressure drop through the external foulant cake:
. (18) s,PRO s s c c
P
S
P
S
Modeling the hydraulic resistance of external and internal fouling is challenging because the hydraulic diameters of foulants (even model foulants like alginate) are not well-characterized. Furthermore, the FO membrane support layer geometry has not been extensively studied, and so it is not known how much of the support layer will become filled with foulants in PRO mode. Finally, the support layer tortuosity is not known for all FO membranes. For these reasons, it is difficult to evaluate Eqs. (17) and (18) and predict effects of fouling on the pressure drop through the support layer in PRO mode. The lack of internal fouling in FO mode greatly simplifies modeling of the effects of fouling on membrane performance. In this paper, the model will be evaluated assuming no foulant infill in the support layer (Φ = 0), even in PRO mode. Future research should be pursued to quantify the effects of internal fouling in PRO mode.
2.5. Determination of transport parameters
Diffusion coefficients, convective mass transfer coefficients, and membrane transport parameters are required to evaluate the layered transport model and predict the cake structural parameter from measured flux decline.
a) Boundary layer convective mass transfer coefficients. In the present analysis, the boundary layer mass transfer coefficients, k, were predicted as follows based on correlations specific to
1 According to the bundle-of-tubes approach to modeling flow through porous media, cake tortuosity belongs
in the numerator of Eq. (17) (see Ref. [34]). However, most organic foulants are highly hydrated, so cake tortuosity is approximated as 1 for simplicity.
the spacers and channel geometry used in the present experimental apparatus [14]. In cases where two fine spacers were stacked:
1 121 10 4 0 79 , (19) 0 239 . v k . x .
where v is the crossflow velocity in m/s. In cases where a single coarse spacer was used:
3 61 10 5 0 79. (20) 0 083 . v k . x .
b) Diffusion coefficients. The NaCl diffusion coefficient varies significantly between dilute and saturated solutions [24] This variation is accounted for by using representative values of diffusion coefficient on the low- and high-salinity sides of the active layer. Diffusion coefficients were based on the low- and high-salinity values used in Ref. [14]: Ds,FO = 1.367 ×
10-9 m2/s is used in the support layer in FO mode and D
c,FO = Ds,PRO = Dc,PRO = 1.294 × 10⁻⁹
m2/s is used in the cake layer in FO mode and both cake and support layers in PRO mode. c) Effect of dispersion on salt transport in the support layer. It has been previously reported that
diffusion in the support layer can be enhanced by flow, either normal [14] or parallel [25] to the membrane. According to Perkins and Johnson [26], the effective diffusion coefficient increases linearly with the convective velocity inside a porous medium (Eq. (21)). Depending on the average convective velocity and the particle diameter, the resulting effective diffusion coefficient, Ds,eff can be significantly higher than that without dispersion. Because internal
concentration polarization is so detrimental to flux in FO membranes, a dispersion-related increase in the diffusion coefficient can significantly improve membrane performance. Tow and Lienhard [14] suggest accounting for dispersion (convection-enhanced diffusion) in the support layer through an effective diffusion support layer coefficient that increases with flux:
. (21)
s,eff s w
D D J
The value of α in Eq. (21) was fitted from experimental data to be 1.65 × 10⁻⁴ m during the present FO-mode experiments. The best-fit nonnegative value for α in the present PRO experiments with unfouled membranes (see Sec. 4.1) was 0, and so dispersion is neglected when analyzing the PRO fouling data. Future research to quantify the impact of dispersion in FO membranes in both orientations has the potential to improve our understanding of transport in FO membranes and improve membrane performance by enhancing dispersion in the support layer.
d) Membrane transport properties. The water permeability, salt permeability, support layer structural parameter and support layer dispersivity (see Ref. [14]) are given in Table 1. FO-mode properties were measured in Ref. [14], while PRO-FO-mode properties were fit from foulant-free measured flux with the membranes in PRO mode (see Sec. 4.1).
FO fouling experiments were carried out in both FO and PRO modes to measure the effect of alginate fouling on membrane performance. Accumulated foulant was removed from the membranes after several trials to validate the method of predicting foulant accumulation from flux decline.
The experimental setup is described in detail in Refs. [14,27]. Draw and feed solutions were circulated by diaphragm pumps while water flux was calculated from the change in draw mass over 15-minute intervals. Feed and draw temperatures were maintained at 201 ℃ . Sodium chloride concentrations were measured using a Hach conductivity meter and calculated by interpolating data from Ref. [28]. All experiments were conducted with both feed and draw at atmospheric pressure.
Asymmetric cellulose triacetate FO membranes (Hydration Technology Innovation CTA-ES) were used. The draw channel was equipped with two mesh spacers (Sterlitech 17 mil diamond). The feed channel contained a coarser spacer (Sterlitech 31 mil diamond) in some experiments, where noted.
The feed solution contained 200 mg/L of sodium alginate and 1 mM of CaCl2, which causes alginate gelation near the membrane. The feed solution also contained varying concentrations of sodium chloride. Feed and draw concentrations are listed in Tables 1 and 2.
The mass of the gel layer was measured by scraping the gel off the membrane immediately after some of the experiments to enable model validation.
The cake structural parameter was calculated by fitting the predicted water flux2 to the measured water flux using the present model and a trial-and-error method written in Qbasic. The water flux was predicted by means of Eq. (15) with Eq. (6) for PRO and Eq. (10) for FO experiments. Solution osmotic pressure was calculated from NaCl concentration using the Pitzer model for electrolyte solutions (see, e.g., Refs. [29,30]). Tables 1 and 2 list the parameters used in evaluating the model.
4. Results and discussion
In this section, the model is validated with experimental data and then used to analyze experimental data in both FO and PRO modes. The model is then evaluated over a range of conditions to elucidate the effect of fouling on water transport through FO membranes and on energy generation with PRO.
4.1. Transport parameters of unfouled membranes
Transport parameters of unfouled membranes are needed to predict cake structural parameter from flux decline. Transport parameters for the HTI CTA membrane in FO mode are given in Ref. [14], but these were found to be inadequate to predict transport through the same unfouled membrane in PRO mode. Figure 3 shows the effect of feed and draw concentration on flux through the membrane in PRO mode, along with the predicted flux for the best fit of membrane transport parameters in PRO mode. Feed and draw cross-flow velocities were 8.3 cm/s and no feed spacer was used. Water and salt permeability as well as support layer structural parameter were chosen based on a best fit of the data in Fig. 3. These fitted parameters and those used in FO mode from Ref. [14] are given in Table 1 and are used in the predictions shown in Figs. 4-7. The data in Fig. 3 also demonstrate the strong influence of feed-side concentration polarization in PRO mode. Increasing feed salt concentration from 0% to just 1% decreases water flux by 40% due to concentration polarization in the feed boundary layer and support layer.
The difference between transport parameters fitted for the same membrane type in FO and PRO modes (Table 1) may be partially due to imprecision in the layered transport model for unfouled
membranes [13]. Although the model can be used to predict flux in both FO and PRO modes, the assumption of perfectly flat, homogeneous layers with particular transport mechanisms does not precisely reflect real salt and water transport. However, it is also possible that the difference in transport parameters between FO and RO modes may reflect real changes in the membrane. In particular, the substantial increase in salt permeability coefficient between FO and PRO modes may result from changes in the active layer when in contact with high-salinity solutions such as the NaCl draw used in this experiment. Changes in the HTI CTA FO membrane’s opacity when in contact with concentrated NaCl solutions have been reported previously [27], and physical changes that affect the polymer’s optical properties might also affect the membrane’s transport properties including solute rejection.
4.2. Comparison between predicted and measured cake structural parameter
The model described in Sec. 2 was previously validated for fouled membranes in FO mode by Tow and Lienhard [14], but has not previously been proposed or validated for fouled membranes in PRO mode. To validate the model in PRO mode, the cake structural parameter was predicted from measured flux decline using the present model and compared to the measured thickness of the foulant cake removed at the end of several fouling experiments. In this comparison, fouling was assumed not to affect transport inside the support layer, meaning either there was no internal fouling (Φ = 0) or the hydraulic diameter of the cake was large enough not to significantly raise the hydraulic resistance to water flow through the support layer. The density of the cake layer was assumed to be equal to that of an NaCl solution with the same concentration as the feed. The tortuosity and porosity in the cake were assumed to be 1.
The measured and predicted values of the cake structural parameter predicted are also listed in Table 2. The measured values of the fouling layer structural parameter were significantly lower (by 22–65%) than the predicted values. This discrepancy implies that treating fouling in PRO mode as a purely external cake is insufficient to quantify the relationship between foulant accumulation and flux decline in PRO mode. The additional cake layer thickness predicted by the model may represent additional hydraulic resistance to fluid flow in the support and/or cake layers, with the support layer cake hydraulic resistance likely to be more significant (see Eq. 18). The higher solute concentration in the support layer in PRO mode may even reduce the foulant pore diameter. Limited information is available regarding the hydraulic diameter of alginate gels (and other foulants) in various aqueous salt solutions (see Ref. [14]), so evaluation of Eq. 18 for the hydraulic pressure drop through the fouled support layer, and thus more accurate prediction of cake structural parameter from measured flux decline is challenging. Furthermore, the proposed model does not account for the possible changes in the membrane’s transport parameters and mechanisms due to fouling in PRO mode that are suggested by observed changes in membrane opacity [27]. Further research on structure and transport phenomena in both foulants and membranes are needed to accurately predict foulant accumulation from flux decline in PRO mode.
Nevertheless, the predicted cake structural parameter in PRO mode is comparable in magnitude to the measured cake thickness. Therefore, the proposed model will be used to qualitatively analyze flux decline results in terms of foulant accumulation in the following section.
flux decline in FO mode has already been analyzed in Ref. [14]. However, previously-published flux decline data collected using the same experimental apparatus is also analyzed where noted. Foulant accumulation is estimated using the model detailed in Sec. 2 based on parameter values (kd, kf, A, B,
Ds, Dc, Ss) given in Tables 1 and 2. The support layer structural parameter was fit for each experiment
from the initial flux before fouling began, and the cake structural parameter was calculated from the measured flux over time.
4.3.1. Comparison of fouling between FO and PRO
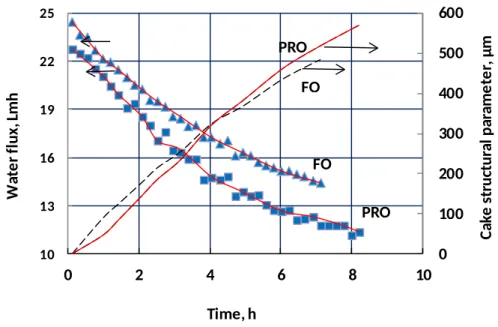
Experimental flux decline data in PRO and FO modes from Ref. [27] with the same operating conditions were compared to quantify effects of membrane orientation on foulant accumulation, as shown in Fig. 4. Figure 4 shows the measured flux and the calculated cake structural parameter as well as the fitted values of flux based on the calculated cake structural parameter. Although the initial flux is similar between the two membrane orientations and slightly lower in PRO mode, flux declines faster in PRO mode. Despite the difference in flux decline rate, the calculated cake structural parameter is almost identical between FO and PRO modes. This result suggests that the same foulant cake has a more significant effect on flux decline in PRO mode than FO mode. The lower time-averaged flux in PRO mode would be expected to lead to a lower cake structural parameter because less foulant is transported to the membrane by convection. However, the present model tends to overestimate the cake structural parameter in PRO (see Sec. 4.2), so the actual cake structural parameter is likely to be lower in PRO than in FO under these experimental conditions, despite the more significant flux decline in PRO.
4.3.2. Effects of feed concentration and cross-flow velocity in PRO mode
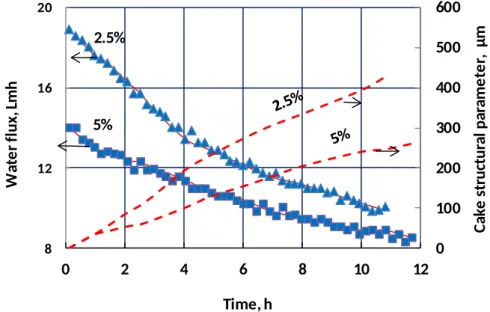
The effects of feed concentration and cross-flow velocity on flux decline and foulant accumulation in PRO mode are analyzed in this section. Figure 5 shows that increasing feed NaCl concentration from 2.5% to 5% leads to lower initial flux, slower flux decline, and a thinner foulant layer. Lower initial flux would be expected at higher feed concentrations due to the higher feed osmotic pressure, and a correspondingly thinner foulant layer would be expected as a result of reduced convection of foulants to the membrane.
Figure 6 compares fouling in PRO mode at cross-flow velocities of 4.2 and 8.3 cm/s, respectively. As would be expected, higher cross-flow velocity led to a reduction in flux decline. Although the initial flux was slightly higher in the lower-velocity trial, flux declined so much faster that the final flux at 11 h is lower than in the higher-velocity trial. Because the flux curves cross, the time-averaged flux is almost identical between the two trials in Fig. 6, indicating comparable total convection of foulants toward the membrane. Despite this, the calculated foulant accumulation was much lower in the higher-velocity trial. Alginate fouling in FO has previously been described with a deposition-minus-removal model [29] in which foulant accumulation depends on the difference between a convection term (which is proportional to flux) and a removal term. Even though the trials shown in Fig. 6 have approximately equal amounts of foulant convection toward the membrane, the rate of removal is clearly higher in the trial with higher cross-flow velocity, and thus the rate of foulant accumulation is lower with higher cross-flow velocity. The same is true for membranes in FO mode [14].
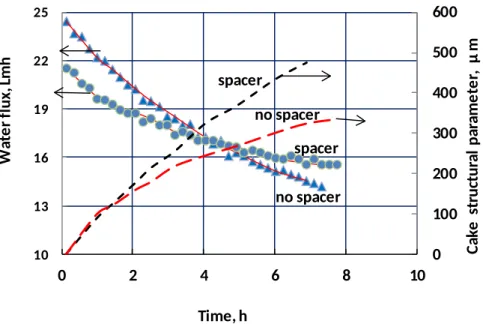
The use of feed spacers (Sterlitech’s 31 mil diamond, in this case) can significantly reduce flux decline and foulant accumulation rates. Figure 7 shows the measured water flux with and without a feed spacer (from Refs. [32] and [27], respectively) along with the growth of the fouling layer as predicted by the current model. As in Fig. 6, the flux decline curves cross, and the time-averaged flux is approximately equal between the two trials, indicating that the convection of foulants to the membrane was the same. However, the foulant accumulation (as cake structural parameter) was significantly (approximately 35%) lower with the feed spacer, which implies that the rate of foulant removal by diffusion and/or shear is increased by the presence of the feed spacer. Spacers not only reduce concentration polarization and maintain uniform channel thickness in spiral-wound modules, but can play a significant role in reducing the rate of foulant accumulation.
4.4 Model results: Effect of fouling on water flux
Foulant accumulation reduces flux in FO and PRO processes by raising the overall mass transfer resistance. In Fig. 8, water flux and the osmotic pressures on either side of the active layer are plotted as a function of the cake structural parameter for both water production (P = Pd - Pf = 0 bar)
and power generation3 (P = 100 bar) for membranes in PRO mode. Water flux decreases significantly due to fouling, dropping by approximately two-thirds as the cake structural parameter approaches 1000 μm.
As foulant accumulates, the increasing foulant layer mass transfer resistance causes the solute concentration and osmotic pressure at each interface to change. As shown in Fig. 8, m is higher and s is lower when P = 100 bar because the lower flux imposed by the hydraulic pressure difference reduces concentration polarization, bringing the osmotic pressures surrounding the active layer closer to those of the fed and draw. The osmotic pressures surrounding the active layer increase similarly as a function of the cake structural parameter regardless of the hydraulic pressure difference. Although fouling causes the osmotic pressure to increase on both sides on the active layer, the osmotic-minus-hydraulic pressure difference across the active layer decreases from 29 to 10 bar at P = 0 and from 18 to 5.6 bar at P = 100 bar as the cake structural parameter increases from 0 to 1000 μm.
4.5 Model results: Effect of fouling on PRO power density
The present model can also be applied to predict the effect of fouling on PRO energy generation. The upper limit on power density for a particular membrane and pair of solutions is the product of flux Jw (Eq. 15) and transmembrane pressure difference P, which assumes lossless pumps
and power generation equipment as well as infinitesimal water recovery. To calculate power density at finite water recovery, a one dimensional model of PRO such as the one developed in Ref. [33] would need to be employed. Maximum power density is identified by varying the hydraulic pressure difference in increments of 0.2 bar.
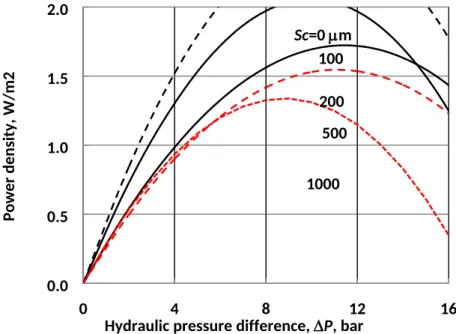
Foulant accumulation can significantly reduce the power density of PRO. Figure 9 shows how power density varies as a function of applied pressure and foulant cake structural parameter for PRO between seawater (modeled as 0.6 mol/L NaCl) and river water (0.015 mol/L NaCl). Power density reaches a maximum at a pressure on the order of half the draw solution osmotic pressure, but the exact pressure difference at which power density is maximized depends on concentration polarization in the boundary layers, support layer, and foulant cake, if present. Maximum power density decreases
considerably with increasing foulant thickness: the power density of a membrane with Sc = 500 m
(Emax = 1.03 W/m2) is 40% lower than that of an unfouled membrane (Emax = 1.72 W/m2). In our
experiments with high concentrations of alginate, the foulant layer reached Sc = 500 m in less than
eight hours; although most PRO feed solutions are not as fouling-prone as the synthetic solution used here, the significant effect of a 500 m foulant cake on PRO power production speaks to the importance of effective pretreatment and fouling mitigation in PRO. Figure 9 also shows that the optimal pressure difference decreases from about 12 bar for an unfouled membrane to 8 bar for a thick foulant cake of Sc = 1000 μm. As fouling occurs in real PRO systems, the decline in power production
can be reduced by varying pressure to optimize power production.
However, even with optimized operating pressure, maximum power density is significantly impacted by fouling. The maximum power density at optimal hydraulic pressure difference is plotted in Fig. 10 as a function of cake structural parameter for both seawater/river water and RO brine/river water pairs. The salt concentration of the simulated RO brine solution was twice that of seawater (1.2 mol/L); as in Fig. 9, seawater and river water were modeled as 0.6 mol/L and 0.015 mol/L NaCl, respectively. Figure 10 shows how the maximum power density decreases with increasing cake structural parameter. Even a 100 μm foulant cake (comparable to the thickness of a human hair) would have a significant effect on power density.
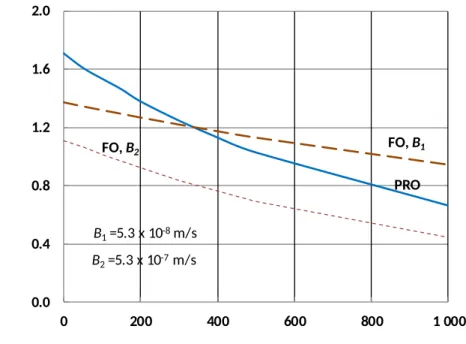
Because FO-mode operation is generally thought to be more fouling-resistant, we considered whether operating PRO with membranes in FO mode might lead to better performance when fouling is considered. Figure 11 shows the modeled maximum power density for the seawater/river water pair for membranes in FO and PRO mode using membrane parameters from Table 1. Although PRO mode has a higher flux for an unfouled membrane, the membrane in FO mode experiences less flux decline as the cake structural parameter increases. This predicted difference in response to fouling is primarily due to the much higher salt permeability of this membrane in PRO mode when used with nearly-saturated NaCl draw solutions (fit from experimental results as 5×10⁻⁷ m/s in PRO mode vs. approximately 5×10⁻⁸ m/s in FO mode). The higher salt permeability in PRO mode enhances concentration polarization in the cake layer; as a result, the flux decline due to the same cake layer is higher in PRO than in FO under the conditions modeled. To demonstrate the effect of salt permeability on the membrane’s response to fouling, Fig. 11 also includes a hypothetical FO-mode membrane with higher salt permeability (5.3×10⁻⁷ m/s). The highly salt-permeable membrane in FO mode exhibits similar flux decline in response to foulant accumulation as the membrane in PRO mode. For a membrane whose salt permeability is lower in FO mode, FO mode may offer better performance with highly fouling-prone feedwaters. Furthermore, these results demonstrate that salt permeability is an important consideration in PRO membranes due to the detrimental effect of salt permeation on fouling-related flux decline.
To increase the power density of PRO processes, draw solutions of high osmotic pressure are required. However, the detrimental effect of fouling on power density is often neglected. The maximum power density (at optimal pressure and infinitesimal water recovery) of a PRO process with the type of membrane used in this paper, with and without fouling, is plotted as a function of draw solution osmotic pressure in Fig. 14. Maximum power density increases nonlinearly with draw solution osmotic pressure because power density is the product of flux and optimal operating pressure, both of which increase with increasing draw solution osmotic pressure. Because foulant accumulation reduces both flux and optimal operating pressure (see Fig. 9), fouling can significantly reduce power density.
A layered transport model was developed to describe solute and water transfer rates through fouled membranes in FO and PRO modes using simple, closed-form equations. The model also predicts interfacial solute concentrations. These expressions enable the user to predict the performance of both PRO and FO processes in the presence of membrane fouling.
Evaluation of experimental flux data in PRO and FO modes showed the effects of membrane orientation, feed salinity, cross-flow velocity, and feed spacers on flux decline and foulant accumulation. The rate of foulant accumulation was similar in PRO and FO modes due to the equal convection of foulants to the membrane. Increasing cross-flow velocity and the use of feed spacers reduced foulant accumulation as well as flux decline.
Evaluation of the model demonstrated how foulant accumulation affects water flux in FO desalination. The model was also used to show how foulant accumulation affects power density in PRO used for energy production: a cake layer 500 μm thick reduces the maximum power density by 40%, and the optimal operating pressure changes as a result of fouling. Overall, fouling of FO and PRO membranes can significantly inhibit their ability to produce energy or water, and the model presented here enables better prediction of actual membrane performance under fouled conditions.
Acknowledgement
The Hungarian National Development Agency grant OTKA 116727 and GINOP-2.3.2-15-2016-00017 are gratefully acknowledged for the financial support.
Appendix A: Interface concentrations in PRO mode
The internal surface concentrations can be determined by means of Eqs. (2a) to (2e) and Eq. (4). Combining Eq. (2a) and Eq. (4), Cm can then be expressed as a function of the known feed and
draw concentrations: . (A.1)
1 1 1 1 1 1 1 Jw sS / D S / Ds c c / kf J / kw d J / kw d Jw sS / D S / Ds c c / kf d f w w m Jw sS / D S / Ds c c / kf J / kw d w B B C e e C e e J J C B e e J The equation for the limiting value of Cm as the salt permeability approaches zero is equivalent to that
without fouling: (A.2) 0 J / kw d m d B limC C e
The other concentrations can similarly be calculated:
, (A.3)
1 1 1 1 1 1 1 Jw sS / Ds S / Dc c / kf J / kw d J / kw d Jw sS / Ds S / Dc c / kf d f w w s Jw sS / Ds S / Dc c / kf J / kw d w B B C e e C e e J J C B e e J (A.4)
1
0 Jw / kf S / Dc c S / Ds s s f Blim C
C e
The remaining interface concentrations are:
(A.5)
1 1 1 1 1 1 Jw / kf S / Dc c J / k J S / D J / k Jw / kf S / Dc c w d w s s w d d f w w sp Jw sS / Ds S / Dc c / kf J / k w d w B B C e e C e e e J J C B e e J and . (A.6)
1
1 1 1 J / kw f J / kw d Jw cS / Dc S / Ds s J / kw d J / kw f d f w w c Jw sS / Ds S / Dc c / kf J / kw d w B B C e e C e e e J J C B e e J Appendix B: Interfacial concentrations in FO mode
Expressions for the interface concentrations in FO mode follow:
(B.1)
1 1 1 1 1 1 1 1 1 1 Jw / kf S / Dc c Jw / kd S / Ds s Jw / kd S / Ds s Jw cS / Dc / kf d f w w s Jw cS / Dc / kf Jw / kd S / Ds s w B B C e e C e e J J C B e e J The limiting value of Cs for zero salt permeation is:
(B.2)
1
0 Jw / kd S / Ds s s d BlimC
C e
The concentration on the feed side of the active layer can similarly be calculated:
, (B.3)
1 1 1 1 1 1 1 1 1 1 J / k S / D J / k S / D Jw / kd S / Ds s w f c c w f c c Jw / kd S / Ds s d f w w m Jw / kf S / Dc c Jw / kd S / Ds s w B B C e e C e e J J C B e e J The limit of 𝐶𝑚at zero salt permeation is:
(B.4)
1
0 Jw / kf S / Dc c m f BlimC
C e
(B.5)
1 1 1 1 1 1 1 J / k J / k Jw / kd S / Ds s w f J S / Dw c c Jw / kd S / Ds s w f d f w w c Jw / kf S / Dc c Jw / kd S / Ds s w B B C e e C e e e J J C B e e J and . (B.9)
1 1 1 1 1 1 1 1 1 Jw / kf S / Dc c J S / D J / k J / k Jw cS / Dc / kf w s s w d w d d f w w sp Jw cS / Dc / kf Jw / kd S / Ds s w B B C e e e C e e J J C B e e J References[1] N.Y. Yip, M. Elimelech, Performance limiting effects in power generation from salinity gradients by pressure retarded osmosis, Environ. Sci. Technol. 45 (2011) 10273–10282. doi:10.1021/es203197e.
[2] N.Y. Yip, A. Tiraferri, W.A. Phillip, J.D. Schiffman, L.A. Hoover, Y.C. Kim, M. Elimelech, Thin-film composite pressure retarded osmosis membranes for sustainable power generation from salinity gradients, Environ. Sci. Technol. 45 (2011) 4360–4369. doi:10.1021/es104325z. [3] C.F. Wan, T.-S. Chung, Osmotic power generation by pressure retarded osmosis using seawater
brine as the draw solution and watewater retentate as the feed, J. Membr. Sci. 479 (2015) 148-158. doi:10.1016/j.memsci.2014.12.036
[4] A. Altaee, A. Sharif, Pressure retarded osmosis: Advancement in the process applications for power generation and desalination, Desalination. 356 (2015) 31–46. doi:10.1016/j.desal.2014.09.028.
[5] T.Y. Cath, M. Elimelech, J.R. McCutcheon, R.L. McGinnis, A. Achilli, D. Anastasio, A.R. Brady, A.E. Childress, I. V. Farr, N.T. Hancock, J. Lampi, L.D. Nghiem, M. Xie, N.Y. Yip, Standard Methodology for Evaluating Membrane Performance in Osmotically Driven Membrane Processes, Desalination. 312 (2013) 31–38. doi:10.1016/j.desal.2012.07.005.
[6] A. Achilli, T.Y. Cath, A.E. Childress, Power generation with pressure retarded osmosis: An experimental and theoretical investigation, J. Memb. Sci. 343 (2009) 42–52. doi:10.1016/j.memsci.2009.07.006.
[7] S. Sarp, Z. Li, J. Saththasivam, Pressure Retarded Osmosis (PRO): Past experiences, current developments, and future prospects, Desalination. 389 (2016) 2–14. doi:10.1016/j.desal.2015.12.008.
[8] D.L. Shaffer, J.R. Werber, H. Jaramillo, S. Lin, M. Elimelech, Forward osmosis: Where are we now?, Desalination. 356 (2015) 271–284. doi:10.1016/j.desal.2014.10.031.
[9] T.S. Chung, S. Zhang, K.Y. Wang, J. Su, M.M. Ling, Forward osmosis processes: Yesterday, today and tomorrow, Desalination. 287 (2012) 78–81. doi:10.1016/j.desal.2010.12.019.
[10] A. Tiraferri, N.Y. Yip, W.A. Phillip, J.D. Schiffman, M. Elimelech, Relating performance of thin-film composite forward osmosis membranes to support layer formation and structure, J. Memb. Sci. 367 (2011) 340–352. doi:10.1016/j.memsci.2010.11.014.
[11]
H.W. Chung, L.D. Banchik, J. Swaminathan, and J.H. Lienhard, Economic framework
for net power density and levelized cost of electricity in pressure-retarded osmosis.
Desalination, submitted, 2018.
[13] E. Nagy, A general, resistance-in-series, salt- and water flux models for forward osmosis and pressure-retarded osmosis for energy generation, J. Memb. Sci. 460 (2014) 71–81. doi:10.1016/j.memsci.2014.02.021.
[14] E.W. Tow, J.H. Lienhard, Quantifying osmotic membrane fouling to enable comparisons
across diverse processes, J. Memb. Sci. 511 (2016) 92–107.
doi:10.1016/j.memsci.2016.03.040.
[15] P. Bacchin, D. Si-hassen, V. Starov, M.J. Clifton, P. Aimar, A unifying model for concentration polarization , gel-layer formation and particle deposition in cross- flow membrane filltration of colloidal suspensions, Chem. Eng. Sci. 57 (2002) 77–91. doi:http://dx.doi.org/10.1016/S0009-2509(01)00316-5.
[16] R. Field, Fundamentals of Fouling, in: K.-V.Peinemann, S. Pereira Nunes (Eds.), Membr. Water Treat., WILEY-VCH Verlag GmbH & Co., Weinheim, 2010: pp. 1–23. doi:10.1002/9783527631407.ch1.
[17] E.M.V. Hoek, M. Elimelech, Cake-Enhanced Concentration Polarization: A New Fouling Mechanism for Salt-Rejecting Membranes, Environ. Sci. Technol. 37 (2003) 5581–5588. doi:10.1021/es0262636.
[18] W.R. Bowen, F. Jenner, Theoretical descriptions of membrane filtration of colloids and fine particles: An assessment and review, Adv. Colloid Interface Sci. 56 (1995) 141–200. doi:10.1016/0001-8686(94)00232-2.
[19] Q. She, R. Wang, A.G. Fane, C.Y. Tang, Membrane fouling in osmotically driven membrane processes: A review, J. Memb. Sci. 499 (2016) 201–233. doi:10.1016/j.memsci.2015.10.040. [20] E.M.V. Hoek, J. Allred, T. Knoell, B.H. Jeong, Modeling the effects of fouling on full-scale
reverse osmosis processes, J. Memb. Sci. 314 (2008) 33–49.
doi:10.1016/j.memsci.2008.01.025.
[21] B.A. Qureshi, S.M. Zubair, A.K. Sheikh, A. Bhujle, S. Dubowsky, Design and performance evaluation of reverse osmosis desalination systems: An emphasis on fouling modeling, Appl. Therm. Eng. 60 (2013) 208–217. doi:10.1016/j.applthermaleng.2013.06.058.
[22] Q. She, L. Zhang, R. Wang, W.B. Krantz, A.G. Fane, Pressure-retarded osmosis with wastewater concentrate feed : Fouling process considerations, J. Memb. Sci. 542 (2017) 233– 244. doi:10.1016/j.memsci.2017.08.022.
[23] A.J. Karabelas, D.C. Sioutopoulos, New insights into organic gel fouling of reverse osmosis desalination membranes, Desalination. 368 (2015) 114–126. doi:10.1016/j.desal.2015.01.029. [24] V. Vitagliano, P.A. Lyons, Diffusion Coefficients for Aqueous Solutions of Sodium Chloride
and Barium Chloride, J. Am. Chem. Soc. 78 (1956) 1549–1552. doi:10.1021/ja01589a011. [25] N.N. Bui, J.T. Arena, J.R. McCutcheon, Proper accounting of mass transfer resistances in
forward osmosis: Improving the accuracy of model predictions of structural parameter, J. Memb. Sci. 492 (2015) 289–302. doi:10.1016/j.memsci.2015.02.001.
[26] T. Perkins, O. Johnson, A review of diffusion and dispersion in porous media, Soc. Pet. Eng. J. 3 (1963) 70–84.
[27] E.W. Tow, M.M. Rencken, J.H. Lienhard, In situ visualization of organic fouling and cleaning mechanisms in reverse osmosis and forward osmosis, Desalination. 399 (2016) 138–147. doi:10.1016/j.desal.2016.08.024.
[28] R. Robinson, R. Stokes, Electrolyte solutions, Second rev, Dover Publications, Incorporated, Mineola, NY, 2012.
[29] K.S. Pitzer, Thermodynamics of electrolytes. I. Theoretical basis and general equations, J. Phys. Chem. 77 (1973) 268–277. doi:10.1021/j100621a026.
[30] G.P. Thiel, J.H. Lienhard V, Treating produced water from hydraulic fracturing: Composition effects on scale formation and desalination system selection, Desalination. 346 (2014) 54–69. doi:10.1016/j.desal.2014.05.001.
[31] E.W. Tow, D.M. Warsinger, A.M. Trueworthy, J. Swaminathan, G.P. Thiel, S.M. Zubair, A.S. Myerson, J.H. Lienhard, Comparison of fouling propensity between reverse osmosis, forward osmosis, and membrane distillationn, J. Membr. Sci. 556 (2018) 352-364
[32] E.W. Tow, J.H. Lienhard, Unpacking compaction : Effect of hydraulic pressure on alginate fouling, 544 (2017) 221–233. doi:10.1016/j.memsci.2017.09.010.
Model of an Ideal Pressure Retarded Osmosis Membrane Mass Exchanger. J. Membr. Sci., 445 (2013) 211-21
9.
[34] Y. Roy, A. Benjamin, F. Feppon, E.W. Tow, J.H. Lienhard, A generalized model for forward osmosis, reverse osmosis, and nanofiltration, in preparation., (2018).
[35] E. Nagy, J. Dudás, I. Hegedüs, Improvement of the energy generation by pressure retarded osmosis, Energy. 116 (2016) 1323–1333. doi:10.1016/j.energy.2016.06.150.
Boundary layers Feed Cf Csp Cm m Draw Cd f d B Jw Cs sp Cc c Fouling layer Support layer Active layer Js Graphical abstract
Figures
a. b.
Figure 1. (a) Schematic diagram of a fouled FO membrane in PRO mode including layer and interface notation (adapted from [35]). (b) Schematic diagram of a fouled FO membrane in FO mode including layer and interface notation.
Figure 2. Graphical representation of layered transport model. FO and PRO mode models differ in the
Boundary layers Feed Js Cf Csp Cm m Draw Cd f d B Jw Cs sp Cp c Fouling layer Support layer Active layer Boundary layers Feed Cf Csp Cm m Draw Cd f d B Jw Cs sp c Support layer Active layer Fouling layer Js Cc