Effect of Helium Injection on Diffusion Dominated Air Ingress
Accidents in Pebble Bed Reactors
by
m
I
OF TECWNOLOGY
Joseph Paul Yurko
Submitted to the Department of Nuclear Engineering
In Partial fulfillment of the requirements for the degree of
LIBARIES
Master of Science in Nuclear Engineering
ARCHIVES
at the
MASSACHUSETTS INSTITUTE OF TECHNOLOGY
JUNE, 2010
Copyright 0 2010 Massachusetts Institute of Technology. All Rights Reserved.
A uthor...
..
...
epartment of Nuclear Engineering
May 14, 2010
Certified by...
.
.
Professor the Practice of Nuclear Engineering Andrew C. Kadak
Thesis Supervisor
Certified by...
.
...
Professor Emeritus of Nuclear V, nce and hngneing Michael J. Driscoll
Thesis Reader
A4
A ccepted by...
.
..
...
Professbr Jacquelyn C. Yanch
Chairman, Department Committee on Graduate Students
Effect of Helium Injection on Diffusion Dominated Air Ingress
Accidents in Pebble Bed Reactors
by
Joseph Paul Yurko
Submitted to the Department of Nuclear Engineering
In partial fulfillment of the requirements for the degree of
Master of Science in Nuclear Engineering
Abstract
The primary objective of this thesis was to validate the sustained counter air diffusion
(SCAD) method at preventing natural circulation onset in diffusion dominated air ingress
accidents. The analysis presented in this thesis starts with a vertically oriented rupture of
a coaxial pipe. Air enters into the reactor cavity at a rate dictated by diffusion, until the
buoyancy force is strong enough to initiate natural convective flow through the reactor.
The SCAD method, developed by Yan et al. reduces the buoyancy force in a high
temperature gas reactor (HTGR), during the lengthy diffusion phase, by injecting minute
amounts of helium into the top of the reactor to set up a counter helium-air diffusion
circuit. By delaying the onset of natural circulation, air enters the reactor only at
diffusion transport rates, instead of much higher natural convection transport rates. Thus,
the air ingress rate is reduced by several orders of magnitude. Without the continuous
convective driven supply of "fresh" air the threat of oxidizing graphite components is
significantly reduced.
To validate SCAD a small scale simulated Pebble Bed Reactor (PBR) was constructed
and a series of air ingress experiments with and without helium injection were conducted.
In addition, Computational Fluid Dynamic (CFD) simulations were performed using
FLUENT @ to model the experiment and gain further insight into the behavior of the
flow field leading up to the onset of natural circulation. In order to have the CFD
predicted natural circulation onset time better match the experimentally determined onset
time, the initial helium fraction in the numerical model had to be reduced by 15%. This
reduction is within the uncertainty of the experimental set-up.
This change helped display an important feature of the behavior of air ingress accidents.
With the initial helium fraction in the simulated reactor at 100% the first half of the
transient is a very slow completely diffusion dominated transport phase. The second half
of the transient had an air transport rate that had an increasing natural convective
transport contribution leading up to the onset of natural circulation and complete natural
convective transport. Reducing the initial helium fraction by only 15% caused that initial
very slow, pure diffusion transport phase to be bypassed and the natural circulation onset
time was dictated by the combined effects of free convection and diffusion transport, not
simply diffusion. A full scale PBR experiencing a similar accident will have the core
entirely filled with helium. Thus, for a vertically oriented double ended guillotine (DEG)
large-break loss of coolant accident (LB-LOCA) the subsequent air ingress rate will be
dictated by the slow diffusion of air into the reactor cavity, for most of the transient.
For the helium injection tests, even at the at the lowest tested injection rate, both the
experiment and the CFD simulation showed that natural circulation was prevented over a
time period twice as long as the time to onset. The tests showed that without helium
injection, natural circulation started after about 117 minutes on average. With helium
injection, natural circulation did not start after 240 minutes when the experiment was
terminated. Additional injection tests were run where after 240 minutes the helium
injection was terminated, but data continued to be taken. In these tests natural circulation
was initiated in approximately 120 minutes after termination of helium injection
confirming the helium injection flow was preventing natural circulation from starting.
The lowest tested helium injection rate corresponded to 0.01% of the test assembly's total
volume per minute, demonstrating how small of a flow rate is needed for the SCAD
method to work. Minimal helium injection is not intended to be an emergency core
cooling system but rather a system to prevent or delay natural circulation which would
result in a large amount of air ingress.
The system response was formulated non-dimensionally to quantify the impact SCAD
has on the driving parameters that impact the onset of natural circulation, namely the
buoyancy force, mass flow rate, and density ratio between the hot and cold leg. The
results showed that SCAD suppresses the buoyancy force and forces a mass flow
(transport) rate that causes any changes in the hot leg density to be counter-acted by
density changes in the cold leg. The transport rate that is established is orders of
magnitude less than the natural circulation transport rate. Using the driving
non-dimensional parameters, a methodology was also developed in order to formulate a
correlation to estimate the minimum injection rate (MIR) of helium to prevent the onset
of natural circulation. In order to properly derive a correlation for the MIR, further
experiments and/or simulations are required over different geometrical configurations.
The non-dimensional analysis showed that Yan's MIR estimate was conservative for the
experimental configuration, and would be conservative for a full scale PBR. Therefore,
Yan's MIR calculation was used to provide an order of magnitude estimate for the helium
injection rate in a full scale PBR. The resulting MIR of helium for a full scale PBR was
5.36
g/hr, which corresponds to storing only 11.6 kg of helium on-site to prevent the
onset of natural circulation for three full months.
The experiment and CFD simulations were performed using an inverted U-tube which
simulates a vertically oriented pipe configuration. If the pipe break occurs in a horizontal
configuration, the air ingress phenomena could be substantially different depending on
the break size and orientation. Thus, this thesis concludes that the method is capable of
preventing natural circulation onset as long as air ingress occurs at transport rates
comparable to diffusion after the break occurs.
Thesis supervisor: Andrew C. Kadak
Acknowledgements
I would like to thank my advisor Prof. Kadak for all his help and patience in completing
this work. There were many ups and downs as I learned how to operate FLUENT and I
want to thank Prof. Kadak for giving me the time to figure out the many issues I had.
I would also like to thank Dr. Xing Yan for his many contributions to this work. Dr. Yan
was instrumental in aiding my understanding of how to start this project and provided
great help through to its completion.
Many thanks to the Department of Aeronautics/Astronautics 16.62x staff: Prof. Ian
Waitz, Prof. Edward Greitzer, Prof. Sheila Widnall, Prof. Jennifer Craig, and especially
to the lab staff: Todd Billings, Dave Robertson, and Richard Perdichizzi. Without their
help the experimental apparatus would never have been finished. Thank you.
The experiment was a combined effort between me and my 16.62x lab partner Katy
Sorenson. Without Katy it never would have been finished. Thanks Katy for all your
help.
I would like to acknowledge Dr. Chang Oh of Idaho National Laboratory for providing
useful comments and input in understanding the full range of air ingress accident
scenarios.
I would also like to express my love and appreciation to my family, my Mom, Dad, and
two brothers for putting up with all of this and thank you all for your support as I
continue on.
Financial support for this research was provided by the Department of Nuclear Science
and Engineering, the Idaho National Laboratory, and the Nuclear Regulatory
Table of Contents
1. Background ...
7
1.1 Pebble Bed Reactor (PBR)...
7
1.2 Air Ingress A ccident Overview ...
...
10
2. N atural Circulation Prevention ... ...
... 11
2.1 Overview ...
11
2.2 Sustained Counter Air Diffusion (SCAD)...
12
3. Air Ingress Experim ent...
14
3.1 Experim ental Overview ...
14
3.2 Apparatus Description ...
14
3.3 Experim ental Procedure...
18
3.3.1 Experim ental Preparation.... ...
...
18
3.3.2 M easurem ent Description ...
18
3.4 Project Results ...
19
3.4.1 CFD Results...
19
3.4.2 Experim ental Data ... ...
...
.... 23
4. FLUEN T Analysis Discrepancy ...
...
...
27
5.
Contributions of Current Work...
27
6. Im provem ents to Previous CFD M odel...
... ...
28
6.1 Overview ...
28
6.2 Boundary Conditions ...
29
6.2.1 Porous M edia M odels ...
29
6.2.2 Heat Flux Boundary...
33
6.2.3 Accurate Temperature Profile...
35
6.3 Initial Conditions ...
36
6.3.1 Full Heating Phase Transient ...
36
6.3.2 Choice of Operating Density ...
...
42
6.3.3 Helium Concentration...
... 45
6.4 Justification for Change ...
48
7. Non-Dimensional Analysis ...
50
7.1 Form ulation...
50
7.2 Im portant Param eters ...
52
7.3 Case Com parison ...
54
8. Injection M odeling...
57
8.1 Injection Case CFD M odel ...
57
8.2 CFD Results ...
58
8.3 Non-Dim ensional Param eters Discussion...
...
62
9. M IR Evaluation M ethodology
...
66
10. Full Scale PBR Considerations...
...
68
10.1 MIR Order of Magnitude Estimate ...
68
10.2 Injection System ...
69
11. Conclusions...
71
12. Recom m endations for Future W ork...
72
14 . A pp en dices...
75
Al. Experimental Apparatus Design Procedure ...
75
A2. FLUENT Case Summaries...
77
A 3. 1-D D iffusion M atlab Script ...
288
A4. Pebble Wall Temperature UDF...
293
A 5. M IR M atlab Script ...
293
Table of Figures
Figure 1: Schematic of a Pebble Bed Reactor...8
Figure 2: Fuel Elem ents...
9
Figure 3: On-line Refueling Illustration...9
Figure 4: Phases of Air Ingress for Vertically Oriented Breaks...11
Figure 5: Full Apparatus...15
Figure 6: FLUENT Computational Mesh...20
Figure 7: Nitrogen Mole Fractions at Apparatus Boundaries...21
Figure 8: FLUENT Mass Flow Results...22
Figure 9: FLUENT Differential Pressure Results...
22
Figure 10: All Experimental Data...
...
... 25
Figure 11: Injection Trial Data....
.
...
...
...
... 26
Figure 12: Porous Media Investigation Helium Mole Fraction Comparison...33
Figure 13: Temperature Profile Comparison....
...
...
... 36
Figure 14: Heating Phase Transient Mesh...38
Figure 15: Pressure Contours at End of Heating Phase Transient...39
Figure 16: Cross-over Leg Circulation Loop...40
Figure 17: Temperature Contours at End of Heating Phase Transient...40
Figure 18: Pressure Profile Comparison Between Different Operating Densities...44
Figure 19: Operating Density Cross-Over Leg Helium Mole Fraction Compare... 45
Figure 20: 85% Helium Case Mass Flow Rate...47
Figure 21: 85% Helium Case Pebble Column Pressure Difference...47
Figure 22: Cross-Over Leg Helium Mole Fraction Comparison...
... 49
Figure 23: Non-Dimensional Mass Flux...54
Figure 24: Non-Dimensional Buoyancy Force...55
Figure 25: Density Ratio Comparison...
...
56
Figure 26: Injection Case Comparison...
...
59
Figure 27: 1 cc/min Injection Case Nitrogen Mole Fraction Contours...60
Figure 28: Stop Injection Mole Fraction Contours...
...
61
Figure 29: Non-Dimensional Buoyancy Force Comparison...
...
... 63
Figure 30: Density Ratio Comparison...64
Figure 31: Non-Dimensional Mass Flux Comparison...65
1. Background
1.1 Pebble Bed Reactor (PBR)
For the past thirty years, many in the world have viewed nuclear energy with skepticism
and fear. Safety concerns combined with high cost and large regulatory overhead caused
few new nuclear plants to be built. However, with the growing demand for more
environmentally-friendly energy, nuclear power is making a come-back. Though there
are other "clean" options, there are few choices for large scale constant sources of clean
energy other than nuclear power [1]. New light water reactor designs, including the
Westinghouse
AP1000
and GE's ESBWR, are safer and simpler, thus reducing
construction cost and increasing public confidence in the technology.
To further improve nuclear power plant safety and reduce cost, Generation IV plants are
currently being researched. One of the most advantageous designs is the Pebble Bed
Reactor (PBR) shown in Figure
11,
which is one type of high temperature gas-cooled
reactor (HTGR). The pebble bed reactor is a graphite moderated and reflected thermal
neutron spectrum reactor that uses helium as a coolant which operates at a low power
density but high outlet temperature. This higher outlet temperature allows for higher
thermal efficiency for use in either a direct or indirect gas turbine cycle or an indirect
steam cycle for electricity generation. The high outlet temperature compared to light
water reactors allows the PBR to be considered for process heat applications such as in
oil sands production, thermo-chemical hydrogen production or other uses where high
quality heat is needed.
'Figure 1 provides an illustration of a PBR plant layout. It does not represent pipe configurations used in the scaled down experiment discussed later.
REACTOR
RECUPERATOR
COMPRESSOR
TURBINE
GENERATOR
GEARBOX
CCS & CBCS
SYSTEMS
;r
W
PRE-COOLER
MAINTENANCE
SHUT-OFF DISC
INTER-COOLER
OIL LUBE SYSTEM
Figure 1: Schematic of a Pebble Bed Reactor [2]
The most important advantage of this technology is a further improvement in safety and
an increase in cost effectiveness of the plant due to simplicity in design and higher
thermal efficiency. In a PBR, uranium fuel micro-spheres are held in billiard ball sized
graphite spheres as shown in Figure 2. This design lowers the power density to the point
that a PBR is naturally safe; that is, the core cannot physically meltdown, thus alleviating
the greatest public fear of nuclear power. PBRs are more cost-effective because they are
not expected to go through costly shut down periods for refueling. Shut downs are
avoided by using a process known as on-line refueling. During normal operation, the
pebbles cycle through the core. When a pebble's useful operating life is exhausted, it is
removed and a new pebble is added during operation. Figure 3 depicts an illustration of
the on-line refueling process. Finally, because PBR plant designs are small, smaller units
requiring less investment and shorter construction time allow power plants to be
&' r
I -,F
EM1SahmE
caed patda Snbedd0ed in Graph* Mat sk .W0 clrif S4
m
ml PrlIw PtC~t"Ua1ecti
r- Fb 92mCostadfortha
Da C S tkanftw1 Dao'de FEl0Figure 2: Fuel Elements [2]
fpbt pebbLki
Figure 3: Online Refueling Illustration [31
The economic case for pebble bed reactors is based on its modular design and
construction allowing for factory fabrication of modules with on-site "assembly". The
economics of production of a large number of standard smaller units is expected to
compete with the overall cost of large base load plants on a cost per kilowatt hour basis.
1.2 Air Ingress Accident Overview
Before the Nuclear Regulatory Commission (NRC) approves a new reactor design, the
safety of the plant must be established, which includes performing transient and accident
analyses of postulated design basis accidents. One of these more significant design basis
events is the rupture of a main coolant pipe and subsequent air ingress. The air ingress
transport rate is dependent on the orientation of the break. Vertically oriented pipe
breaks, as will be discussed, consist of cold air sitting underneath hotter helium gas.
Therefore, the air ingress rate is dictated by diffusion. A horizontal break in a large
diameter pipe, however, will have additional convective transport due to density
gradients that reduce the natural circulation onset time compared to diffusion driven
accidents
2. This work does not account for any phenomena specific to horizontal flow
stratified flow.
Because the SCAD method applies to diffusion driven transport rates, only vertical pipe
breaks will be discussed. Diffusion dominated air ingress accidents consist of three
phases as shown in Figure 4. The furthest left most illustration in Figure 4 is the first
phase, the depressurization stage from approximately 7 MPa in a relativity short time
depending on the size of the breach. Here, the helium coolant is forced through the pipe
breach, meaning no air can enter the reactor vessel. When the pressure in the reactor core
equilibrates with the ambient environment in the reactor cavity or building, the second
stage, the diffusion stage, begins. Air enters the reactor through a slow diffusion process.
As more air enters the reactor, the buoyancy force increases due to the temperature
difference in the hot core and the cold leg (side of the reflector), and eventually the
buoyancy force becomes larger than the viscous drag, inducing natural circulation. This
last stage is shown in the right most illustration in Figure 4. Air enters the reactor
through the breach, gets heated up in the core, cools down in the cold leg, and then exits
through the breach.
2 Oh, Chang, "Current INL R&D Activities on VHTR Air-Ingress Accident Analysis," Presented at the
AirAi
A+ Hie
{Diffuktion)
Deprcssunzation stage Diffusion stage Natural convcction stage
Figure 4: Phases of Air Ingress for Vertically Oriented Breaks [2]
Though the passive safety features inherent to the PBR design ensure that the ultimate
reactor temperature rise for such an event is less than the design limit of the silicon
carbide coated particles, concern still exists regarding exposure of the graphite pebble
and reflector to ambient air which might cause corrosion and possible exothermic
reactions heating up the core further. This is a problem because both the outer zone of
the pebbles and the lower and side reflectors of the core structure are made out of
graphite. Ingress of air will cause the graphite to oxidize, compromising the structural
integrity of the lower graphite structure and possibly reaching the fuel pebbles. The
natural circulation phase of the air ingress accident provides a continuous supply of
"fresh air" to oxidize the graphite components. Natural circulation, therefore, presents
the greatest threat to core integrity and must be prevented.
2. Natural Circulation Prevention
2.1 Overview
To maintain the design safety goals of the PBR, air ingress accidents must be prevented
or sufficiently low in probability to make them very unlikely events and/or a means to
mitigate the consequences of air ingress or to prevent the onset of natural circulation
through-flow of air must be developed. Most air ingress analyses indicate that air ingress
events proceed on a long time scale after depressurization due to the diffusion process.
This allows time for repair of the leak or broken pipe since the activity of the helium
coolant is generally very low. Additionally, these analyses assume that the source of the
air in the reactor cavity is consumed such that the oxidation reaction is limited and
confined to only a small portion of the lower reflector, preventing any damage to the fuel
or structural integrity of the lower reflector supporting the pebble bed. Whether these
assumptions are correct will be evaluated during the licensing process based on the
evidence provided.
The simplest approach to prevent air from entering would be the addition of a helium (or
other gas such as nitrogen) injection system upon a break of the primary system
boundary. Pressure driven forced convective flow through the reactor will thus prevent
air from entering into the core [4]. However, to maintain this condition over long periods
of time, for example several months, would require large amounts of helium stored
onsite. From an economics point of view, storing large amounts of extra helium (or
nitrogen) would add additional complexity to the plant, increasing the initial cost and so
this simple approach could become very costly for large reactor sizes and the longer the
time of interest becomes. Goals for an air ingress prevention method are thus to not only
prevent the onset of natural circulation but also at minimal additional cost and so
different prevention approaches must be taken.
2.2 Sustained Counter Air Diffusion (SCAD)
In order to meet the stated prevention method goals, Yan et al.
[5]
proposed injecting
minute amounts of helium gas from the top of the reactor in order to produce sustained
counter air diffusion (SCAD). This process counteracts the increasing buoyancy force,
effectively halting the development of natural circulation. A steady-state counter
air-helium diffusion process is created in SCAD that attempts to effectively have no bulk gas
flow through the core. Air is therefore only allowed to enter the reactor through
diffusion, which presents negligible risk to core integrity. In their work, an analytical
minimum injection rate (MIR) of helium was developed and used in a benchmarked code
using data taken from a test facility simulating an air ingress event. Yan et al. then used
CFD analysis on a full scale high temperature gas reactor to test their MIR strategy. A
two-dimensional axi-symmetric mesh of a 600MWt HTGR was created and an air ingress
accident was simulated using FLUENT. Without helium injection the air ingress rate into
the reactor was 320 kg/hr. This could be reduced to 1 kg/hr by injecting 0.14 kg/hr of
helium. Thus, their numerical results showed that by storing only 300 kg of helium, the
air ingress into the reactor could be controlled for three full months.
The MIR equation is derived assuming the bulk flow in the hot leg is effectively zero and
that the entering air molar flux then exits out the cold leg. The analytical estimate for
MIR as derived by Yan is given by Equation 1.
NHe,h ( L
L h (XHh He h)
LX
N
He,c =cCD cnI-N*Xe,
N
1-
N*X
eC
N* =1+
NHe,hS
N
He~cEquation 1
where: c
molar concentration [mol/m
3],
D binary mixture mass diffusivity [m
2/s],
L
channel length [in],
N
molar flux [molI/m
2-s],
S* = total flow area ratio of cold to heated channels,
X
molar fraction with superscripts,
Superscripts:
o
top of a particular channel,
L bottom of a particular channel,
Subscripts:
He helium,
c
Ecold channel,
Equation 1 must be solved iteratively using the Newton method to determine the
individual channel helium molar fluxes for given boundary conditions. The MIR is then
the sum of the hot and cold leg helium molar fluxes calculated from Equation 1. It
should be noted that the MIR equation was derived assuming steady-state and thus
predicts the required helium injection rate to ensure the chosen channel boundary mole
fractions are maintained (channel boundary mole fractions refer to the mole fractions at
the top and bottom of the hot and cold legs). Therefore, the channel boundary mole
fractions just before the onset of natural circulation, as computed from CFD analysis or
known from experiments, should be chosen to calculate the MIR for a given
configuration.
3. Air Ingress Experiment
3.1 Experimental Overview
To provide a test of the SCAD concept, an experiment was constructed to simulate the
onset of air ingress in hot and cold leg system representing a pebble bed core. The
objective of the experiment was to numerically predict the onset of natural circulation in
a pebble bed configuration using CFD, design an experiment that was appropriately
scaled, build the experimental apparatus and then test for onset of natural circulation
consistency with numerical predictions. Finally, the configuration was used to test the
principle of Sustained Counter Air Diffusion and whether minimal injection of helium
did prevent the onset of natural circulation such that it could be used to prevent the
phenomenon in real reactors.
3.2 Apparatus Description
The test apparatus was an inverted U-tube with one leg heated with a pebble region and
the other cooled, sitting atop a 55-gallon drum. The test apparatus was designed to be a
scaled down version of the German NACOK test facility. A detailed description of the
apparatus design process is given in Appendix Al. The inverted U-tube configuration
was chosen to be consistent with previous air ingress experiments in Japan summarized
in Ref. [2] and Ref.
[7].
The valves connecting the U-tube to the barrel simulate the
rupture of a co-axial pipe with the pipe break directly beneath the core. Figure
5
gives a
schematic of the test apparatus giving dimensions and showing the locations of the
pebble column, thermocouples, and pitot tubes. The U-tube is connected to the barrel by
large valves that are labeled as "big valves". The valves labeled "small valves" are where
the helium was injected in order to fill the U-tube with helium.
44 in
10-C
6 in.200 C
MIR Injecion Pin Coper tilbe o fon 2 4 He Tank Pitot Copper COOlantt 48 375Min Coppe: PNot
luibelo
P11e1O P4I1 4 iSmall ValVe SmallVlve11
Big BI
Valve
ILmn
-~T
C
Bamer 22 In
Thermocouples were used to monitor the temperatures of each leg, and Pitot tubes were
inserted above and below the pebble region to measure the pressure difference across the
pebbles. Helium was injected into the middle of the top horizontal cross-over leg, at the
injection location shown in Figure 5.
The apparatus was made primarily of copper pipes with an inner diameter of 2.50 in. The
hot and cold legs were connected to the horizontal crossover leg with copper elbows, and
to the barrel with 2.5 in. full port valves. Opening the full port valves simulated the pipe
break, and they will be referred to as the big valves. The purpose of the 55-gallon barrel
was to prevent disturbances in the lab from affecting the pressure sensor readings.
Electrical metal tubing (EMT) was bent and screwed to the top of the barrel to support
the u-tube. A barrier was screwed and sealed to the inside of the top of the barrel to
prevent helium from exiting the cold leg and traveling directly back to the hot leg.
Pure-type soda lime glass pebbles with a diameter of 1.2 cm were placed into the hot leg
to represent fuel pebbles. The total pebble region was one meter tall and broken up into
three equal parts for temperature monitoring purposes. As seen in Figure 5,
thermocouples were placed before and after each pebble section at positions 1-4. Each
section was supported with a piece of brass that had been water-jetted into a mesh to
reduce its resistance. There were approximately 678 pebbles in each section, giving a
porosity of 0.418. Due to jostling during the soldering process, the exact packing
structure of a PBR could not be recreated; however this is close to the projected porosity
in PBRs of 0.395.
The hot leg was heated with three silicone rubber fiberglass insulated flexible heaters,
which were wrapped around the pebble sections and secured with metal hose clamps.
These three heaters were plugged into a Variac voltage controller, which was adjusted
throughout each trial to maintain the desired temperature of 200'C. Copper tubing with a
diameter of 0.25 in. was coiled around the outside of the cold leg and fastened with metal
hose clamps. Water was pumped through a Neslab FTC-350a refrigerator and into the
copper tubing to cool the leg to 10 C. Thermocouples were placed at positions 5 and 6 in
Figure 5 to monitor cold leg temperatures. All thermocouples were inserted such that
their sensing tips were in the center of the pipe. The entire u-tube was insulated with
several layers of crinkled aluminum foil. There were enough layers that the hot leg could
be touched without gloves; the rest of the apparatus was wrapped similarly.
Because of the low flow rate even after circulation starts, a flow meter would have been
unreasonable to identify the start of circulation. The flow meters had 0.25 inch openings
in the copper tubes which were
2.5
in. in diameter. This small opening would cause
significant resistance and likely prevent circulation from ever starting due to the
resistance offered. To be able to determine the time for onset of natural circulation, a
different indicator was needed. As will be discussed later, CFD results showed the mass
flow spike indicating the onset of circulation corresponds to a measurable change in
pressure across the pebble region. Thus, Pitot tubes were screwed into the apparatus
above and below the pebble region (at positions 1 and 4 in Figure
5)
to monitor the
pressure difference over this distance. An MKS Instruments, Inc. Baratron was used to
sense the pressure and attached to a digital readout. The thermocouple positions were
located above and below each heater, and at the top and bottom of the cold leg. High
temperature room-temperature vulcanization (RTV) adhesive sealant held the
thermocouples in place and sealed the holes. HP Benchlink Datalogger displayed the
temperatures from the thermocouples.
The helium supply tank was attached to the apparatus with plastic tubing, and each end of
the tube was fastened with a hose clamp. The tube was attached to a small valve to flush
and fill the apparatus. The line also included a flow meter at the top of the apparatus
during injection. The regulator kept the flow at a pressure of one atmosphere during the
filling stage, and was varied according to injection rate during the injection stage.
3.3
Experimental Procedure
3.3.1 Experimental Preparation
To begin each trial, the u-tube was sealed from the outside environment and the walls
were heated or cooled as necessary to the desired temperatures. The apparatus was then
flushed with helium so that the tank pressure dropped by 200 psi which corresponds to
approximately 0.101 kg of helium, or 67 times the mass that would fill the volume of the
apparatus at standard temperature and pressure. (In one trial, the apparatus was flushed
with 500 psi with similar results.) Because the primary goal of the experiment was to
evaluate SCAD, the depressurization phase of the air ingress accident was neglected.
Thus, the start of the experiment corresponded to the end of the blowdown phase when
the pressure in the reactor equilibrates with containment. The hot and cold legs were
heated to near 2000 C and 100 C, respectively, and the helium was heated and cooled to
these temperatures. At time zero, both the hot and cold leg big valves were open
simultaneously allowing air from the 55 gallon drum to flow in. During injection runs,
the helium injection started at the same time as the big valves on the end of either leg
were opened.
3.3.2 Measurement Description
The appropriate hot and cold leg temperatures were maintained by controlling the power
to the heaters and cooler by monitoring the thermocouple data. When the temperature
readings would begin to become too high or low, the power to the heater and cooler were
adjusted accordingly.
As described previously, the pressure difference across the pebble column was used to
monitor the onset of natural circulation. Thus, the differential pressure across the pebble
column was monitored and recorded every several minutes and then at faster intervals
when the pressure difference was changing relatively quickly. The Baratron pressure
value was zeroed to the "cold" air hydrostatic head before the experimental preparation
began. When the differential pressure value became negative, a frictional pressure drop
was being experienced by the fluid as it flowed upward through the pebble column.
Thus, natural circulation was considered to start when the differential pressure reading
became negative.
3.4 Project Results
3.4.1 CFD Results
FLUENT®, commercial CFD software, was used to simulate our setup to ensure that air
circulation would start within several hours. A 3-D model was created and is shown in
Figure 6. The three separate pebble sections are represented as one continuous pebble
column equal to 39 in. in height. The pebble column walls and the walls of the upper
heated section of the hot leg were held at 200'C while the cold tube walls were set to
10 C. The walls of the cross-over leg and both big valves were set as adiabatic. The
barrel walls were set at 20'C. Appendix A2 provides a summary of the solver settings
used in this model (referred to as the original model).
Nitrogen gas was used in place of air in the model to reduce computational complexity.
The pebble column was modeled using the FLUENT porous media option. Initially, the
upside U-tube was filled with helium at 1 atm and the barrel was filled with nitrogen at 1
atm. The initial temperature in each of the zones were 200'C in the upper heated region
and pebble column,
50'C
in the cross-over leg, 1 0
0C in the cold tube, and 20'C in both
Cross-Over
Leg
Heated Upper
Portion
Cold Leg
Hot Leg
Cold
Heated
Tube
Pebble
Tube
Column
Hot Leg Big
Cold Leg Big
VaLe B
Valve
Barrel
Figure 6: FLUENT Computational Mesh
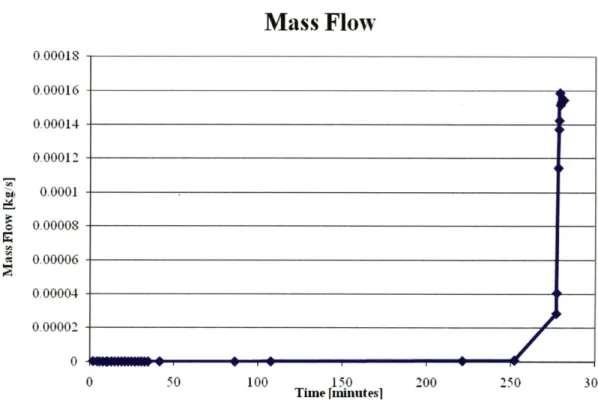
The FLUENT results are shown in Figures 7 to 9. Figure 7 depicts the nitrogen mole
fractions at four different locations in the apparatus: the entrance and exit of the pebble
column and the entrance and exit of the cold tube in Figure 6. Figure 8 shows the mass
flow rate versus time and Figure 9 gives the pressure difference across the pebbles over
time. Natural circulation starts at approximately 280 minutes as indicated by the mass
flow spike at that time. The mass flow spike corresponds to the time when the apparatus
becomes completely filled with nitrogen, as shown by Figure 7. The pressure difference
across the pebble bed was positive, meaning that is the pressure was greater above the
pebbles than below during the diffusion phase. At the onset of natural circulation, the
pressure difference becomes negative because of the flow through the pebble bed.
... ...
N2 Mole Fractions
-- 9- N2! mo0fraction
at cold
leg
fraction
at cold
leg exit
-N2
iol
fraction
at pebble
entiance
0 50 100 150 200Tine [minutesl
Figure 7: Nitrogen mole fractions at apparatus boundaries
1.OOE+00 9.OOE-01 8.OOE-01 7.OOE-01 6.OOE-01 5.0E -01 4.OOE-01
3.OOE-01
2.OOE-01 L.OOE-01 O.OOE+00 250 300 ... .... ... nm WON"Mass Flow
0.00018 0.00016 0.00014 0.00012 0.0001 0.00008 0.00006 0.00004 0.00002 - 0-0 50 100 150 200 250Time [minut esl
Figure 8: FLUENT results showing mass flow leading up to and at onset of natural
circulation
A Pressure Across Pebbles
Time [minutesl
Figure 9: FLUENT results showing change in pressure across pebble region leading
up and at onset of natural circulation
3.4.2 Experimental Data
3.4.2.1 Air Only Trials
In order to better appreciate the natural circulation process in this apparatus, several trials
were performed. The first trials consisted of heating the air inside the apparatus on the
hot leg and cooling the cold leg. Upon opening the two big valves, the pressure across
the pebbles immediately dropped, indicating natural convection flow through the pebble
column. Once the valves were closed, the differential pressure quickly returned to its
original value. Opening any other combination of valves on the apparatus did not cause
the same immediate change in the differential pressure reading. The different valve
combinations remained open for several minutes and no indication of flow was seen from
the pressure reading. The various valve combinations were as follows: opening the hot
big valve and cold small valve, the cold big valve and hot small valve, both small valves,
and only one big valve. With the two big valves opened natural circulation was indicated
almost immediately, whereas none of the other combinations had the immediate natural
circulation onset after the different valves were opened. This suggests that there is a
correlation between break size and natural circulation onset time. Opening the big
valves, immediately establishes a flow path for the hot air to rise, and then fall as the air
is cooled in the cold leg. Even though a flow path existed with the small valves open, it
was not sufficient to provide a circulation path immediately for the air and thus no flow
resulted.
The air-only trials confirmed the use of monitoring the pressure difference across the
pebble column as an indicator for the onset of natural circulation. During the heating
phase transient, a pressure "bubble" would be created above the pebble column to
counteract the buoyancy force to prevent flow, since no flow path existed. When both
big valves were opened, the buoyancy force would overcome this pressure "bubble"
because of the existence of an open flow path. The pressure difference across the pebbles
would almost immediately become negative indicating flow upward through them. Any
other combination of opened valves did not show the pressure difference becoming
negative, it would remain positive, meaning the pressure "bubble" was in place, and
preventing the onset of natural circulation.
3.4.2.2 Non-Injection and Injection Trials
A series of experiments were conducted to gain enough data to support findings on the air
ingress phenomena. The first series of tests were aimed at developing a consistent data
set on air ingress without helium injection. Five tests were conducted without helium
injection which showed consistent behavior in terms of the onset of natural circulation.
This was followed by a series of tests in which helium injection of various rates was
tested to determine whether it prevented the onset of natural circulation. The last series
of injection tests was aimed at establishing a minimum injection rate within the limits of
the measuring device. In all 11 tests were run
-
6 non-injection and
5
injection.
Figure 10 is a plot of all data taken during the experiment of non-injection and injection
trials. Note that the AP in Figure 10 is a "zeroed" differential pressure, meaning a value
of zero corresponds to the room temperature air hydrostatic head before the start of the
experiment. Thus a negative value means a pressure difference across the pebble column
greater than the room temperature air hydrostatic head. The absolute pressure difference
is then approximately 15 Pa less than the Figure 10 reported value. The important point
of Figure 10 is that the differential pressure behavior indicative of natural circulation
onset (the AP drop) only occurred in non-injection cases. All injection cases did not
show that same AP drop behavior, therefore natural circulation never started in any of the
injection cases.
The average natural circulation onset time for the non-injection trails was 117 minutes
with a standard error of 7 minutes. Injection trials were run for at least 240 minutes,
approximately twice the length of time that non-injection runs were run. One lasted for
480 minutes. Natural circulation did not start at any injection rate at or above 1 cc/min,
the minimum rate we could measure.
35
Differential Pressure Data vs. Time
30....-A
25
AMInjectionTrials
20
15
10Non-Injection Trials
0
-5
(
0
Time [min]
Figure 10: Results of all injection and non-injection trials. Red triangles show the
end of the trial in injection runs
In two of the injection runs, data was taken after the injection was turned off. Though the
pressure began to drop at different times, the onset time for both was about 120 minutes
after injection was turned off as shown in Figure 11. This clearly shows the effectiveness
of minimum helium injection as a means to avoid massive air ingress by eliminating or at
least significantly delaying natural circulation.
A Pressure Across Pebbles For Injection Trials
3D30
25
20
.-.
h15010
5
0
-5
Time [minutes]
Figure 11: Time until onset in injection trials after injection has been stopped
3.4.2.3 Post-Leak Fixes
After construction on the apparatus was completed, a leak test was performed on the
u-tube. No leaks were found in the simple leak test. After multiple trials a second leak test
was performed and a leak was found at one of the thermocouple locations. The
thermocouples were only sealed by RTV and it is possible that during the filling process
the high velocity helium could have dislodged a proper seal. The leak was fixed and
several more non-injection cases and an injection case at 2 cc/min were performed. The
subsequent non-injection cases had the longest onset times at approximately 140 minutes
each. But, one of the trials showed the pressure difference begin decreasing at a similar
time as the previous cases, but showed natural circulation onset about the same time as
the other post leak fix case. Thus, the case seems to have enveloped the entire spectrum
of conditions in the pre and post leak fix cases. Since the onset time difference was only
an additional 20 minutes, it was felt then that the leak had a small impact on the results.
The 2 cc/min case performed after the leak was sealed was run for about 4 times as long
as the average onset time (approximately 480 minutes) and natural circulation was never
developed.
-*-14 cc/min Injecton
-e-7 cc/min Injection
-
2 cc/min Injection
- --_ 1
cc/min Injection
-5-2 cc/min Injection, leak
sealed
100
200
300
400
50
4. FLUENT Analysis Discrepancy
Although the experimental data suggests that SCAD does indeed prevent the onset of
natural circulation, the FLUENT results over-predicted the natural circulation onset time
by over a factor of 2. This point is illustrated by comparing the experimental data, Figure
10, to the FLUENT differential pressure results of Figure 11. The average onset time for
the experimental data was about 120 minutes, while the numerical model predicted onset
at around 280 minutes. It is important to reconcile the differences in the FLUENT model
to allow the CFD results to better reflect the experimental data for a deeper understanding
of important phenomenon. The original FLUENT model was created before the
experiment was conducted in order to give an estimate for how long the experiment
would last. Because of this, the boundary and initial conditions were very simple and
ultimately did not accurately reflect those of the experiment. Determining the conditions
that were not properly represented will therefore provide further insight into the causes
and important parameters that impact the onset of natural circulation. Once the
computational model discrepancies are resolved, the evaluation of the validity of SCAD
can be more thoroughly examined.
5. Contributions of Current Work
Understanding how to model the development of transient natural convection in a
postulated HTGR air ingress accident scenario is important. The flow is dictated by the
competing buoyancy effects of thermal and concentration gradients. In general, such
flows are classified double-diffusive convective flows with combined heat and mass
transfer, and thus this research provided insight into proper modeling techniques for this
class of flows in commercial CFD software, specifically FLUENT. The impact of
various solver settings, controls, initial, and boundary conditions on the flow field
behavior and natural circulation onset were evaluated. The most appropriate settings
were therefore determined for this class of flows.
The investigation process into improving the computational model also provided further
insight into the mechanisms that affect the onset of natural circulation. The important
driving parameters were then quantified in terms of non-dimensional numbers that
provided relative strengths between different cases. Looking at the flow field
non-dimensionally, provided insight into why the original FLUENT model over predicted the
onset time.
The current work also provided further insight into SCAD for a PBR. The effectiveness
of SCAD on preventing/delaying natural circulation onset was investigated and compared
in non-dimensional terms to provide insight for a full scale PBR case. A methodology
was formulated in order to determine an empirical correlation for the minimum injection
rate required to prevent the onset of natural circulation. That methodology will be
described.
6. Improvements to Previous CFD Model
6.1 Overview
The following discussion describes in detail the various attempts made in trying to
improve the computational model to better reflect the experimental data. The different
attempts can be broken into two basic classes, boundary conditions and initial condition
changes. Boundary condition changes attempted to better reflect the experimental
boundary conditions that were not represented by the initial very simple computational
model. The boundary condition investigation examined the impact of the porous media
model in FLUENT as well as the use of heat flux wall conditions and more accurate
temperature wall profile compared to simple constant wall temperature conditions.
Investigating improved initial conditions was an attempt to accurately account for the
heating phase that occurred before opening of the big valves to start the experiment. A
full heating phase transient was simulated in the u-tube and used then used as the initial
conditions for a full transient simulation. The heating phase transient allowed the initial
conditions to capture detailed local circulation loops and non-uniform pressure fields that
were not accounted for in the original initial conditions. The initial helium fraction in the
u-tube was also varied to account for the uncertainty in that there was no way to monitor
the helium concentration in the u-tube in the experiment.
The investigation concluded that of the various changes examined only the initial u-tube
helium fraction had significant impact on the natural circulation onset time. As will be
discussed later, any changes to the original model improved the results only up to the
point of more closely following the diffusive transport rate in the hot leg and could not
decrease the natural circulation onset time by more than 40 to 50 minutes (so onset
occurred around 230 minutes rather than 280 minutes). However, lowering the initial
helium fraction only 15% in the u-tube decreased the onset time from approximately 280
minutes to about 126 minutes. Because the initial helium fraction in the u-tube was
unknown and was not able to be measured given the budgetary constraints on the
experiment, it is felt that these results show that the U tube did not contain 100% helium
at the start of the tests. The implications of such initial conditions will be discussed later.
Described below are the individual studies that led to the conclusions cited above.
6.2 Boundary Conditions
6.2.1 Porous Media Models
In FLUENT, it would be computationally unreasonable to model the pebble column as an
explicit packed bed. Therefore, a porous media model assumption was used to model the
pebble column. Previous studies, including Yan's work modeled the prismatic cores as
porous media as well. In FLUENT the user must specify the solid material present in the
porous media, which impacts the calculation of the heat transfer properties as well as the
porosity of the media. The governing momentum equation is modified by including an
additional momentum sink term to account for the added resistance of the porous media.
There are several different momentum sink models to use. The choice of momentum
sink model as well as values used in the model impact the resistance experienced by the
flow from the packed bed. Therefore, a sensitivity study was performed on FLUENT's
porous media model to determine if the model could be impacting the onset of natural
circulation.
The original model used the Power Law model, which was consistent with how Brudieu
[2] modeled the pebble column in the NACOK experiments. The Power Law momentum
sink model is given by:
S = -COJuJC,
Equation 2
where: S momentum sink term,
u fluid velocity
[m/s],
Co and C
1pressure loss coefficients [6].
The pressure loss coefficients therefore set the resistance to the flow for the porous zone.
The original model used the values determined by Brudieu for 10 mm diameter pebbles,
Co = 341 and C
1= 1.6107. However, the pebbles used in the experiment were 12 mm
diameter pebbles. Using the given values would then give an effective pebble column
resistance for 10 mm pebbles, which would be greater than the resistance for a bed of 12
mm pebbles. In the original pre-experiment model, it was assumed that the increased
resistance would be small and may account for additional losses not accounted for in the
model.
To check the porous media model, two additional tests of the effect of porous media
model were made. First the viscous loss coefficient model was used instead of the power
law model, and in the second the porous media model was not used. In the latter case,
the pebbles are effectively removed and an open hot leg exists offering no additional
resistance to flow. This would provide a lower bound on the resistance experienced in
the hot leg and should bound the onset time prediction, if the porous media model has a
substantial impact on the computational results.
S
=
-
u + C
pluJu
Equation 3
where: pt fluid viscosity [Pa-s],
K porous media permeability
[in2,
C2
inertia loss coefficient [1/rn],
p = fluid density [kg/m
3].
The inertia loss coefficient accounts for added loss from turbulence present through the
porous media. Note that for low velocity flows it will have only a small contribution on
the momentum sink term and the momentum sink term is simply Darcy's law through
porous media. The permeability and inertia loss coefficient are dependent on the
geometry and type of porous media. However, for a packed bed, they are easily
calculated from:
D
2e
3K=
P
150(1
_)2 Equation 43.5(l1- c)
C2 D 3® Equation 5where: Dp = pebble diameter [in],
e pebble bed porosity.
The original FLUENT model assumed the pebble bed porosity of 0.395 while the actual
experiment was above 0.4. For the experiment, the calculated values of the permeability
and inertia loss coefficient are: K = 1.7067e-7 [in
2] and C
2
= 2734. Since the momentum
sink therefore essentially scales with the inverse of the permeability, looking at 1/K for
the actual experiment and original FLUENT model gives an idea of how much extra
resistance was seen by using the 10 mm pebble assumption. The 1/K value for
experiment is: 1/K = 5.86e6 [m-
2] while for the original FLUENT model it was: 1/K
Thus, the original FLUENT model was about 1.5 times more resistant the actual
experimental model.
A FLUENT transient was then re-run with the change to the viscous loss coefficient
model as well as the case with no porous media used. The initial conditions and solver
settings and schemes were consistent between the original model and the case with no
pebbles. The case with the viscous loss model also included changes to solver settings
and schemes using higher order schemes and is provided in Appendix A2. The results of
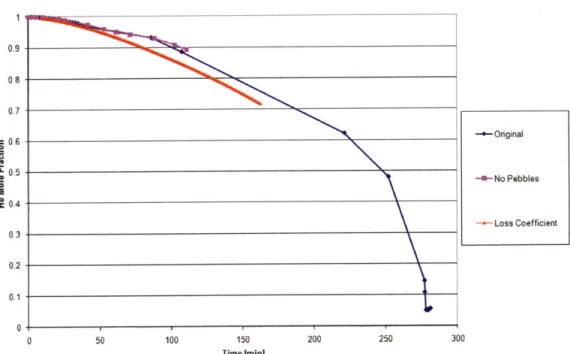
the three cases will be compared by examining the behavior of the average helium mole
fraction in the cross-over leg. Even though this quantity was not measured, observing its
behavior gives insight into the transport rate of nitrogen up the hot leg as well as how that
transport rate is changing with time. Looking at the results in this manner therefore
assumes once natural circulation starts the cross-over leg helium mole fraction will
quickly drop to low values (only a few percent at most).
Figure 12 gives the transient behavior of the average helium mole fraction in the
cross-over leg for each case. The original FLUENT case results show that when natural
circulation starts at about 280 minutes, there is a sharp drop in the helium mole fraction
in the cross over leg from about 15% to about 5%. Also note that later on in the transient
the rate of nitrogen transport up the hot leg (and so rate of decrease in helium mole
fraction in the cross-over leg) increases. The increased transport rate corresponds to the
increasing buoyancy force that arises as the configuration gets closer and closer to the
onset of natural circulation. The key point of Figure 12 is that the tested porous media
cases have very similar transport rates of nitrogen through the u-tube in the first few
hours. The no pebble case curve almost exactly follows the original results, while the
viscous loss model curve is slightly faster. The slightly different behavior of the viscous
loss model case can be explained from the higher order schemes and settings that were
applied to this particular case.
Both modified cases were not run out to the onset of natural circulation because the goal
of the investigation was to see if the porous media model was impacting the FLUENT
results relative to the experimental data. For the FLUENT results to better match the
experimental results, the cross-over leg average helium mole fraction would have to drop
to a few percent by about 120 minutes, and not 280 minutes. Since both cases were
greater than 80% helium in the cross-over leg by about 2 hours, it was obvious that the
porous media model in FLUENT had no major impact on the transport rate of nitrogen
during the first few hours and thus do not meaningfully affect the analysis of the onset to
natural circulation.
Cross-Over Leg He Mole Fraction Comparison
100 150 Time [min] -- Original -4-No Pebbles Loss Coefficient 200 250
Figure 12: Porous Media Investigation Cross-Over Leg Helium Mole Fraction
Comparison
6.2.2 Heat Flux Boundary
The original FLUENT model used a constant wall temperature boundary condition in the
hot leg. In reality, however, the power to the externally wrapped heaters was controlled
to try and maintain the average gas temperature in the hot leg to be near 200 'C. Thus,
higher temperature gas would be located near the walls which could rise at an increased
rate than accounted for in the original model. Therefore, to account for this another
0 9 08 0.7 = 0 6 UL 0 5 04 03 0.2 0.1 0
![Figure 1: Schematic of a Pebble Bed Reactor [2]](https://thumb-eu.123doks.com/thumbv2/123doknet/14757219.583174/8.918.179.750.173.599/figure-schematic-pebble-bed-reactor.webp)
![Figure 4: Phases of Air Ingress for Vertically Oriented Breaks [2]](https://thumb-eu.123doks.com/thumbv2/123doknet/14757219.583174/11.918.214.716.165.476/figure-phases-air-ingress-vertically-oriented-breaks.webp)