Lean and obese dietary phenotypes: differences in energy and substrate
metabolism and appetite
Louise Clamp
1, Anthony P. J. Hehir
2, Estelle V. Lambert
1, Christoph Beglinger
3and Julia H. Goedecke
4,1*
1Department of Human Biology, Division of Exercise Science and Sports Medicine, Faculty of Health Sciences, University of Cape Town, Cape Town 7725, South Africa
2Department of Human Biology, Division of Nutrition and Dietetics, Faculty of Health Sciences, University of Cape Town, Cape Town 7925, South Africa
3Division of Gastroenterology, University Hospital, 4031 Basel, Switzerland
4Non-communicable Disease Research Unit, South African Medical Research Council, Tygerberg 7505, South Africa (Submitted 14 July 2015– Accepted 4 August 2015 – First published online 18 September 2015)
Abstract
This study aimed to characterise lean and obese phenotypes according to diet and body composition, and to compare fasting and postprandial appetite and metabolic profiles following a high-fat test meal. A total of ten lean (BMI <25 kg/m2) high-fat (LHF), ten lean low-fat (LLF;>40
and<30 % energy from fat) and ten obese (BMI >30 kg/m2) high-fat consumers (OHF;>40 % energy from fat) were recruited. Before and following the test meal (4727 kJ (1130 kcal), 77 % fat, 20 % carbohydrate (CHO) and 3 % protein), fasting plasma glucose, insulin, leptin, ghrelin, peptide YY (PYY), RER, RMR and subjective appetite ratings (AR) were measured for 6 h. Thereafter, subjects consumed a self-selected portion of a standardised post-test meal (40 % fat, 45 % CHO and 15 % protein) and reported AR. Fasting (P= 0·01) and postprandial (P< 0·001) fat oxidation was significantly higher in LHF than in LLF but was not different between LHF and OHF. Although similar between the lean groups, fasting and postprandial energy expenditures were significantly higher in OHF compared with LHF (P < 0·01). Despite similar AR across groups, LLF consumed a relatively greater quantity of the post-test meal than did LHF (7·87 (SD2·96) v. 7·23 (SD2·67) g/kg, P = 0·013).
The lean groups showed appropriate changes in plasma ghrelin and PYY following the test meal, whereas the OHF group showed a blunted response. In conclusion, the LHF phenotype had a greater capacity for fat oxidation, which may be protective against weight gain. OHF individuals had a blunted appetite hormone response to the high-fat test meal, which may subsequently increase energy intake, driving further weight gain.
Key words:RMR: Diet: Fat oxidation: RER: Peptide YY: Ghrelin
The global obesity epidemic and the growing burden of asso-ciated co-morbidities have galvanised the scientific community in its efforts to identify the aetiological triggers that determine individual susceptibility to weight gain and attendant metabolic dysregulation(1,2). Genetic, behavioural and environmental factors have been implicated as contributing to the obese-susceptible phenotype(3,4). What is not clear is the extent to which dietary intake, and in particular, dietary macronutrient intake and substrate oxidation, may be causally associated with obesity, per se and metabolic dysregulation in the obese(5,6). For example, in some studies, the development of obesity has been shown to be associated with a high-fat diet(7,8) as it leads to increased energy intake and has been found to be less satiating than did the other macronutrients(9,10). However, a positive fat balance and subsequent weight gain may not only be linked to
intake, but also associated with a reduced rate of fat oxidation(11–14).
Blundell et al.(15) have previously characterised a specific dietary phenotype that consumes a high-energy, high-fat diet (44 % energy from fat) but remains weight stable and non-obese. In comparison with lean habitual low-fat consumers (32 % energy from fat), these individuals are characterised by having higher RMR, significantly lower RER(15) and higher fasting plasma leptin concentrations(16). These characteristics may serve to protect such individuals from weight gain. Furthermore, they found that these two groups displayed different appetite control characteristics(17). When challenged with high-fat meals, the lean high-fat (LHF) consumers ate a constant weight of food, whereas the lean low-fat (LLF) consumers ate a constant amount of energy. Taken together, thesefindings suggest that
* Corresponding author: Professor J. H. Goedecke, fax +27 21 686 7530, email julia.goedecke@uct.ac.za
Abbreviations: AR, appetite ratings; CHO, carbohydrate; FFM, fat-free mass; LHF, lean high-fat; LLF, lean low-fat; OHF, obese high-fat; PYY, peptide YY; SFQ, Short Fat Questionnaire; TE, total energy; TFEQ, Three Factor Eating Questionnaire.
these groups make up distinct, specific, dietary metabolic phenotypes.
Blundell et al.(18)have also compared LHF consumers with obese high-fat (OHF) consumers (>43 % of energy) to identify the characteristics that may make some individuals more sus-ceptible to weight gain. They found that, in comparison with LHF dietary phenotypes, susceptible individuals showed a preference for high-fat foods, a weak satiety, but strong hedonic response to high-fat foods, and also had high scores for disin-hibition and hunger as measured by the Three Factor Eating Questionnaire (TFEQ). Thus, the capacity of individuals to remain normal-weight despite ingesting a high-fat diet appears to be related, at least in part, to the capacity to oxidise dietary fat and to exhibit the appropriate satiety and hunger signals in response to certain macronutrients in the diet. A mismatch in these characteristics may lead to an increased susceptibility for obesity. For example, Marrades et al.(19) found that obese-susceptible individuals were more likely to be in positive fat balance, following a lipid-containing meal, than did their lean, diet- and age-matched counterparts.
An imbalance between energy intake and energy expendi-ture may also be partly a consequence of inadequate appetite regulation. Numerous gastrointestinal hormones have been implicated in appetite regulation, including long-acting adip-osity hormones such as leptin and insulin, and short-term hunger and satiety signals such as ghrelin and peptide YY (PYY)(20). Leptin is largely produced by adipose tissue and released into the circulation in proportion to the size of the adipose tissue stores(21). Leptin signals to key regulatory centres in the brain to inhibit food intake and regulate body weight and energy homoeostasis(22). In contrast, PYY, a short-term satiation hormone, produced mainly by distal-intestinal L cells in response to a meal, is lower in obese individuals(23). Although obese individuals do not display PYY resistance, lower endo-genous production of PYY in response to a meal may translate into reduced satiety(24). Ghrelin, produced by the stomach and proximal small intestine, functions and is regulated oppositely to satiation hormones. Ghrelin acts as an orexigenic signal promoting meal initiation, as circulating ghrelin levels increase before a meal(25)and decline postprandially(26).
Ghrelin levels correlate negatively with BMI, and obese individuals display an attenuated ghrelin response to a meal(27). Meal-induced suppression of ghrelin is dependent on the composition of the meal(28). Although carbohydrate (CHO)-rich meals induce a pronounced short-term suppression of ghrelin, levels are shown to subsequently rebound above those recor-ded at baseline. In contrast, fat- and protein-rich meals suppress ghrelin levels for up to 6 h after ingestion(29). PYY secretion is also shown to be greater in response to lipid-rich compared with CHO-rich meals(30), whereas leptin secretion is not altered by macronutrient composition(21). It is, however, not clear how the habitual diet or dietary phenotype alters the responsiveness of the satiety hormones to an acute meal, and how this is altered in the obese state.
Further exploration of these dietary and metabolic pheno-types may help to elucidate the underlying aetiology of obesity as well as the propensity for weight-loss relapse and diet-resistant obesity. Therefore, the aims of the present study were
the following: (i) to characterise and compare LLF and LHF dietary phenotypes as well as lean and OHF dietary phenotypes in terms of body composition, appetite, fasting metabolic rate and substrate oxidation; (ii) to compare changes in metabolic rate, substrate oxidation and appetite in response to a high-fat meal, in these groups; and (iii) to examine the relationships between hormonal modulators of appetite in response to a high-fat meal.
Methods Ethics approval
The study was conducted according to the guidelines laid down in the Declaration of Helsinki, and all procedures involving human participants were approved by the Human Research Ethics Committee of the Faculty of Health Sciences of the University of Cape Town (REC REF 064/2003). Written consent was obtained from all participants before participation in the study.
Subject screening and selection
Sample size determination was based on previous studies(31,32), in which mean differences between LHF and LLF phenotypes in RMR of 10·0 (SD 7·1) kJ/kg (2·4 (SD 1·7) kcal/kg) fat-free mass (FFM) and RER 0·05 (SD0·04)(31), as well as mean differences in fasting serum ghrelin concentrations of 295 (SD 241) pg/ml between lean and obese women(32) were observed. Using a power of 80 % andα-level of 0·05, the estimated sample size was eight to eleven men per group. A total of thirty healthy male subjects participated in the trial, ten per group. Subjects were recruited via advertisements in local newspapers and were selected according to their BMI and dietary phenotype, as previously described by Cooling & Blundell(17,31). These phenotypes were determined on the basis of self-reported habitual dietary intake as either high-fat (>40 % total energy (TE)) or low-fat (<30 % TE). Inclusion criteria were the following: (i) BMI< 25 kg/m2 for the lean groups and>30 kg/m2for the obese group; (ii) total average energy intake from dietary fat >40 % for high-fat consumers and <30 % for low-fat consumers; (iii) no known medical conditions or medications that may adversely affect metabolism; (iv) weight stable (<3 kg weight fluctuation in past 6 months); and (v) exercise not more than three times per week. These criteria allowed the subjects to be placed into one of three groups: LHF consumers, LLF consumers and OHF consumers. By design, there was a significant difference in the Short Fat Questionnaire (SFQ) score and self-reported dietary fat intake between the LLF and LHF groups (Table 1).
Weight and height were measured, and body composition was estimated using near infrared reactance (Futrex– 6100/XL; Futrex Inc.). Subjects were initially screened for habitual dietary fat intake using the validated SFQ(34). The SFQ estimates habi-tual dietary fat intake from a series of seventeen questions. A score of<17 correlates with a fat intake of <30 % TE, and a score of>28 correlates with a fat intake of >37·5 % TE(34). For the purpose of this trial, low-fat consumers were categorised on
the SFQ as having a score of <18 and high-fat consumers as having a score of>30. Dietary intake was confirmed using a 3 d dietary record, which was analysed for TE and macronutrient intake using Food Finder II Dietary Analysis Programme (MRC). Dietary fat intakes of<30 or >40 % TE were used as thresholds for identifying the low-fat and high-fat consumers, respectively. Subjects also had completed a 24 h dietary record on the day before the experimental trial to confirm that the subjects’ habitual dietary intakes did not change. Dietary restraint, hun-ger and disinhibition were also measured using the Three Factor Eating Inventory (TFEQ)(35).
Experimental trial
Subjects reported to the laboratory after an overnight fast (10–12 h). Fasting RMR, RER and appetite sensations were measured, and a fasting blood sample was drawn for the determination of serum glucose, insulin, leptin, ghrelin and PYY concentrations. The subjects then ingested a standardised high-fat test meal, following which RMR, RER and appetite sensations were measured hourly for 6 h, and blood samples for the determination of plasma ghrelin and PYY levels were drawn hourly for 3 h. At the end of the trial, subjects consumed a quantified but self-selected portion of a standardised lunch, after which appetite sensations were measured again. Subjects remained in a resting state for the duration of the trial and were permitted to drink 250 ml of water.
Test meal. The test meal consisted of a 4723 kJ milkshake (200 ml cream, 200 g full-fat ice-cream and 100 ml full-cream milk), comprising 77 % fat (98 g), 20 % CHO (56 g) and 3 % protein (11 g). The high-fat (77 %) content of the test meal was chosen in order to optimise the chances of detecting metabolic and appetite differences between the groups in response to dietary fat. All subjects were fed afixed volume of the test meal to replicate the protocol of Cooling & Blundell(31). It was also intended to reflect an energy-dense food choice available to free living individuals. This allows the opportunity to assess differences in metabolic and appetite hormone response between dietary phenotypes, as well as between lean and obese individuals of the same dietary phenotype, to the identical meal.
Metabolic measurements and calculations. RMR was mea-sured on all subjects in the morning after a 12 h overnight fast. Subjects rested in supine position, in a quiet, isolated room, with a temperature ranging from 21 to 24°C, after which the basal respiratory exchange was measured for 20 min and again, every hour for 6 h after the consumption of the test meal using the ventilated hood technique (VMax Metabolic Cart 229; SensorMedics). Before each experimental trial, the metabolic cart was calibrated with a Hans Rudolph 3L syringe, and the analysers were calibrated using standard gas mixtures of oxygen (26 % O2 with the balance nitrogen) and carbon dioxide (4 % CO2, 16 % O2 and the balance nitrogen) (BOC Special Gas).
RMR and total rates of fat and CHO oxidation were calculated using the equations of Weir(36)and Frayn(37), respectively. The
thermic effect of feeding (TEF) was calculated as the increased energy expenditure after the test meal, expressed as a percentage of fasting RMR (TEF= ((AUCRMR/RMR0 h)− 1) × 100). Energy balance was calculated as the difference between the energy ingested in the test meal and the energy expended during the postprandial period (EI− AUCRMR). Fat balance was calculated as the difference between fat ingested and fat oxidised (Fat intake− AUCfat oxidation)(38).
Blood sampling and analysis. Following the fasting respiratory exchange measurements, a cannula attached to a three-way stopcock was inserted into the antecubital vein for blood sampling. A fasting blood sample (approximately 18 ml) was drawn for the determination of serum glucose, insulin, leptin, ghrelin and PYY concentrations. Thereafter, samples for the determination of serum ghrelin and PYY concentrations were drawn 1 and 3 h following the test meal. Samples were kept on ice until centrifuged at 3000 rpm at 4°C for 10 min and were then stored at −80°C for later analysis. Plasma glucose con-centrations were determined using the glucose oxidase method (Glucose Analyzer 2; Beckman Instruments). Commercial radio-immunoassays were used to measure plasma insulin (Axsym Insulin Assay; Abbott Laboratories), leptin (Human Leptin RIA Kit, LINCO Research Inc.), ghrelin (Human Ghrelin RIA Kit; Phoenix Pharmaceuticals Inc.) and PYY (Human PYY RIA Kit, LINCO Research Inc.) concentrations. Insulin resistance was estimated using the formula of the homoeostatic model assessment for insulin resistance (HOMA-IR= (fasting glucose (mmol/l)× fasting insulin (mU/l))/22·5)(33).
Appetite questionnaires. Ratings of behavioural appetite (hunger, fullness, prospective consumption and satiety) were investigated before, every 1 h following the test meal, and immediately after the post-test lunch, using a validated 100 mm line scale(39,40). Each sensation was assessed with a separate line scale anchored with the opposing extremes of the sensation (e.g.‘Not at all full’ (0 mm) to ‘Extremely full’ (100 mm)). Post-test meal (lunch). After 6 h of the test meal, subjects were invited to eat a self-selected quantity of a standardised lunch of ready-made macaroni cheese (40 % fat, 45 % CHO and 15 % protein; Today’s Frozen Foods), which was of similar compo-sition to a typical Western South African diet(41). The meal was served in a large casserole dish from which the subjects served themselves ad libitum. Food quantity was covertly measured by weighing the plate before and after completion of the meal and by measuring plate wastage.
Statistical analysis
For the analyses, the LHF group was compared with both the LLF group and the OHF group independently, allowing for the following comparisons: (i) between groups with different diet-ary phenotypes but similar body composition (LHF v. LLF); and (ii) between groups of similar dietary phenotype but different body composition (LHF v. OHF). We included ten men per group. A Bonferroni correction was used to correct for pair-wise
comparisons (two groups) throughout, and, as a result, only a P value<0·025 (0·05/2) was considered statistically significant. An independent t test was used to analyse differences between groups at the outset. Two-way ANOVA for repeated-measures was used to analyse the differences between groups over time. A Tukey honest significant difference post hoc test was per-formed to locate specific differences between groups over time. Peason’s correlation was used to assess whether energy intake and macronutrient composition– as analysed from the 3 d dietary records and the 24 h record before the trial– were similar and reflected usual dietary intake. Results are expressed as means and standard deviations. Data were normalised by log transformation where required. STATISTICA (version 10; Statsoft) was used to perform the statistical analyses.
Results
Body composition and dietary intake
The characteristics of the LLF, LHF and OHF groups are pre-sented in Table 1. There were no differences in body compo-sition between the LLF and LHF groups, whereas participants of the OHF group were heavier, and had greater body fat and FFM than that of the LHF group. The LHF group had a significantly higher fat intake (g and % TE) and consequently a higher TE intake than that of the LLF group. Absolute CHO and protein intakes were not different between the LLF and LHF groups,
but, when expressed in terms of TE, the LHF group ingested less CHO than did the LLF group. In contrast, there were no differences in SFQ score or TE or macronutrient intakes between the LHF and OHF groups (Table 1). Dietary intake recorded using the 3 d dietary record and the 24 h record on the day before the experimental trial correlated significantly for energy (r 0·87, P < 0·001) and macronutrient intake (r 0·90, 0·60 and 0·66 for fat, CHO and protein intakes, respectively, P< 0·001) for all three groups (group data not shown). On the basis of the results of the TFEQ, the OHF group had sig-nificantly higher levels of disinhibition and hunger than that of the LHF. In contrast, there were no differences in dietary restraint, disinhibition or hunger between the LHF and LLF groups (Table 1).
Circulating metabolite and hormone concentrations Fasting plasma glucose and hormone levels, as well as insulin resistance estimated using HOMA, are presented in Table 1. There were no differences in fasting plasma glucose or hor-mone levels between the LLF and LHF groups. In contrast, the OHF group had higher fasting plasma glucose and insulin levels, and consequently were more insulin resistant than that of the LHF group. In addition, fasting plasma leptin levels were significantly higher, and fasting plasma ghrelin levels tended to be lower in the OHF than the LHF group. Fasting plasma PYY levels were not different between groups.
Table 1. Subject characteristics
(Mean values and standard deviations;n 10)
LLF LHF OHF
Mean SD Mean SD Mean SD LHFv. LLF (P ) LHFv. OHF (P )
Age (years) 27 4 25 5 30 6 0·481 0·066 Body composition Height (m) 1·78 0·08 1·78 0·07 1·78 0·1 0·977 0·918 Body weight (kg) 69·5 10·2 70·9 5·8 105·4 16 0·705 0·001 BMI (kg/m2) 21·8 1·9 22·3 1·6 33·2 3·0 0·513 <0·001 Body fat (%) 11·2 2·9 12·8 2·7 28·7 3·9 0·198 <0·001 Fat mass (kg) 8·4 3·6 9·4 2·3 30·5 7·4 0·465 <0·001 Fat-free mass (kg) 61·1 6·8 61·5 5·0 74·9 10·5 0·875 0·002
Dietary intake and eating attitudes
SFQ score 17 5 39 8 38 5 <0·001 0·637 Energy (mJ/d) 8·6 1·6 12·5 3·3 16·6 4·9 0·003 0·120 Fat (g/d) 55 19 145 41 203 116 <0·001 0·152 Fat (% TE) 23·7 4·5 43·1 4·4 44·1 4·4 <0·001 0·611 CHO (g/d) 270 16 306 92 378 122 0·287 0·152 CHO (% TE) 53·1 8·8 39·4 5·3 37·6 4·6 <0·00 0·422 Protein (g/d) 88 32 98 34 156 91 0·504 0·076 Protein (% TE) 17·5 4·6 13·3 2·8 15·6 2·3 0·026 0·069 Alcohol (% TE) 2·6 5·2 3·9 4·4 2·2 4 0·553 0·378 TFEQ restraint 6·6 4·8 3·2 2·5 2·9 2·2 0·063 0·778 TFEQ disinhibition 4·0 2·2 4·6 2·1 9·0 3·3 0·538 0·002 TFEQ hunger 4·9 3·7 6·1 3·5 10·1 1·6 0·461 0·004
Metabolite and hormone concentrations
Glucose (mmol/l) 4·5 0·4 4·5 0·3 5·4 0·4 0·746 <0·001 Insulin (mU/l) 3·2 1·9 5·2 3·3 15·2 9·8 0·082 <0·001 HOMA-IR 0·65 0·39 1·01 0·60 3·49 2·38 0·128 0·005 Leptin (ng/ml) 3·7 2·4 4·0 2·3 11·6 5·0 0·874 <0·001 Ghrelin (pg/ml) 478·4 80·6 529·3 216·2 368·7 70·8 0·721 0·032 PYY (pg/ml) 169·3 40·3 157·5 34·0 171·0 28·7 0·490 0·352
CHO, carbohydrate; HOMA-IR, homoeostatic model assessment for insulin resistance(33); LHF, lean high-fat group; LLF, lean low-fat group; OHF, obese high-fat group; PYY, peptide
Energy and substrate balance
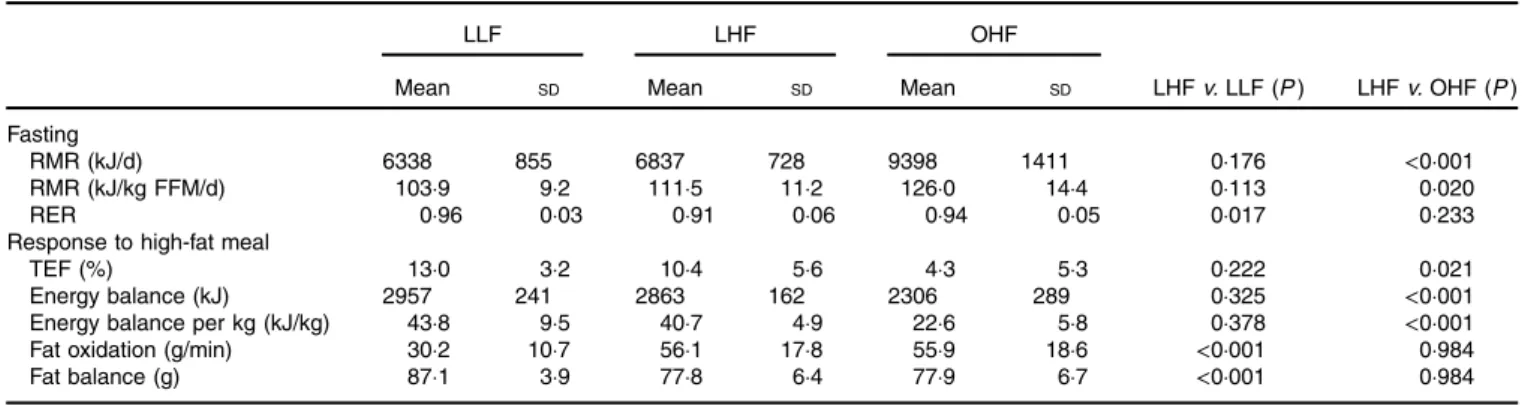
Energy and substrate balance in the fasted state and in response to the high-fat meal are presented in Table 2. Fasting RMR was not different between the lean groups. However, the LHF group had a significantly lower fasting RER than that of the LLF group. In contrast, there were no differences in RER between the LHF and OHF groups, but the OHF group had a significantly higher fasting RMR, expressed both in absolute terms and relative to FFM, than that of the LHF group.
There were no significant differences in energy balance in response to the high-fat meal between the LLF and LHF groups. The change in substrate oxidation in response to the test meal was similar in the LLF and LHF groups (Fig. 1). However, the lower baseline fasting RER, in the LHF compared with the LLF group, was maintained following the meal so that the LHF effectively oxidised significantly more fat in the postprandial period than that the LLF group consumed (Table 2). By virtue of their greater size, the OHF group compared with the LHF group showed a sig-nificantly lower thermic response and was in less positive energy balance following the high-fat test meal. There were no differences in RER (Fig. 1) or fat balance between the LHF and OHF groups. Appetite ratings and satiety hormones
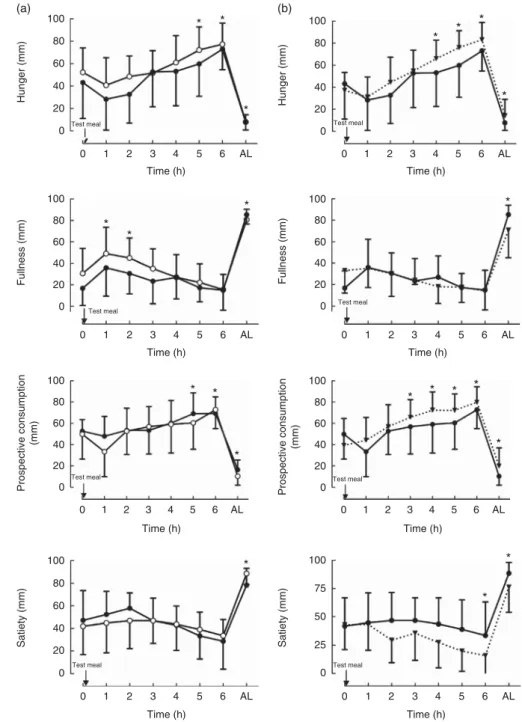
Appetite ratings (AR) in response to the high-fat meal are pre-sented in Fig. 2. There were no differences in fasting AR or AR
in response to the high-fat meal or the post-test meal between the LHF and LLF groups. Similarly, there were no significant differences in AR between the LHF and OHF groups when measured over time or as the AUC (data not shown). There were, however, significant and appropriate changes in AR in response to the high-fat meal and the post-test meal. For example, hunger ratings decreased after the high-fat meal and then increased significantly 4–5 h after the high-fat meal, and then decreased dramatically and significantly after the post-test meal in all groups. Post-test meal consumption was also not different between the LLF and LHF groups (533·7 (SD156·2) v. 509·1 (SD 186·5) g, P = 0·752) or between the LHF and OHF groups (509·1 (SD 186·5) v. 482·7 (SD 175) g, P= 0·748). How-ever, when expressed relative to body size, the OHF group ate significantly less than that of the LHF group (4·58 (SD 1·48) v. 7·23 (SD2·67), P = 0·013).
Plasma ghrelin and PYY responses to the high-fat meal are presented in Fig. 3. Plasma ghrelin levels decreased similarly in the LLF and LHF groups in response to the high-fat meal. In contrast, in the OHF group, plasma ghrelin levels did not change in response to the high-fat meal, with a significant group× time interaction between the LHF and OHF groups (P= 0·01). In contrast to ghrelin, plasma PYY levels increased significantly in response to the high-fat meal in the LLF and LHF groups, with a tendency for a group× time interaction (P= 0·04). Compared with the LHF group, the OHF group had a
Table 2. Energy and substrate balance in the fasted state and in response to the high-fat meal (Mean values and standard deviations)
LLF LHF OHF
Mean SD Mean SD Mean SD LHFv. LLF (P ) LHFv. OHF (P )
Fasting
RMR (kJ/d) 6338 855 6837 728 9398 1411 0·176 <0·001
RMR (kJ/kg FFM/d) 103·9 9·2 111·5 11·2 126·0 14·4 0·113 0·020
RER 0·96 0·03 0·91 0·06 0·94 0·05 0·017 0·233
Response to high-fat meal
TEF (%) 13·0 3·2 10·4 5·6 4·3 5·3 0·222 0·021
Energy balance (kJ) 2957 241 2863 162 2306 289 0·325 <0·001
Energy balance per kg (kJ/kg) 43·8 9·5 40·7 4·9 22·6 5·8 0·378 <0·001
Fat oxidation (g/min) 30·2 10·7 56·1 17·8 55·9 18·6 <0·001 0·984
Fat balance (g) 87·1 3·9 77·8 6·4 77·9 6·7 <0·001 0·984
FFM, fat-free mass; LHF, lean high-fat group; LLF, lean low-fat group; OHF, obese high-fat group; TEF, thermic effect of feeding.
1.00 0.95 0.90 0.85 0.80 0 1 2 3 4 5 6 Time (h) 0 1 2 3 4 5 6 Time (h) RER 1.00 0.95 0.90 0.85 0.80 RER * * * * * (a) (b) †
Fig. 1. Changes in RER in response to the high-fat meal in the (a) lean high-fat ( , LHF)v. lean low-fat ( , LLF) groups, and (b) LHFv. obese high-fat ( , OHF) groups. Values are means and standard deviations. (a) LLFv. LHF: † P < 0·001 for group effect; * P < 0·001 for time effect from baseline for both groups (no group × time effect indicating similar response to the test meal). (b) LHFv. OHF: * P < 0·001 for time effect from baseline for both groups.
blunted PYY response to the high-fat meal (P= 0·002 for group× time interaction).
Discussion
The main findings of this study were that we were able to characterise LLF as well as LHF and OHF dietary phenotypes, based on habitual low-fat (<30 % of TE intake) or high-fat (>40 % of TE) dietary intake. These comparisons reveal underlying differences that may help to explain why some individuals on a high-fat diet are protected from weight gain,
whereas others are not. Compared with the LLF group, the LHF group showed higher baseline fasting fat oxidation, which was maintained in the postprandial period, and this meant that they oxidised a greater amount of fat ingested in the high-fat test meal, suggestive of some adaptive response to the high-fat diet, whereas there were no differences in rates of fat oxidation between the LHF and OHF groups. In contrast, although the lean dietary phenotypes did not differ in energy expenditure or appetite responses to the high-fat meal, the OHF group showed significantly higher rates of energy expenditure, along with dampened ghrelin and PYY responses to the high-fat meal.
100 80 60 40 20 0 100 80 60 40 20 0 100 80 60 40 20 0 100 80 60 40 20 0 100 80 60 40 20 0 100 80 60 40 20 0 100 80 60 40 20 0 100 75 50 25 0 0 1 2 3 4 5 6 AL Time (h) 0 1 2 3 4 5 6 AL Time (h) 0 1 2 3 4 5 6 AL Time (h) 0 1 2 3 4 5 6 AL Time (h) 0 1 2 3 4 5 6 AL Time (h) 0 1 2 3 4 5 6 AL Time (h) 0 1 2 3 4 5 6 AL Time (h) 0 1 2 3 4 5 6 AL Time (h) Hunger (mm) Fullness (mm) Prospective consumption (mm) Satiety (mm) Hunger (mm) Fullness (mm) Prospective consumption (mm) Satiety (mm) * * * * * * * * * * * * * * * * * * * * *
Test meal Test meal
Test meal
Test meal
Test meal Test meal
Test meal Test meal
(a) (b)
*
Fig. 2. Changes in ratings of hunger, fullness, prospective consumption and satiety in response to the high-fat meal in the (a) lean high-fat ( , LHF)v. lean low-fat ( , LLF) groups; and (b) LHFv. obese high-fat ( , OHF) subjects. Values are means and standard deviations. *P < 0·001 for time effect from baseline for all four ratings of appetite. AL, after lunch.
The blunted appetite hormone signals in the OHF group were not reflected in subjective AR, which were similar to those of the lean phenotypes. However, significantly higher scores for hunger and disinhibition on the TFEQ in the OHF compared with the LHF group indicate that the OHF group experiences persistent difficulties with appetite control.
Similar to earlierfindings of Cooling & Blundell(15–17,31), we identified lean dietary phenotypes, and despite the differences in dietary macronutrient intake, these individuals were all lean. Although cross-sectional, comparisons between the LLF and LHF groups allow us to explore differences that may help to explain why the LHF appears to be resistant to weight gain, despite a higher energy and dietary fat intake. Our results showed that the LHF was able to oxidise a greater amount of fat, both in the fasted state and postprandially, than that of the LLF group. It is understood that LHF phenotypes develop an adaptive response to habitual high fat intake(42,43), and poten-tially a higher metabolic rate(15,31), which may be protective against weight gain. It has been suggested that a higher meta-bolic rate in high-fat compared with low-fat consumers may be explained by higher leptin levels(16) and/or linked to their higher energy and protein intake (g/d)(31). Our results do not, however, confirm these findings, and despite a higher energy intake, LHF consumers show similar energy expenditure to that of LLF, both in the fasted state and in response to the test meal. There were also no differences in fasting plasma glucose or leptin levels, and, although the energy intake was higher in the LHF v. LLF group, the protein intake between the lean groups was not significantly different (98 (SD34) v. 88 (SD32) g protein/d, respectively, P= 0·076). However, in the study of Cooling &
Blundell(31), although the high-fat group also consumed more TE, their protein intake was almost double that of the low-fat group (high fat: 158·8 (SD17·9) v. low fat: 80·8 (SD7·2) g protein/d, P< 0·05), which may account for the higher energy expenditure observed in the high-fat group. This highlights the potential role of a higher absolute amount of dietary protein intake in the context of a high-fat diet, conferring a protective effect against weight gain by increasing energy expenditure. Higher protein intake has been shown to be effective in countering declines in energy expenditure both during dynamic weight loss(44,45)and in weight loss maintenance(46).
Cross-sectional comparisons between LHF and OHF groups suggest possible explanations as to why one group is lean, whereas the other is obese, despite a similar dietary regimen. All participants were matched for habitual levels of physical activity to control for the effect this may have had on rates of fat oxidation. Overall the LHF and OHF groups showed no sig-nificant differences in the absolute rate of fat oxidation or fat balance, demonstrating similar adaptation to a high-fat diet and the standardised meal challenge. Nonetheless, there was large variability in rates of fat oxidation in response to the high-fat meal within the OHF group. In particular, two individuals showed a reduced capacity for fat oxidation, which was more in line with that demonstrated by the LLF group, despite the habitual high fat intake. Future studies should therefore investigate potential genetic or environmental factors that may explain this individual variability in dietary adaptation and response to high fat intake. This may help to further our understanding of the development of obesity and improve optimisation of individua-lised dietary macronutrient recommendations.
750 650 550 450 350 250 300 250 200 150 100 750 650 550 450 350 250 300 250 200 150 100 0 1 2 3 0 1 2 3 0 1 2 3 0 1 2 3 Plasma (Ghrelin) (pg/ml)
Plasma (PYY) (pg/ml) Plasma (PYY) (pg/ml)
Plasma (Ghrelin) (pg/ml) Time (h) Time (h) Time (h) Time (h) (a) (b) * * * * * * * * † ‡
Fig. 3. Changes in plasma ghrelin and peptide YY (PYY) levels in response to the high-fat meal in the (a) lean high-fat ( , LHF)v. lean low-fat ( , LLF) groups; and (b) LHFv. obese high-fat ( , OHF) groups. Values are means and standard deviations. (a) LLFv. LHF: * P < 0·01 for time effect from baseline for plasma ghrelin and PYY levels in both groups;P = 0·04 for group x time effect for PYY. (b) LHF v. OHF: * P < 0·01 for time effect from baseline for plasma ghrelin and PYY levels in the LLF group only;† P = 0·01 for group × time effect for plasma ghrelin; ‡ P = 0·002 for group × time effect for plasma PYY levels.
In terms of energy expenditure, as shown previously(47,48), the OHF group demonstrated a significantly greater fasting RMR than did the LHF group, even after adjusting for FFM, and several factors may contribute to this. Both leptin and insulin are involved in signalling body energy stores and influencing energy expen-diture to bring about long-term energy balance(49–52). Both of these hormones were elevated in our OHF group, and this would be expected to moderate energy intake while increasing energy expenditure. Furthermore, although contributing only 15–20 % of the energy expenditure of each gram of FFM, the greater size of adipose tissue of obese individuals suggests that this contribution should not be overlooked(53,54). Finally, it has been shown that with increasing adiposity, the mass of highly metabolically active components of FFM (heart, liver and kidney) is increased, and, as a result, there is a far greater increase to RMR/kg FFM with increasing percentage FM(55,56). The TEF in response to the test meal was not different between the lean groups but was sig-nificantly lower for the OHF compared with the LHF group. This is believed to be the result of the study protocol that used a stan-dardised test meal for all participants, which resulted in the OHF group consuming a lower energy intake per unit body mass. Similarly, energy balance during the postprandial period was sig-nificantly lower in the OHF than the LHF group, confirming higher rates of energy utilisation by the obese group by virtue of their greater body size and FFM. Indeed, earlier studies showed that increased meal size, along with FFM, are shown to increase the TEF(57). It is therefore likely that differences between these two groups would have been diminished, had the study protocol assigned test meals that were normalised for body size.
There were a number of key differences in hormones involved in appetite regulation that distinguished lean and obese groups. Compared with the LHF group, the OHF group had higher plasma leptin and insulin levels, together with increased resting energy expenditure, and yet had higher hunger and disinhibition scores on the TFEQ, suggesting ‘selective leptin and insulin resistance’(58,59)
. Possible mechan-isms include down-regulation of hypothalamic leptin receptor expression causing resistance to leptin signalling(60) and impaired leptin transport across the blood brain barrier in obese individuals(61), potentially increasing the risk of diet-induced obesity. Tschop et al.(62) also showed a negative correlation between insulin and leptin levels and the hunger hormone ghrelin. The reduced ghrelin hunger signal in the OHF group was, however, not reflected in their subjective hunger ratings, which were similar to the lean group. Postprandial hypergly-caemia in healthy overweight and obese humans has been shown to reduce PYY3–36 and ghrelin responses to a meal challenge and‘abolish meal-induced satiety’, measured using a visual analogue scale(63). This suggests that blunted appetite hormone responses may be secondary to the development of obesity-related insulin resistance and may subsequently con-tribute to the maintenance or worsening of obesity, rather than its development. As ghrelin is also involved in nutrient parti-tioning, this constant signal may also promote fat storage independent of increased food intake, through the up-regulation of lipogenic enzymes in white adipose tissue(64). Although obese subjects ate less of the post-test meal than did their lean counterparts, this may be because of the feelings of
self-consciousness about body size(65). Therefore, it would appear that there is an impaired ability of these hormones to control short- and term energy intake and to restore long-term energy balance within the obese group, and, although they report similar subjective AR to the LHF group, under free-living conditions, hedonic factors may override natural satiety signals in obese individuals, causing them to overeat(66).
There were a number of limitations with this study. Subjects in this study are exclusively men so results cannot be more generally extrapolated. The study design also required that all participants ingest the same volume of the standardised test meal, unadjusted for body size or energy expenditure. Although this presents a potential limitation, our rationale is that this test meal reflects an energy dense consumer option available to free-living individuals (e.g. a standardised size, energy dense, high-fat milkshake). It then allows us to observe differences in metabolic and physiological responses to the consumption of this choice between lean and obese dietary phenotypes. For example, the muted response of appetite hormones to the meal challenge in the OHF group highlights that a standardised, energy dense, high-fat meal choice will not produce the same alteration in postprandial appetite signalling as that is shown in lean individuals. It may then be likely that obese individuals require‘super-sized’ versions of the meal, possibly as a function of body size and composition, in order to achieve the same appetite response. Future studies should employ alternative protocols to allow the investigation of the energy and macro-nutrient composition required to achieve this. It is interesting to note, however, that subjective AR were similar despite test meal standardisation across groups, although this may not allude to subsequent food choices by the different groups under free-living conditions. As our design is cross-sectional, we are also unable to determine cause and effect and cannot be certain that the LHF group is protected from weight gain in the face of higher energy intake over the long term.
In conclusion, LHF consumers are adapted to their habitual dietary intake, metabolising greater amounts of fat in the fasted state and following ingestion of a high-fat meal compared with LLF consumers, which potentially enables them to remain lean. OHF consumers, however, were more insulin resistant and, despite higher leptin levels, showed selective leptin resistance with increased levels of energy expenditure, whereas their TFEQ scores suggest that they experienced greater difficulty in controlling appetite, and this may drive excess energy intake. It is notable that appetite hormone responses in obese indivi-duals, both in the fasted state and in response to the high-fat meal challenge, were blunted in comparison with lean indivi-duals, even after controlling for habitual dietary macronutrient intake. It therefore appears that hormonal signals responsible for reducing the drive for energy intake, are altered in obesity and insulin resistant states. Under free-living conditions this may result in increased energy intake despite adequate energy stores, thus contributing towards steady weight gain over time.
Acknowledgements
The authors would like to thank the subjects who gave of their time to participate in the trial. They are grateful to Today’s
Frozen Foods, Cape Town, for their generous donation of food. They are also grateful to Lara Keytel and Judy Belonje for their expert technical assistance.
This study received no specific grant from any funding agency, commercial or not-for-profit sectors.
J. G. and E. V. L. designed the study. J. G., A. H. and C. B. carried out the study. L. C., A. H. and J. G. analysed the data. L. C., A. H., J. G., C. B. and E. V. L. contributed to the writing of the manuscript and approved thefinal submission.
There are no conflicts of interest to declare.
References
1. Grattan BJ & Connolly-Schoonen J (2012) Addressing weight loss recidivism: a clinical focus on metabolic rate and the psychological aspects of obesity. ISRN Obes 2012, 1–5. 2. Maclean PS, Bergouignan A, Cornier M, et al. (2011) Biology’s
response to dieting: the impetus for weight regain Am J Physiol Regul Integr Comp Physiol 301, 581–600.
3. Davis C, Curtis C, Levitan RD, et al. (2011) Evidence that ‘food addiction’ is a valid phenotype of obesity. Appetite 57, 711–717.
4. Bell CG, Walley AJ & Froguel P (2005) The genetics of human obesity. Nat Rev Genet 6, 221–234.
5. Blaak EE, Hul G, Verdich C, et al. (2006) Fat oxidation before and after a high fat load in the obese insulin-resistant state. J Clin Endocrinol Metab 91, 1462–1469.
6. Heilbronn LK, Gregersen S, Shirkhedkar D, et al. (2007) Impaired fat oxidation after a single high-fat meal in insulin-sensitive nondiabetic individuals with a family history of type 2 diabetes. Diabetes 56, 2046–2053.
7. Ravussin E & Swinburn BA (1992) Pathophysiology of obesity. Lancet 340, 404–408.
8. Macdiarmid JI, Cade JE & Blundell JE (1996) High and low fat consumers, their macronutrient intake and body mass index: further analysis of the National diet and nutrition survey of british adults. Eur J Clin Nutr 50, 505–512.
9. Rolls BJ, Kim-Harris S, Fischman MW, et al. (1994) Satiety after preloads with different amounts of fat and carbohydrate: implications for obesity. Am J Clin Nutr 60, 476–487. 10. Speechly DP & Buffenstein R (2000) Appetite dysfunction in
obese males: evidence for role of hyperinsulinaemia in pas-sive overconsumption with a high fat diet. Eur J Clin Nutr 54, 225–233.
11. Zurlo F, Lillioja S, Esposito-Del Puente A, et al. (1990) Low ratio of fat to carbohydrate oxidation as predictor of weight gain: study of 24-h RQ. Am J Physiol Endocrinol Metab 259, E650–E657.
12. Houmard JA & Carolina N (2008) Intramuscular lipid oxidation and obesity. Am J Physiol Regul Integr Comp Physiol 294, R1111–R1116.
13. Koves TR, Ussher JR, Noland RC, et al. (2008) Mitochondrial overload and incomplete fatty acid oxidation contribute to skeletal muscle insulin resistance. Cell Metab 7, 45–56. 14. Simoneau JA, Veerkamp JH, Turcotte LP, et al. (1999) Markers
of capacity to utilize fatty acids in human skeletal muscle: relation to insulin resistance and obesity and effects of weight loss. FASEB J 13, 2051–2060.
15. Cooling J & Blundell JE (2000) Lean male high- and low-fat phenotypes – different routes for achieving energy balance. Int J Obes 24, 1561–1566.
16. Cooling J, Barth J & Blundell J (1998) The high-fat phenotype: is leptin involved in the adaptive response to a high fat (high energy) diet? Int J Obes 22, 1132–1135.
17. Cooling J & Blundell J (1998) Are high-fat and low-fat con-sumers distinct phenotypes? Differences in the subjective and behavioural response to energy and nutrient challenges. Eur J Clin Nutr 52, 193–201.
18. Blundell JE, Stubbs RJ, Golding C, et al. (2005) Resistance and susceptibility to weight gain: Individual variability in response to a high-fat diet. Physiol Behav 86, 614–622.
19. Marrades MP, Martínez JA & Moreno-Aliaga MJ (2007) Differences in short-term metabolic responses to a lipid load in lean (resistant) vs obese (susceptible) young male subjects with habitual high-fat consumption. Eur J Clin Nutr 61, 166–174.
20. Cummings DE & Overduin J (2007) Review series: gastro-intestinal regulation of food intake. J Clin Invest 117, 13–23. 21. Weigle DS, Duell PB, Connor WE, et al. (1997) Effect of fasting, refeeding, and dietary fat restriction on plasma leptin levels. J Clin Endocrinol Metab 82, 561–565.
22. Halaas J, Gajiwala K, Maffei M, et al. (1995) Weight-reducing effects of the plasma protein encoded by the obese gene. Science 269, 543–546.
23. Batterham RL, Cohen MA, Ellis SM, et al. (2003) Inhibition of food intake in obese subjects by peptide YY3-36. N Engl J Med 349, 941–948.
24. Le Roux CW, Batterham RL, Aylwin SJB, et al. (2006) Attenuated peptide YY release in obese subjects is associated with reduced satiety. Endocrinology 147, 3–8.
25. Cummings DE, Purnell JQ, Frayo RS, et al. (2001) A pre-prandial rise in plasma ghrelin levels suggests a role in meal initiation in humans. Diabetes 50, 1714–1719.
26. Tschöp M, Wawarta R, Riepl RL, et al. (2001) Post-prandial decrease of circulating human ghrelin levels. J Endocrinol Invest 24, RC19–RC21.
27. English PJ, Ghatei MA, Malik IA, et al. (2002) Food fails to suppress ghrelin levels in obese humans. J Clin Endocrinol Metab 87, 2984–2987.
28. Cummings DE, Foster-Schubert KE & Overduin J (2005) Ghrelin and energy balance: focus on current controversies. Curr Drug Targets 6, 153–169.
29. Foster-Schubert KE, Overduin J, Prudom CE, et al. (2008) Acyl and total ghrelin are suppressed strongly by ingested proteins, weakly by lipids, and biphasically by carbohydrates. J Clin Endocrinol Metab 93, 1971–1979.
30. Degen L, Oesch S, Casanova M, et al. (2005) Effect of peptide YY3-36 on food intake in humans. Gastroenterology 129, 1430–1436.
31. Cooling J & Blundell J (1998) Differences in energy expen-diture and substrate oxidation between habitual high fat and low fat consumers (phenotypes). Int J Obes 22, 612–618. 32. Zwirska-Korczala K, Konturek SJ, Sodowski M, et al. (2007)
Basal and postprandial plasma levels of PYY, ghrelin, chole-cystokinin, gastrin and insulin in women with moderate and morbid obesity and metabolic syndrome. J Physiol Pharmacol 58, 13–35.
33. Matthews DR, Hosker JP, Rudenski AS, et al. (1985) Home-ostasis model assessment: insulin resistance and beta-cell function from fasting plasma glucose and insulin concentrations in man. Diabetologia 28, 412–419.
34. Dobson AJ, Blijlevens R, Alexander HM, et al. (1993) Short fat questionnaire: a self-administered measure of fat-intake behaviour. Aust J Public Health 17, 144–149.
35. Stunkard AJ & Messick S (1985) The three-factor eating questionnaire to measure dietary restraint, disinhibition and hunger. J Psychosom Res 29, 71–83.
36. De Weir JB (1949) New methods for calculating metabolic rate with special reference to protein metabolism. J Physiol 109, 1–9.
37. Frayn KN (1983) Calculation of substrate oxidation rates in vivo from gaseous exchange rates. J Appl Physiol 55, 628–634.
38. Schutz Y (2004) Concept of fat balance in human obesity revisited with particular reference to de novo lipogenesis. Int J Obes Relat Metab Disord 28, S3–S11.
39. Flint A, Raben A, Blundell JE, et al. (2000) Reproducibility, power and validity of visual analogue scales in assessment of appetite sensations in single test meal studies. Int J Obes 24, 38–48.
40. Raben A, Tagliabue A & Astrup A (1995) The reproducibility of subjective appetite scores. Br J Nutr 73, 517–530.
41. Steyn K, Langenhoven ML, Joubert G, et al. (1990) The rela-tionship between dietary factors and serum cholesterol values in the coloured population of the Cape Peninsula. South African Med J 78, 63–67.
42. Schrauwen P, van Marken Lichtenbelt WD, Saris WHM, et al. (1997) Changes in fat oxidation in response to a high-fat diet. Am J Clin Nutr 66, 276–282.
43. Phinney SD (2004) Ketogenic diets and physical performance. Nutr Metab (Lond) 1, 2.
44. Soenen S, Martens EAP, Hochstenbach-Waelen A, et al. (2013) Normal protein intake is required for body weight loss and weight maintenance, and elevated protein intake for addi-tional preservation of resting energy expenditure and fat free mass. J Nutr 143, 591–596.
45. Pesta DH & Samuel VT (2014) A high-protein diet for reducing body fat: mechanisms and possible caveats. Nutr Metab (Lond) 11, 53.
46. Ebbeling CB, Swain JF, Feldman HA, et al. (2012) Effects of dietary composition on energy expenditure during weight-loss maintenance. JAMA 307, 2627–2634.
47. Kunz I, Schorr U, Römmling K, et al. (2002) Habitual fat intake and basal fat oxidation in obese and non-obese Caucasians. Int J Obes Relat Metab Disord 26, 150–156.
48. Thomas CD, Peters C, Reed GW, et al. (1992) Nutrient balance and energy expenditure during ad libitum feeding of high-fat and high-carbohydrate diets in humans. Am J Clin Nutr 55, 934–942.
49. Lecoultre V, Ravussin E & Redman LM (2011) The fall in leptin concentration is a major determinant of the metabolic adap-tation induced by caloric restriction independently of the changes in leptin circadian rhythms. J Clin Endocrinol Metab 96, E1512–E1516.
50. Kelesidis T, Kelesidis I, Chou S, et al. (2010) Narrative review: the role of leptin in human physiology: emerging clinical applications. Ann Intern Med 152, 93–101.
51. Mark AL (2013) Selective leptin resistance revisited. Am J Physiol Regul Integr Comp Physiol 305, R566–R581. 52. Simonds SE, Cowley MA & Enriori PJ (2012) Leptin increasing
sympathetic nerve outflow in obesity: a cure for obesity or a potential contributor to metabolic syndrome? Adipocyte 1, 177–181.
53. Kaiyala KJ, Morton GJ, Leroux BG, et al. (2010) Identification of body fat mass as a major determinant of metabolic rate in mice. Diabetes 59, 1657–1666.
54. Kaiyala KJ & Schwartz MW (2011) Toward a more complete (and less controversial) understanding of energy expenditure and its role in obesity pathogenesis. Diabetes 60, 17–23. 55. Bosy-Westphal A, Braun W, Schautz B, et al. (2013) Issues in
characterizing resting energy expenditure in obesity and after weight loss. Front Physiol 4, 47.
56. Pourhassan M, Bosy-Westphal A, Schautz B, et al. (2014) Impact of body composition during weight change on resting energy expenditure and homeostasis model assessment index in overweight nonsmoking adults. Am J Clin Nutr 99, 779–791.
57. Reed G & Hill J (1996) Measuring the thermic effect of food. Am J Clin Nutr 63, 164–169.
58. Heymsfield SB, Greenberg AS, Fujioka K, et al. (1999) Recombinant leptin for weight loss in obese and lean adults. JAMA 282, 1568.
59. Könner AC & Brüning JC (2012) Selective insulin and leptin resistance in metabolic disorders. Cell Metab 16, 144–152. 60. Zhang Y & Scarpace PJ (2006) The role of leptin in leptin
resistance and obesity. Physiol Behav 88, 249–256.
61. Caro JF, Kolaczynski JW, Nyce MR, et al. (1996) Decreased cerebrospinal-fluid/serum leptin ratio in obesity: a possible mechanism for leptin resistance. Lancet 348, 159–161. 62. Tschop M, Weyer C, Tataranni PA, et al. (2001) Circulating
ghrelin levels are decreased in human obesity. Diabetes 50, 707–709.
63. Knudsen SH, Karstoft K & Solomon TPJ (2014) Hyperglycemia abolishes meal-induced satiety by a dysregulation of ghrelin and peptide YY3-36 in healthy overweight/obese humans. Am J Physiol Endocrinol Metab 306, E225–E231.
64. Perez-Tilve D, Heppner K, Kirchner H, et al. (2011) Ghrelin-induced adiposity is independent of orexigenic effects. FASEB J 25, 2814–2822.
65. Rogers PJ (1999) Eating habits and appetite control: a psy-chobiological perspective. Proc Nutr Soc 58, 59–67. 66. Blundell JE & Finlayson G (2004) Is susceptibility to weight
gain characterized by homeostatic or hedonic risk factors for overconsumption? Physiol Behav 82, 21–25.