L
-Glutathione
Chemisorption on Gold and Acid/Base Induced
Structural
Changes: A PM-IRRAS and Time-Resolved in Situ ATR-IR
Spectroscopic
Study
Marco Bieri and Thomas Bu
¨ rgi*
Institut de Chimie, Faculté des Sciences, Université de Neuchâtel, Rue Emile-Argand 11, 2007 Neuchâ tel, Switzerland
Adsorption of the tripeptide L-glutathione (γ-glu-cys-gly) on gold surfaces was investigated by polarization modulation infrared reflection absorption spectroscopy (PM-IRRAS) and attenuated total reflection (ATR) infrared spectroscopy. PM-IRRAS was used to study ex situ the adsorbate layer prepared from aqueous solutions at different pH, whereas ATR-IR was applied to study in situ adsorption from ethanol in the presence and absence of acid and base. ATR-IR was furthermore combined with modulation spectroscopy in order to investigate the reversible changes within the adsorbate layer induced by acid and base stimuli, respectively. The molecule is firmly anchored on the gold surface via the thiol group of the cys part. However, the ATR-IR spectra in ethanol indicate a further interaction with the gold surface via the carboxylic acid group of the gly part of the molecule, which deprotonates upon adsorption. Hydrochloric acid readily protonates the two acid groups of the adsorbed molecule. During subsequent ethanol flow the acid groups deprotonate again, a process which proceeds in two distinct steps: a fast step associated with the deprotonation of the acid in the glu part of the molecule and a considerably slower step associated with deprotonation of the acid in the gly moiety. The latter process is assisted by the interaction of the corresponding acid group with the surface. The spectra furthermore indicate a rearrangement of the hydrogen bonding network within the adsorbate layer upon deprotonation. Depending on the protonation state during adsorption of L-glutathione, the response toward identical protonation-deprotonation stimuli is significantly different. This is explained by the ionic state-dependent shape of the molecule, as supported by density functional theory calculations. The different shapes of the individual molecules during layer formation thus influence the structure of the adsorbate layer.
Introduction
The formation of self-assembled monolayers (SAMs) of molecules on solid surfaces has extensively been studied in recent years.1In particular SAMs of thiol-containing molecules on gold and silver surfaces are important systems for understanding fundamental aspects of SAM formation.2These systems have interesting potential for applications in various surface-related technologies, for example in sensing of biomolecules.3,4An important case for applications related to biology are SAMs of cysteine (cysteamine) or cysteine-containing molecules.4-7
The present work deals withL-glutathione (γ-glu-cys-gly, GSH, Chart 1) adsorption on gold surfaces. GSH is a natural reducing molecule and ubiquitous. In fact, it is the most abundant nonprotein thiol in mammalian cells8 found in millimolar concentration. The molecule has a multitude of physiological functions,9 such as redox-buffering, detoxification, and antioxidant activity.
Fur-thermore, GSH is cheap, which makes it an attractive candidate for surface and electrode modification10-23and the synthesis of monolayer-protected nanoparticles.24-26 Glutathione-modified gold surfaces were for example used * To whom correspondence should be addressed. Telephone:
++41 32 718 24 12. Fax: ++41 32 718 25 11. E-mail: thomas.burgi@ unine.ch.
(1) Ulman, A. Chem. Rev. 1996, 96, 1533.
(2) Ostuni, E.; Yan, L.; Whitesides, G. M. Colloids Surf., B 1999, 15, 3.
(3) Cotton, C.; Glidle, A.; Beamson, G.; Cooper, G. Langmuir 1998, 14, 5139.
(4) Petoral, R. M.; Uvdal, K. Colloids Surf., B 2002, 25, 335. (5) Zhang, J.; Chi, Q.; Nielsen, J. U.; Friis, E. P.; Andersen, J. E. T.; Ulstrup, J. Langmuir 2000, 16, 7229.
(6) Felice, R. D.; Selloni, A.; Molinari, E. J. Phys. Chem. B 2003, 107, 1151.
(7) Ku¨ hnle, A.; Linderoth, T. R.; Hammer, B.; Besenbacher, F. Nature
2002, 415, 891.
(8) Bray, T. M.; Taylor, C. G. Can. J. Physiol. Pharmacol. 1993, 71, 746.
(9) Sies, H. Free Radical Biol. Med. 1999, 27, 916.
(10) Takehara, K.; Aihara, M.; Ueda, N. Electroanalysis 1994, 6, 1083. (11) McCormick, H.; McMillan, R.; Merrett, K.; Bensebaa, F.; Deslandes, Y.; Dube´, M. A.; Sheardown, H. Colloids Surf., B 2002, 26, 351.
(12) Damrongchai, N.; Yun, K.; Kobatake, E.; Aizawa, M. J. Bio-technol. 1997, 55, 125.
(13) Kanagaraja, S.; Alaeddine, S.; Eriksson, C.; Lausmaa, J.; Tengvall, P.; Wennerberg, A.; Nygren, H. J. Biomed. Mater. Res. 1999, 46, 582.
(14) Fang, C.; Zhou, X. Electroanalysis 2001, 13, 949.
Chart 1. Structure of l-Glutathione (γ-glu-cys-gly, GSH) and Some Different Possible Ionic Forms
for specific protein binding.12,13Copper(II) and lanthanide-(III) ions were found to bind strongly to glutathione-modified gold electrodes.20,22,23The affinity for the ions was assigned to the carboxylic acid groups and depended on pH.22On the basis of voltammetry and electrochemical quartz crystal microbalance (EQCM) investigations, it was furthermore proposed that during the redox process of Cu2+/Cu+the glutathione monolayer could rearrange.22 Electrochemical investigations of glutathine-modified gold electrodes revealed interesting “ion-gating” proper-ties.10,19Interaction of rare earth metal ions, transition metal ions, neurotransmitters, and a cationic drug with the glutathione monolayer leads to opening of ion gates in the glutathione film, as revealed by redox ion probes.19 On the basis of investigations using electrochemical quartz crystal microbalance (EQCM),19 it was proposed that interaction of metal ions with adsorbed glutathione leads to a conformational change of the latter. More specific information on the structure of and proposed conforma-tional changes within the glutathione layer on gold requires techniques that can provide structural insight. To date, such information is virtually missing for the glutathione-gold system.
In this contribution infrared vibrational spectroscopic techniques were applied to study glutathione layers and structural changes within these layers induced by admit-ting acid and base. Specifically we used polarization modulation infrared reflection absorption spectroscopy (PM-IRRAS)27to characterize the monolayers ex situ and attenuated total reflection (ATR-IR)28infrared spectros-copy as an in situ method. With the former we character-ized in ambient air glutathione layers that were adsorbed on gold surfaces from aqueous solutions at different pH. The latter method was used to study in situ glutathione adsorption on gold from ethanol solution in a flow-through cell.29The ATR-IR method has been shown to yield detailed structural information of even relatively complex mol-ecules on metal surfaces.30We have furthermore applied modulation excitation spectroscopy31,32in order to follow changes within the glutathione layer induced by periodi-cally admitting acid and base, respectively. Modulation excitation spectroscopy leads to enhanced signal-to-noise ratio32-34 and helps disentangling complex spectra of overlapping bands,35 a situation that is anticipated for such complex molecules as glutathione.
Experimental Section
Materials.L-Glutathione reduced (GSH, Sigma-Aldrich Inc., g98%) was used as received. As solvents served ethanol (Merck p.a.) and water (osmosed and distilled, aqua pure, Merck). Solutions were treated with nitrogen gas (99.995%, CarbaGas) to remove dissolved oxygen.
PM-IRRAS Analyses: Sample Preparation. A cover glass
for microscopy (Milian SA) with a size of 24 mm× 40 mm was used as a substrate. A thin gold layer with a thickness of about 100 nm was deposited on the substrate with a sputtering machine (Balzers Union SCD 030; sputtering rate, 0.5 Å/s). Before immersion in GSH solutions the Au surface of the PM-IRRAS sample was plasma-cleaned (PlasmaPrep2, GALA Instrumente) under a flow of air during 5 min. GSH solutions were prepared from distilled water, resulting in about pH 5. HCl (37% p.a., CARLO ERBA reagents) and NaOH pellets (p.a., CARLO ERBA reagents) were used to adjust the solution to about pH 1 and 12, respectively. The corresponding GSH concentrations in the solutions were 7 mM (neutral), 13 mM (basic) and 16 mM (acid). Adsorption from solutions of lower concentrations (by about 1 order of magnitude) led to the same PM-IRRAS spectra. After immersion in the solutions for 12 h the gold sample was rinsed thoroughly with a GSH-free solution of the same pH and dried by nitrogen gas. It has been reported previously that assembly of GSH on gold takes several hours.12Analogous experiments
were also performed with an Au(111) single crystal (15 mm× 1 mm, MaTeck). The latter was treated with piranha solution (H2SO4:H2O2(30%), 3:1) and rinsed with water immediately
before immersion in GSH solution. PM-IRRAS spectra obtained from the Au single crystal and the sputtered films were in good agreement.
Safety note: Piranha solution is extremely aggressive and should be handled with care!
PM-IRRAS Spectroscopy and Data Acquisition. The gold
sample was mounted on an attachment for PM-IRRAS measure-ments within the compartment of a Bruker PMA 50, connected to an external beam port of a Bruker tensor 27 Fourier transform infrared (FT-IR) spectrometer. After reflection at an angle of incidence of 80° the light was focused on a liquid nitrogen-cooled photovoltaic MCT detector in the PMA 50 cabinet. Polarization was modulated with a photoelastic modulator (Hinds, PEM 90) at a frequency of 50 kHz. Demodulation was performed with a lock-in amplifier (Stanford Research, SR830 DSP). All spectra were recorded during a sample scan time of 15 min at 4 cm-1
resolution. Resulting PM-IRRAS reflectance spectra were cal-culated with the bare gold substrate as the reference.
In Situ ATR-IR Analyses: Sample Preparation. A
dia-mond paste with a grain size of 0.25 µm was used to polish the Ge internal reflection element (IRE). After rinsing the IRE copiously with ethanol, the surface was plasma-cleaned during 5 min. A thin gold layer with a thickness of about 2 nm was then sputtered onto the IRE. For each experiment, a fresh gold layer was used. Control experiments without gold on the Ge IRE revealed no GSH adsorption, as indicated by the absence of significant bands in the course of several-hours exposure to GSH solution.
ATR-IR Spectroscopy and Data Acquisition. ATR-IR
infrared spectra were measured on a Bruker EQUINOX 55 FT-IR spectrometer with a nitrogen-cooled narrow-band MCT detector. A home-built liquid flow-through cell with a total volume of 0.077 mL and a gap of 250 µm between the IRE and the polished steel surface was used to record the ATR-IR spectra at a resolution of 4 cm-1. The flow-through cell can be heated or cooled, but all
measurements reported here were performed at room temper-ature. The ATR-IR cell is described in more detail elsewhere.29,32 Modulation Experiments. Ethanol served as solvent for
ATR-IR measurements. Before each experiment the solvent was saturated with nitrogen gas (CarbaGas, 99.995%) and was allowed to flow first over the IRE until no variation in the spectrum could be detected. The corresponding spectrum, recorded by co-adding 200 interferograms, served as the reference for all subsequent measurements. GSH at typical concentrations of about 0.35 mM was then introduced at a flow rate of 0.18
(15) Fang, C.; Zhou, X. Electroanalysis 2002, 14, 711. (16) Wang, J.; Gru¨ ndler, P. Electroanalysis 2003, 15, 1756. (17) Zhao, F.; Zeng, B.; Pang, D. Electroanalysis 2003, 15, 1060. (18) Zhou, A.; Xie, Q.; Wu, Y.; Cai, Y.; Nie, L.; Yao, S. J. Colloid Interface Sci. 2000, 229, 12.
(19) Hepel, M.; Tewksbury, E. J. Electroanal. Chem. 2003, 552, 291. (20) Zeng, B.; Ding, X.; Zhao, F. Electroanalysis 2002, 14, 651. (21) Wang, J.; Zeng, B.; Fang, C.; X., Z. Electroanalysis 2000, 12, 763.
(22) Fang, C.; Zhou, X. Electroanalysis 2003, 15, 1632.
(23) Aihara, M.; Tanaka, F.; Miyazaki, Y.; Takehara, K. Anal. Lett.
2002, 35, 759.
(24) Schaaff, T. G.; Knight, G.; Shafigullin, M. N.; Borkman, R. F.; Whetten, R. L. J. Phys. Chem. B 1998, 102, 10643.
(25) Schaaff, T. G.; Whetten, R. L. J. Phys. Chem. B 2000, 104, 2630. (26) Negishi, Y.; Takasugi, Y.; Sato, S.; Yao, H.; Kimura, K.; Tsukuda, T. J. Am. Chem. Soc. 2004, 126, 6518.
(27) Buffeteau, T.; Desbat, B.; Turlet, J. M. Appl. Spectrosc. 1991, 45, 380.
(28) Harrick, N. J. Internal Reflection Spectroscopy; Interscience: New York, 1967.
(29) Urakawa, A.; Wirz, R.; Bu¨rgi, T.; Baiker, A. J. Phys. Chem. B
2003, 107, 13061.
(30) Ferri, D.; Bu¨ rgi, T. J. Am. Chem. Soc. 2001, 123, 12074. (31) Baurecht, D.; Porth, I.; Fringeli, U. P. Vib. Spectrosc. 2002, 30, 85.
(32) Bu¨ rgi, T.; Baiker, A. J. Phys. Chem. B 2002, 106, 10649. (33) Wirz, R.; Bu¨ rgi, T.; Baiker, A. Langmuir 2003, 19, 785. (34) Bu¨ rgi, T.; Bieri, M. J. Phys. Chem. B 2004, 108, 13364.
(35) Muller, M.; Buchet, R.; Fringeli, U. P. J. Phys. Chem. 1996, 100, 10810.
mL/min, and the adsorption process was followed in situ. Note that at this concentration the signal contribution from the dissolved molecules is negligible. After about 4 h the static ATR-IR spectrum was recorded. Modulation was then started by periodically varying the “pH” by pumping alternately ethanol and a solution of HCl and NaOH, respectively, in ethanol over the sample (approximate concentrations are 0.013 mM for HCl and 0.18 mM for NaOH in ethanol). In the following we will refer to pH modulation for experiments where the concentration of acid and base was periodically changed in ethanol. The solutions were saturated with N2and stored in separate glass bubble tanks.
A typical modulation experiment consisted of two initial “dummy loops” to allow the system to reach a new quasi stationary state followed by averaging over six measurement loops. During one measurement period (loop, flow of ethanol followed by an equally long flow of HCl and NaOH, respectively, in ethanol) 60 infrared spectra were recorded at 80 kHz sampling rate using the rapid scan acquisition mode of the FT-IR spectrometer. For each spectrum several interferograms were averaged. By changing the number of interferograms per spectrum and loop (6, 10, 30, and 40) different modulation periods T ) 72.4, 120.7, 362.4, and 483.2 s could be achieved. Time-resolved infrared spectra were then demodulated by means of digital phase-sensitive detection (PSD) according to eq 1:
where k ) 1, 2, 3, ... determines the demodulation frequency, i.e., fundamental, first harmonic, and so on, ν˜ denotes the wave-number, ω is the stimulation frequency, T represents the modulation period, and φkPSDis the demodulation phase angle.
With a set of time-resolved spectra A(ν˜,t) eq 1 can be evaluated for different phase angles φkPSD, resulting in a series of phase
-resolved spectra AkφkPSD. A description in more detail of the
modulation technique applied here can be found elsewhere.32,36
Adsorption experiments described above were carried out with GSH in the three ionic forms, i.e., zwitterionic, cationic, and anionic. Subsequent pH modulation experiments were neutral-acidic and neutral-basic for the zwitterionic form, neutral-neutral-acidic for the cationic form, and neutral-basic for the anionic form.
DFT Calculations ofL-Glutathione. To better understand
the structure of the different ionic forms of GSH (zwitterionic, cationic, and anionic), we have performed density functional theory (DFT) calculations using the hybrid functional B3PW9137,38
with a 6-31G basis set.39 GAUSSIAN03 was used for all
calculations.40The conformational space of the molecule was
probed using a Born-Oppenheimer molecular dynamics (BOMD)41with a semiempirical method (AM1).42For every ionic
form five conformations with low energies were chosen as the starting geometries for structure optimization performed by DFT calculations. DFT calculations resulted generally in Y-shape
conformations for zwitterionic and cationic GSH and T-shape conformations for anionic GSH.
Results
GSH has four relevant possibilities for acid dissocia-tion.43The corresponding pK values are (determined at 25 °C and ionic strength of 0.2-0.55 M):442.05 (-COOH of glu), 3.40 (-COOH of gly), 8.72 (-SH), and 9.49 (-NH3+). Some possible ionic forms are shown in Chart 1. In ethanol solution the zwitterionic form (Chart 1, bottom left) prevails (see below).
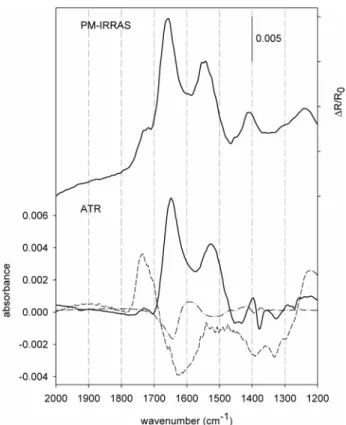
PM-IRRAS and ATR-IR spectra of zwitterionic GSH on Au together with demodulated spectra of two modulation experiments are displayed in Figure 1. The PM-IRRAS (Figure 1, top) and the ATR-IR spectrum (Figure 1, bottom, bold solid line) resemble each other surprisingly well, bearing in mind that measurement conditions and sample preparation are rather different (see Experimental Sec-tion). Strong bands are observed in the ATR-IR spectrum at 1649 and 1527 cm-1(1658 and 1547 cm-1for PM-IRRAS) and less intense signals at around 1397 and 1731 cm-1 (1410 and 1725 cm-1). The latter is less prominent in the ATR-IR spectrum. Demodulated (phase-resolved) spectra are depicted (at the same scale) as the dashed line for the (36) Baurecht, D.; Fringeli, U. P. Rev. Sci. Instrum. 2001, 72, 3782.
(37) Becke, A. D. J. Chem. Phys. 1993, 98, 5648.
(38) Perdew, J. P.; Chevary, J. A.; Vosko, S. H.; Jackson, K. A.; Pederson, M. R.; Singh, D. J.; Fiolhais, C. Phys. Rev. B 1992, 46, 6671. (39) Ditchfield, R.; Hehre, W. J.; Pople, J. A. J. Chem. Phys. 1971, 54, 724.
(40) Frisch, M. J.; Trucks, G. W.; Schlegel, H. B.; Scuseria, G. E.; Robb, M. A.; Cheeseman, J. R.; Montgomery, J. A.; Vreven, T.; Kudin, K. N.; Burant, J. C.; Millam, J. M.; Iyengar, S. S.; Tomasi, J.; Barone, V.; Mennucci, B.; Cossi, M.; Scalmani, G.; Rega, N.; Petersson, G. A.; Nakatsuji, H.; Hada, M.; Ehara, M.; Toyota, K.; Fukuda, R.; Hasegawa, J.; Ishida, M.; Nakajima, T.; Honda, Y.; Kitao, O.; Nakai, H.; Klene, M.; Li, X.; Knox, J. E.; Hratchian, H. P.; Cross, J. B.; Adamo, C.; Jaramillo, J.; Gomperts, R.; Stratmann, R. E.; Yazyev, O.; Austin, A. J.; Cammi, R.; Pomelli, C.; Ochterski, J. W.; Ayala, P. Y.; Morokuma, K.; Voth, G. A.; Salvador, P.; Dannenberg, J. J.; Zakrzewski, V. G.; Dapprich, S.; Daniels, A. D.; Strain, M. C.; Farkas, O.; Malick, D. K.; Rabuck, A. D.; Raghavachari, K.; Foresman, J. B.; Ortiz, J. V.; Cui, Q.; Baboul, A. G.; Clifford, S.; Cioslowski, J.; Stefanov, B. B.; Liu, G.; Liashenko, A.; Piskorz, P.; Komaromi, I.; Martin, R. L.; Fox, D. J.; Keith, T.; Al-Laham, M. A.; Peng, C. Y.; Nanayakkara, A.; Challacombe, M.; Gill, P. M. W.; Johnson, B.; Chen, W.; Wong, M. W.; Gonzalez, C.; Pople, J. A. GAUSSIAN03, Rev. B.05 ed.; Gaussian, Inc.: Wallingford, CT, 2003.
(41) Helgaker, T.; Eggerud, E.; Jensen, H. J. A. Chem. Phys. Lett.
1990, 173, 145.
(42) Dewar, M.; Thiel, W. J. Am. Chem. Soc. 1977, 99, 4499.
(43) Huckerby, T. N.; Tudor, A. J.; Dawber, J. G. J. Chem. Soc., Perkin Trans. 2 1985, 759.
(44) Rabenstein, D. L. J. Am. Chem. Soc. 1973, 95, 2797.
Ak φkPSD(ν˜) )2 T
∫
0 T A(ν˜,t) sin(kωt + φk PSD) dt (1)Figure 1. PM-IRRAS and ATR-IR spectra of zwitterionic GSH
adsorbed on Au from neutral solution (about pH 5). PM-IRRAS spectrum (top) was recorded after sample immersion in distilled water for 12 h. Ethanol solution was used for an adsorption process of GSH on a gold-coated Ge IRE. After about 4 h of adsorption the static ATR-IR spectrum was recorded (bold solid line, bottom). Demodulated, phase-resolved spectra for a neutral-acidic (dashed line) and a neutral-basic (point-dashed line) modulation experiment are presented at the same scale as the static spectrum. During the modulation experiment (T ) 483.2 s) acidic (basic) and neutral solutions were allowed to flow alternately over the GSH sample (flow rate ) 0.18 mL/ min) and 60 infrared spectra were recorded at 80 kHz sampling rate.
acidic and the point-dashed line for the neutral-basic modulation experiment. The demodulation phase angle φkPSD(eq 1) was chosen such that the amplitude
AkφkPSDwas at the maximum. Only bands that are periodi-cally changing with time due to the stimulation (pH modulation) show up in these spectra. The spectrum for the neutral-acidic experiment reveals strong positive bands at 1734 and 1230 cm-1 and a negative band of similar intensity at 1625 cm-1. Further less intense signals are observed at 1390 and 1330 cm-1. During the first half-period of the modulation experiment, ethanol was flowed over the sample and the signal at 1734 cm-1was observed to decrease simultaneously. At the beginning of the second half-period HCl in ethanol was introduced accompanied by a decrease of the band at 1625 cm-1and a simultaneous increase of the signal at 1734 cm-1. Thus, the two bands mentioned reveal amplitudes of different sign in the demodulated spectrum. Note that for demodulation angles φkPSDdiffering by 180° the resulting demodulated spectra
are identical but for the sign of all absorption bands. An in-flow of NaOH solution over the sample during the first half-period resulted in a rising of the band at around 1593 cm-1swhen switched to neutral solution, this signal became weaker, while the one around 1643 cm-1increased. In the static absorption spectrum (solid line) the signal at 1595 cm-1is hidden. Detection of overlapping or hidden bands is thus a useful attribute of phase-sensitive detec-tion. Furthermore phase-resolved spectra represent high-quality difference spectra. For the described pH modu-lation experiments the spectra reveal the difference between different ionic forms after adsorption of the molecule in the zwitterionic state. As can be seen from the amplitudes of these phase-resolved spectra, the intensity of the corresponding bands (1625 and 1725 cm-1) changes significantly with respect to the static signals. PM-IRRAS and ATR-IR spectra of GSH adsorbed in cationic form (from ethanol + HCl) are displayed in Figure 2. Again good agreement between the two spectra is apparent. Compared to the spectrum of zwitterionic GSH depicted in Figure 1, the signal above 1700 cm-1is clearly more pronounced. On the other hand in the cationic case the band at about 1650 cm-1is less pronounced compared to the one at 1535 cm-1. The demodulated spectrum of the neutral-acidic modulation experiment (dashed line) reveals a positive signal at 1735 cm-1and a negative one around 1620 cm-1 which is not visible in the static spectrum. Note that the demodulated spectrum is assigned its own ordinate on the right side (absorbance PSD, phase sensitive detection). The modulation experiment (neutral-acidic) was performed in a way analogous to the one described for GSH adsorbed in zwitterionic form. However, the amplitude of the bands relative to the static spectrum is about four times smaller compared to the analogous experiment with the GSH layer adsorbed in zwitterionic form (from ethanol).
PM-IRRAS and ATR-IR spectra of GSH adsorbed in anionic form are depicted in Figure 3. Both spectra reveal bands around 1600 cm-1(1595 cm-1in ATR-IR and 1608 cm-1in PM-IRRAS) and about 1400 cm-1(1404 and 1408 cm-1). Signals at 1643 and 1542 cm-1 in the ATR-IR spectrum are less pronounced and appear as a shoulder on the prominent band at 1595 cm-1. The modulation experiment neutral-basic (dashed line) bears again some resemblance to the corresponding experiment described for GSH adsorbed in zwitterionic form (Figure 1) but also exhibits significant differences in the 1650 and 1400 cm-1 spectral regions. The small amplitudes with respect to the static adsorption spectrum (note the ordinate on the
right side) are a further difference with respect to the analogous experiment for the zwitterionic GSH.
All the described modulation experiments reveal that (at least partial) interconversion between ionic forms is a reversible process regardless of the ionic form GSH was adsorbed on Au. Reversibility further holds for different modulation periods applied; i.e., T ) 72.4, 120.7, 362.4, and 483.2 s. We should also mention that the signals were well-reproducible in consecutive modulation experiments and experiments performed on different samples on different days.
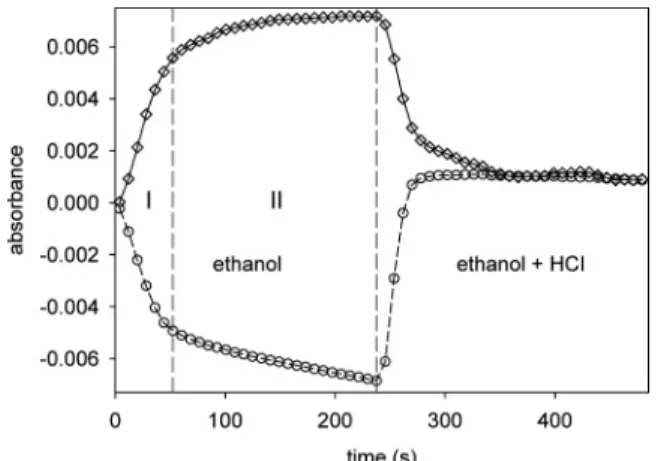
The time dependence of the ATR-IR signals at 1650 cm-1(upper curve) and 1725 cm-1(lower curve) within a modulation period of the neutral-acidic stimulation experiment is depicted in Figure 4. GSH was adsorbed in zwitterionic form. The experiment reveals two regimes with different deprotonation kinetics. The first regime (I) is a fast process starting at t ) 0 when ethanol replaces the acidic solution. After around 50 s a slower process is observed with a linear decrease with time of the intensity at 1725 cm-1. This slow process is not completed at the end of the first half-period (at t ) 241.6 s) of the modulation experiment.
Difference spectra for the two regimes described above are depicted in Figure 5. The solid line is the difference between spectra no. 7 (t ) 50 s) and no. 1 (t ) 0 s) of regime I, and the dashed line is the difference between spectra no. 30 (t ) T/2 ) 241.6 s) and no. 7 (t ) 50 s) of regime II. The difference spectra of the two regions are signifi-cantly different. It appears that in the difference spectrum of regime II the positive signal between 1500 and 1600
Figure 2. PM-IRRAS and ATR-IR spectra of cationic GSH
adsorbed on Au from acidic solution (about pH 1). The PM-IRRAS spectrum (top) was recorded after 12 h of sample immersion in acidic distilled water. The ATR-IR spectrum (bold solid line, bottom) was recorded after about 4 h of adsorption from ethanol + HCl solution. A demodulated, phase-resolved spectrum (dashed line) is presented together with the static spectrum. The corresponding modulation experiment (T ) 483.2 s) consisted of an alternate flow of neutral and acidic solutions (flow rate ) 0.18 mL/min) over the cationic GSH sample. Note that the demodulated spectrum has a different ordinate (absorbance PSD).
cm-1becomes more prominent with respect to regime I. In this spectral region, at 1527 cm-1precisely, there is a prominent band in the static ATR-IR spectrum (see Figure 1). The positive signals at about 1400 and 1330 cm-1have different relative intensity in the difference spectra of the two regimes. Furthermore, in regime I the relative intensity of the 1220 cm-1with respect to the 1735 cm-1 band is much larger than in regime II.
Discussion
General Discussion. PM-IRRAS and in situ ATR-IR
spectra of GSH on Au are in surprisingly good agreement with each other for the corresponding adsorption condition, i.e., for neutral, acidic, and basic solution (see Figures 1-3). Besides the two measurement techniques applied, sample preparation differed considerably by the use of substrate, solvent (water for PM-IRRAS and ethanol for ATR-IR measurements), and sample immersion time (4 h for ATR-IR and 12 h for PM-IRRAS) as well as measurement conditions (in air for PM-IRRAS and liquid phase for ATR-IR). In this respect it is important to note that the selection rule for ATR-IR spectroscopy on metal films45,46was found to be the same as the well-established selection rule for external reflection off metal surfaces.47 Upon careful inspection differences between PM-IRRAS and ATR-IR spectra are, however, observable, which may be due to different ionic states and/or different interactions within the chemisorbed layer under the vastly different measurement conditions.
The reversible switching between the different ionic forms of GSH adsorbed on Au stimulated by periodic admission of acid and base, respectively, made it possible to follow the induced spectral changes using in situ ATR-IR combined with modulation spectroscopy. When identi-cal modulation experiments were performed with GSH layers prepared by adsorption of different ionic forms of GSH (in the absence and presence of HCl and NaOH, respectively), the resulting spectra were similar. Careful inspection of these spectra, however, revealed some spectral differences. Furthermore, the relative size of the static and modulated signal differed significantly, de-pending on adsorption condition; i.e., the intensity which changed due to the pH modulation was much less in case in which GSH was adsorbed in cationic and anionic form, respectively (see Figures 1-3). This could be due to a smaller fraction of adsorbed molecules that are reversibly protonated-deprotonated, or due to slower protonation-deprotonation kinetics. In the pH modulation experiments (45) Osawa, M.; Ataka, K.-I.; Yoshii, K.; Yotsuyanagi, T. J. Electron. Spectrosc. Relat. Phenom. 1993, 64/65, 371.
(46) Hutter, E.; Assiongbon, K. A.; Fendler, J. H.; Roy, D. J. Phys. Chem. B 2003, 107, 7812.
(47) Greenler, R. G. J. Chem. Phys. 1966, 44, 310.
Figure 3. PM-IRRAS and ATR-IR spectra of anionic GSH on
Au adsorbed from basic solution (about pH 12). After 12 h of sample immersion the PM-IRRAS spectrum (top) was recorded. The ATR-IR spectrum (bold solid line, bottom) was recorded after 4 h of adsorption. A demodulated, phase-resolved spectrum (dashed line) is presented together with the static adsorption spectrum. During the corresponding modulation experiment (T ) 483.2 s) neutral and basic solutions were allowed to flow alternately over the anionic GSH sample at a flow rate of 0.18 mL/min. The ordinate on the right side (absorbance PSD) refers to the phase-resolved spectrum.
Figure 4. Absorbance of signals at 1650 (upper curve) and
1725 cm-1(lower curve) as a function of time for a modulation experiment (T ) 483.2 s). GSH was adsorbed on a gold-coated Ge IRE in zwitterionic form from ethanol solution. An alternate flow of ethanol, followed by a flow of ethanol + HCl of equal time was admitted to the GSH sample during a modulation experiment. The time dependence of the two signals reveals two regimes with different deprotonation kinetics.
Figure 5. Difference spectra representing changes within the
two regimes with different deprotonation kinetics (see text for details). Both spectra are calculated for the first half-period of a modulation experiment when ethanol was flowed over the zwitterionic GSH sample, after a flow of HCl in ethanol. The difference between spectra no. 7 (t ) 50 s) and no. 1 (t ) 0 s) in Figure 4 is depicted as a solid line for regime I and as a dashed line for regime II, corresponding to the difference between spectra no. 30 (t ) T/2) and no. 7.
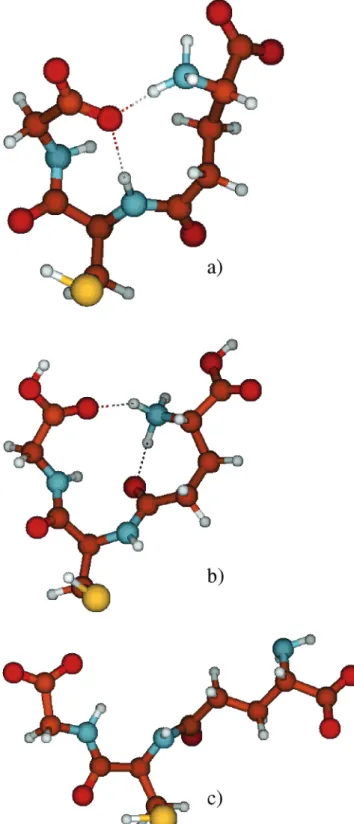
(dashed and point-dashed spectra in Figures 1-3) the corresponding stimulation was identical. Still the system response was different, depending on the ionic state of GSH during initial adsorption. In the modulation experi-ments only the reversibly changing species are observed. If adsorption of zwitterionic GSH and subsequent pro-tonation of this layer by flowing dissolved HCl would lead to a layer that is completely identical to the one formed from direct adsorption of protonated (cationic) GSH and visa versa, then protonation-deprotonation modulation experiments (HCl in ethanol versus ethanol) would result in identical spectra, independent of the initial state of adsorption. The experiments show that this is not the case. We conclude that adsorption of GSH in the corre-sponding ionic form leads to adsorbate layers, which cannot be interconverted into completely identical layers to one other by simply changing the ionic form of the adsorbate. The system “remembers” adsorption conditions. The DFT calculations performed for different ionic forms of GSH resulted in characteristic shapes, i.e., a Y-shape for zwitterionic and cationic and a T-shape for the anionic form (see Figure 6). These shapes were found to be a general feature for the corresponding ionic form, regardless of the fact that several structures with similar energy were located for each form. It is likely that the shape of the molecule during the adsorption process is decisive for the structure of the resulting adsorbate layer. This may thus explain the observation that the system remembers the adsorption conditions as evidenced by the pH modu-lation experiments.
A more detailed analysis of the infrared spectra and of the in situ ATR-IR spectra in particular, allows to extract more molecular level information. However, this requires assignment of the vibrational bands, which is presented in the next section.
Assignment of Vibrational Bands. Prominent bands
for adsorbed glutathione are associated with the acid, carboxylate, amide, and ammonium functional groups. The following assignment is based on literature data on amino acids and peptides48-51 and quantum chemical calculations as well as the modulation experiments. The observed band positions for the different experiments and the corresponding assignment are summarized in Table 1.
The carboxylic acid vibrations ν(-COOH) are easily spotted as a band above 1700 cm-1. In the PM-IRRAS spectrum the band is found at 1741 cm-1for GSH adsorbed from acidic solution (Figure 2) and at about 1725 cm-1for GSH adsorbed from neutral solution (Figure 1). The latter value corresponds well with reported spectra of GSH in H2O and D2O.51In the corresponding ATR-IR experiments the bands are found at 1736 and 1731 cm-1, respectively. The frequency shift of the band associated with the ν(-COOH) vibrations observed in both types of experi-ments (ATR-IR and PM-IRRAS) may be due to different interactions of these groups under different conditions and/or different extents of dissociation of the two acid groups. The band shifts to lower wavenumbers as part of the acid groups are dissociated. Under such conditions the ν(-COOH) vibration of the weaker acid is observed predominantly. This is in full agreement with the calcu-lated infrared spectra of protonated GSH, which consis-tently yield lower frequencies of ν(-COOH) for the gly
part of the molecule in all conformations found. The frequency difference of ν(COOH) associated with the two carboxylic acid groups is caused by the nearby NH3+group in the glu part. It is known that local electric fields (local environment) can affect the frequency of the ν(-COOH) vibration.49,50The band associated with the two ν(-COOH) vibrations has asymmetric shape and exhibits (at least) two components. This is seen best in the demodulated spectra of the modulation experiment, where alternately (48) Pearson, J. F.; Slifkin, M. A. Spectrochim. Acta 1972, 28A, 2408.
(49) Wright, W. W.; Vanderkooi, J. M. Biospectroscopy 1997, 3, 458. (50) Dioumaev, A. K.; Braiman, M. S. J. Am. Chem. Soc. 1995, 117, 10572.
(51) Picquart, M.; Grajcar, L.; Baron, M. H.; Abedinzadeh, Z. Biospectroscopy 1999, 5, 328.
Figure 6. Pictorial representations of optimized structures of
GSH as found by density functional theory calculations (see text for details): (a) Y-shaped structure of GSH zwitterionic; (b) Y-shaped structure of GSH cationic; (c) T-shaped structure of GSH anionic.
ethanol and ethanol + HCl was flowed over the sample (Figures 1 and 2). In the PM-IRRAS and the static ATR-IR spectra of the protonated species (Figure 2) the two components are difficult to distinguish, due to the lower quality of the static spectra.
A feature arising together with the ν(-COOH) band is the broad intense signal at about 1230-1250 cm-1. We assign this band to a C-O-H bending mode with possibly some C-O stretching character.48This band disappears in deuterated amino acids,48and its broadness furthermore supports the assignment. The calculations for the pro-tonated GSH predict a very intense C-O-H band at somewhat lower energy. Alternatively, amide III vibra-tions fall in this spectral region. However, these vibravibra-tions are usually considerably weaker than the amide I vibra-tions,52which is also confirmed by the calculations.
The most prominent bands of GSH adsorbed from neutral or acidic solution both in the PM-IRRAS and in the ATR-IR experiments around 1660 and 1540 cm-1are mostly due to amide I and amide II vibrations, respectively. The band maxima shift slightly upon changing conditions. For example in the ATR-IR the amide II band shifts from 1527 cm-1in the spectrum of GSH adsorbed from ethanol to 1537 cm-1 in the spectrum of GSH adsorbed from ethanol + HCl. The observed band shifts are due to different interactions (intra- or intermolecular) of the amide groups and possibly overlap with -COO- and -NH3+vibrations.
In the deprotonated state the carboxylic acid groups give rise to asymmetric and symmetric stretching vibra-tions expected at 1550-1620 cm-1 (νas(-COO-)) and 1300-1420 cm-1(ν
s(-COO-)), respectively.49,52The former bands are prone to overlap with amide and -NH3+ vibrations. The static ATR-IR spectrum of GSH adsorbed on Au from ethanol (Figure 1) is dominated by the amide bands at 1649 and 1527 cm-1. Between these bands there is considerable intensity. A qualitatively similar situation is found for the PM-IRRAS experiment (Figure 1, top) of GSH adsorbed from neutral aqueous solution. In the ATR-IR and PM-ATR-IRRAS spectra of protonated GSH (Figure 2) the intensity between the amide I and amide II bands is much weaker and in the corresponding spectra of depro-tonated GSH (Figure 3) much stronger. The νas(-COO-) signals are therefore found between the prominent amide I and amide II bands. The demodulated spectra of protonation-deprotonation experiments (Figures 1, 2, and 5) allow a more precise assignment of the νas(-COO-) vibrations to an asymmetric band with maximum at 1620 cm-1and a shoulder at 1575 cm-1. With respect to the νs(-COO-) modes, there is a band around 1410 cm-1in the static ATR-IR and PM-IRRAS spectra. This band is most prominent in the ATR-IR spectrum (at 1404 cm-1) of GSH that was adsorbed from ethanol + NaOH solution and can therefore be assigned to νs(-COO-) vibrations. However, the ATR-IR and PM-IRRAS spectra in Figure 2 exhibit some intensity around 1420 cm-1, even when the acid groups are protonated, which can be assigned to CH2scissoring modes. In the phase-resolved spectra of the protonation-deprotonation modulation experiments (Figures 1, 2, and 5) there are clear bands at 1390 and 1330 cm-1. The former is due to a ν
s(-COO-) vibration, whereas the latter can be assigned to CH2 wagging modes.48In the calculations the CH
2 vibrations in this frequency range loose and gain intensity, respectively, upon protonation and deprotonation, respectively, of the acid groups.
(52) Bellamy, L. J. The Infrared Spectra of Complex Molecules; Chapman and Hall-Wiley: London-New York, 1975.
Table 1. Observed Vibrational Bands in the Static and Phase-resolved Spectra Depicted in Figures 1-3 and 5 and Corresponding Assignment. pH Modulati on Experiments (Neutral -Acidic and Neutral -Basic) Were Performed for Layers that Were Prepared from Zwitterionic, Cationic and Anionic GSH static signals ATR-IR phase-resolved signals GSH zwitterionic GSH cationic GSH anionic GSH zwitterionic PM-IRRAS ATR-IR PM-IRRAS ATR-IR PM-IRRAS ATR-IR assignment neutral -acidic neutral -basic GSH cationic neutral -acidic GSH anionic neutral-basic assignment 1725 1731 1741 1736 ν ( -COOH) 1734 1735 ν ( -COOH) 1658 1649 1660 1662 1653 1643 amide I 1625 1620 νas ( -COO -) 1608 1595 νas ( -COO -) 1575 1575 νas ( -COO -) 1547 1527 1543 1537 1550 1542 amide II 1390 1380 νs ( -COO -) 1420 1410 δs ( -CH 2 ) scissoring 1330 1330 Fw ( -CH 2 ) wagging 1410 1397 1408 1404 νs ( -COO -) 1230 -1250 1230 δ ( -COH) bending + ν (CO) stretching 1230 1230 1230 δ ( -COH) bending + ν (CO) stretching 1655 amide I 1643 shift of νas ( -COO -) 1632 νas ( -COO -), amide I 1593 shift of νas ( -COO -) 1578 νas ( -COO -) 1520 1490 δs ( -NH 3 +) 1410 νs ( -COO -) 1300
Signals due to the -NH3+group are expected around 1600 cm-1for the weak deformation vibration (δas(-NH3+)) and for the stronger symmetric deformation at 1500-1550 cm-1 (δ
s(-NH3+)).48Assignment of these bands is hampered by their generally low intensity and overlap with stronger bands. The best indications for these bands stem from the modulation experiments where the adsorbed GSH was alternately exposed to ethanol and ethanol + NaOH, which is expected to cause interconversion between -NH3+and NH2groups. Demodulated spectra for such experiments are shown in Figures 1 and 3 for GSH adsorbed from ethanol and ethanol + NaOH, respectively. In these spectra there is a broad relatively weak band visible around 1520 cm-1(negative in Figure 1), which can be assigned to the symmetric -NH3+ deformation δs(-NH3+). This band is negative in Figure 1 because the -NH3+group is deprotonated upon admission of NaOH, resulting in NH2. The latter group should exhibit a scissoring mode around 1590-1650 cm-1,52 which may however be too weak to be observed.48Indeed a broad band at about 1590 cm-1arises upon deprotonation of the -NH3+ group (Figures 1 and 3). However, we prefer another assignment of this band: Upon deprotonation of the -NH3+group the prominent νas(COO-) mode of the close COO-- group is expected to shift considerably to lower wavenumbers due to the loss of electron with-drawal.48,52,53Therefore the negative and positive bands, respectively, at 1643 and 1590 cm-1, respectively, in Figure 1 are assigned to a frequency shift of νas(COO-) to lower wavenumbers upon deprotonation of the -NH3+group. A frequency shift or change in intensity of the amide I band possibly also contributes to this feature in the demodulated spectra.
GSH on Au Adsorbed from Ethanol. In the in situ
ATR-IR spectrum of GSH adsorbed on Au from ethanol (Figure 1) the ν(COOH) vibration at 1731 cm-1has very low intensity. In ethanol carboxylic acids are not dissoci-ated in the absence of a base. Hence, in ethanol GSH exists in zwitterionic form, with deprotonated acid (COO-) and protonated amine (-NH3+) group on the glu part and an acid group (COOH) on the gly part of the molecule (Chart 1, bottom left). The presence of a strong ν(COOH) signal was also confirmed for GSH dissolved in ethanol-d6 (Supporting Information). Unless there are further in-teractions to be considered, dissociation of the acid is not expected upon adsorption through the thiol group of the molecule. For example, the adsorption of 3-mercaptopro-pionic acid from ethanol on Au films, as investigated by in situ surface-enhanced infrared absorption spectroscopy, revealed a ν(COOH) band above 1700 cm-1.54Carboxylate vibrations were not observed, thus showing that the carboxylic acid group of the adsorbed molecule is fully protonated in ethanol.54The very low intensity of the band at 1731 cm-1in Figure 1 associated with carboxylic acid groups is therefore surprising. This could be explained by the presence of a highly ordered GSH layer bearing acid groups with the CdO bond oriented almost perfectly parallel to the Au surface. This would result in a dynamic dipole moment associated with this vibration parallel to the surface and, according to the metal surface selection rule,55in very weak intensity. We consider this as unlikely. We suggest that a large fraction of GSH molecules is also deprotonated at the gly moiety upon adsorption, which strongly indicates interaction of the latter acid group with the Au surface. Interaction of acid groups with gold
surfaces has been reported before. For the adsorption of thioctic acid on Au from ethanol a mixture of carboxyl and carboxylate was found by ex situ reflection absorption infrared spectroscopy.56 This work also showed that thioctic acid adsorption from ethanol leads to disordered adsorbate layers.
Adsorption of molecules containing both thiol and carboxylic acid functional groups on Au is determined by the former.54,56Whether the latter can also interact with the Au surface depends on the distance between the two functional groups and the flexibility of the molecule. For GSH there are six single bonds between the thiol and acid group of the gly part, which guarantees high flexibility and thus allows the acid group to interact with the Au surface.
The periodic admission of ethanol and HCl in ethanol to the GSH adsorbed from ethanol (demodulated spectra in Figure 1, bottom) leads to significant and reversible changes induced by protonation-deprotonation. The plot of the intensity of the ν(COOH) vibration as a function of time within the modulation experiment in Figure 4 shows that protonation is fast. On the other hand, deprotonation clearly proceeds in two steps, a fast (regime I) and a considerably slower one (regime II). Within about 200 s the second deprotonation process is not completed. Figure 5 reveals significantly different spectral changes within the two regimes. From a chemical point of view the stronger carboxylic acid on the glu part is expected to deprotonate first. This is supported by two observations: Figure 5 shows that the ν(COOH) signal has a more pronounced intensity at higher wavenumbers for the faster deprotonation (regime I), as expected for the glu part of the molecule. Similarly, the appearing asymmetric car-boxylate vibration νas(COO-) is found at higher wave-number for the faster deprotonation, again indicating that the latter is associated with the glu part of the molecule.49 It is furthermore apparent from Figure 5 that the relative intensity of the bands at 1735 and 1230 cm-1is different for the two regimes. Both vibrations are associated with the acid groups (ν(COOH) and δ(COH)). The two vibrations usually exhibit different directions of the dynamic dipole moment. Their different relative intensity in the two regimes thus indicates that in the protonated state the two acid groups adopt significantly different orientation with respect to the surface.
On the basis of the observations made for the modulation experiments just discussed, and the nature of GSH on Au when adsorbed from ethanol as discussed above, we can propose the following processes during the modulation experiment: Upon admitting HCl the carboxylic acid groups are both protonated fast. For the gly part of the molecule this means that the interaction between the carboxylate and the surface is lost upon protonation. The DFT calculations show that for the protonated case the molecule tends to adopt a Y shape, stabilized by intra-molecular hydrogen bonding between the two arms of the molecule. Upon flowing again ethanol the acid group of the glu part is deprotonated first. In a slower step the second carboxylic acid group is deprotonated upon re-adsorption on the surface. This view is further supported by the observation that a considerably more intense νs(COO-) mode at 1390 cm-1is observed for the slower regime. A strong νs(COO-) mode is usually observed for carboxylate groups adsorbed on metal surfaces.57Another
(53) Roddick-Lanzilotta, A. D.; McQuillan, A. J. J. Colloid Interface Sci. 1999, 217, 194.
(54) Imae, T.; Torii, H. J. Phys. Chem. B 2000, 104, 9218. (55) Francis, S. A.; Ellison, A. H. J. Opt. Soc. Am. 1959, 49, 131.
(56) Willey, T. M.; Vance, A. L.; Bostedt, C.; vanBuuren, T.; Meulenberg, R. W.; Terminello, L. J.; Fadley, C. S. Langmuir 2004, 20, 4939.
(57) Ortega Lorenzo, M.; Haq, S.; Bertrams, T.; Murray, P.; Raval, R.; Baddeley, C. J. J. Phys. Chem. B 1999, 103, 10661.
difference between the spectra of the two regimes (Figure 5) is the presence (absence) of a CH2band at 1330 cm-1 for the faster (slower) regime, which may be due to a reorientation of the molecule upon deprotonation. A rearrangement induced by the deprotonation is also indicated by the N-H and O-H stretching vibrations. Figure 7 shows overview difference spectra for the two deprotonation regimes. Prominent broad bands are ob-served at 2500 and 2800 cm-1(negative) and 3200 and 3400 cm-1(positive). The 2500 cm-1band is characteristic for N+-H groups involved as donor in hydrogen
bond-ing.58,59 The band at 2800 cm-1may be due to an acid group involved as donor in a hydrogen bond. On the other hand the broad bands above 3000 cm-1fall in the typical range of amide A (N-H stretching vibration) and amide B band (Fermi resonance-enhanced overtone of the amide II band).60,61The appearance of these bands clearly shows that the hydrogen-bonding network within the adsorbate layer changes considerably upon protonation-deproto-nation. On the basis of the (gas-phase) calculations a rearrangement of the hydrogen bonding interactions upon changing the ionic state of the molecule is not surprising (Figure 6). These calculations only consider an isolated molecule. Intermolecular hydrogen-bonding interactions between adjacent molecules in the adsorbate layer are also feasible and were evidenced for other thiols bearing amide groups.60-63The exact structure of the hydrogen-bonded network within the GSH layer and whether the hydrogen bonding is intra- and/or intermolecular remain open at the present stage.
GSH Adsorbed from Ethanol + HCl. When adsorbing
GSH in the presence of HCl, i.e., in the protonated form, the amplitude of the response in the modulation experi-ments (ethanol-(ethanol + HCl)) is comparably weak (Figure 2). A considerable fraction of acid groups are not deprotonated within half the modulation period upon flowing ethanol, in contrast to the behavior of the layer when adsorbed from ethanol. Since deprotonation of part of the carboxylic acid groups is assisted by interaction with the Au surface, as discussed above, this observation indicates that interaction between acid groups and the Au surface is inhibited or put in other words that the deprotonation is displaced to lower pH for a GSH layer adsorbed from ethanol + HCl. The DFT calculations show that for the protonated case the molecule adopts a Y shape. Within a densely packed layer of Y-shaped molecules there may not be enough free space available for the acid group
Figure 7. Difference spectra (overview) representing changes
within the two regimes with different deprotonation kinetics (see text for details). Both spectra are calculated for the first half-period of a modulation experiment when ethanol was flowed over the zwitterionic GSH sample, after a flow of HCl in ethanol. The difference spectrum represents the changes between t ) 50 and 0 s (bottom) and t ) T/2 ) 241.3 s and t ) 50 s (top). The top spectrum was scaled in order to have comparable intensity. The asterisk indicates uncompensated absorption from atmospheric CO2.
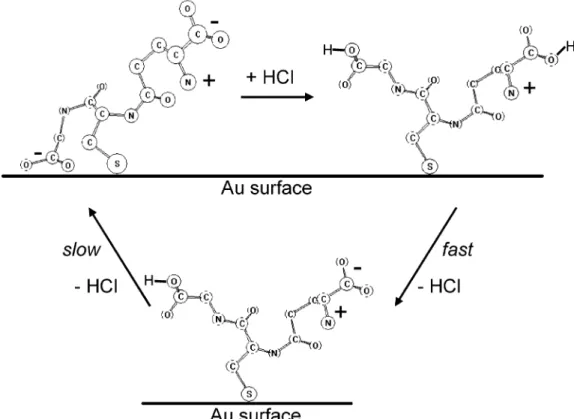
Figure 8. Pictorial representation of the processes occurring during protonation and deprotonation ofL-glutathione on gold. The
deprotonation in ethanol proceeds in two steps with distinctly different kinetics. The slow deprotonation of the carboxylic acid of the gly moiety is accompanied by adsorption of the carboxylate on the gold surface. During protonation-deprotonation a considerable rearrangement of the hydrogen-bonding network (inter- and/or intramolecular) takes place.
to interact with the Au surface and deprotonate. Com-parison between the demodulated spectra for the ethanol-(ethanol + HCl) modulation experiments for the two layers, adsorbed from ethanol (Figure 1) and adsorbed from ethanol + HCl (Figure 2) show considerable simi-larities but also significant differences. One important difference in these spectra supporting the above view is a considerably broader and more intense νs(COO-) mode at 1390 cm-1for the layer adsorbed from ethanol. Also the intensity of the 1230 cm-1band relative to the one at 1735 cm-1is larger for the layer formed from protonated GSH. On the basis of the discussion above (Figure 5) this indicates that the gly part of GSH does not strongly respond to the protonation-deprotonation stimulation for the layer adsorbed from ethanol + HCl. Another significant difference is the region around 1660 cm-1. Whereas for the layer adsorbed from ethanol + HCl there is no strong signal in this spectral region (plateau between the positive 1735 cm-1and the negative 1620 cm-1band), a signal can be observed for the layer adsorbed from ethanol. This spectral region is associated with the amide I bands. The different response of this spectral region for the two layers thus indicates different reorientation of GSH upon ap-plying identical stimulation (protonation-deprotonation). Figure 8 schematically summarizes the interpretation based on the ATR-IR spectra and pH modulation experi-ments discussed above.
Conclusions
In situ ATR-IR combined with modulation excitation spectroscopy turned out to be a powerful combination for the investigation of reversible changes withinL-glutatione layers on gold induced by protonation-deprotonation stimuli. The results show that the ionic state during
adsorption influences the structure of the adsorbate layer. Whereas the adsorbed molecules can be protonated and deprotonated, respectively, by admitting acid and base, respectively, in ethanol, the response toward periodic protonation-deprotonation depends both qualitatively and quantitatively on the ionic state during adsorption. This is rationalized, supported by DFT calculations, by the different molecular shape of the different ionic forms. WhenL-glutathione is adsorbed from ethanol, the spectra indicate a second anchoring apart from the strong the thiol-gold linkage, via the acid function of the gly part of the molecule. The latter is deprotonated upon interaction with the gold surface. The in situ ATR-IR experiments furthermore indicate a reorientation of the molecule upon protonation-deprotonation and a concomitant rearrange-ment of the hydrogen-bonding network within the ad-sorbed layer. These findings bear some similarity with electrochemical investigations ofL-glutathione-modified electrodes exposed to metal ions.10,19On the basis of such investigations it was proposed that in the absence of ions in water the molecule forms a T shape with the two arms (glu and gly parts) of glutathione far apart from each other. In this conformation access of redox ion probes to the electrode surface is inhibited. In the presence of a metal ion the carboxylate groups of the two arms interact with the metal ion and hence form a Y shape with the two arms of the molecule approaching each other. This opens up the electrode surface and thus allows redox reactions to occur. Our findings support the idea thatL-glutathione on gold exhibits structural changes addressable by external stimuli like pH or ion concentration.
Acknowledgment. Financial support from the Swiss
National Science Foundation and the grants of computer time from the Swiss National Supercomputing Centre (CSCS) Manno are gratefully acknowledged. Use of sputtering facilities at the Swiss Center for Electronics and Microtechnology in Neuchaˆtel (CSEM) is kindly acknowledged.
Supporting Information Available: Transmission infrared spectrum ofL-glutathione in ethanol-d6(spectral region
around 1700 cm-1). This material is available free of charge via
the Internet at http://pubs.acs.org.
(58) Bonalumi, N.; Bu¨ rgi, T.; Baiker, A. J. Am. Chem. Soc. 2003, 125, 13342.
(59) Matsuda, Y.; Ebata, T.; Mikami, N. J. Chem. Phys. 1999, 110, 8397.
(60) Templeton, A. C.; Chen, S.; Gross, S. M.; Murray, R. W. Langmuir
1999, 15, 66.
(61) Sabapathy, R. C.; Bhattacharyya, S.; Leavy, M. C.; Cleland, W. E.; Hussey, C. L. Langmuir 1998, 14, 124.
(62) Clegg, R. S.; Reed, S. M.; Hutchinson, J. E. J. Am. Chem. Soc.
1998, 120, 2486.