Copyright O i m . AU righti raerKd Piiutod in Grest Britain 00O3-4S7S/96 J 15.00+0.00
0003-4878(95)00075-5 s
AIRBORNE EXPOSURE TO POLYCYCLIC AROMATIC
HYDROCARBONS (PAHs) AND URINARY EXCRETION OF
1-HYDROXYPYRENE OF CARBON ANODE PLANT
WORKERS
Thomas Petry,* Peter Schmid and Christian Schlatter
[Institute of Toxicology, Swiss Federal Institute of Technology (ETHJ[ Zurich! and University of Zurich, Schorenstrasse 16, CH-8603 Schwerzenbach/Switzerlanm
(Received lf> May 1995)
Abstract—(Workers in plants producing carbon anodes for aluminium electrolysis are exposed to PAHs containing coal tar pitch volatiles, pitch and coke. The aim of this study was to evaluate the suitability of urinary 1-hydroxypyrene to characterize respiratory exposure to PAH, which is most relevant for assessing individual health risks. Six workers in a carbon anode plant volunteered to take part in a personal air sampling and a biological monitoring programme lasting five consecutive 8-h shifts to determine occupational exposure to airborne PAHs and urinary excretion of 1-hydroxypyrene. Exposure to total PAH for all worksites varied from 3.99 to 120.6 ug PAH m"* and for benzo(a)pyrene (BaP) from 0.17 to 4.88 /ig BaP m~3. The concentration of 1-hydroxypyrene in post- and pre-shift urine samples was in the range (0.5-61.8 iano\ 1-OHP per mol creatinine) and depended on the worksite. The Spearman rank correlation test showed a low but significant (P<0.05) correlation of urinary 1-hydroxypyrene in the post- and pre-shift samples with respiratory pyrene exposure. The quantitative aspects of biological monitoring for the evaluation of respiratory PAH exposure were tested with a pharmflcokinetic model. On the basis of individual pyrene exposure, excretion of urinary 1-hydroxypyrene during the working week was calculated for each worker. The results presented in this investigation indicate that biological monitoring of the pyrene metabolite 1-hydroxypyrene is a useful indicator of a general PAH exposure, but cannot replace personal air sampling for assessing the lung cancer risk of individuals^ Copyright © 1996 BOHS. Published by Elsevier Science Ltd.
INTRODUCTION
Polycyclic aromatic hydrocarbons (PAHs) are associated with industrial processes in which carbonaceous materials such as coke, coal tar, coal tar pitch and asphalt oils are produced or used (Bjerseth and Becher, 1986). The International Agency for Research on Cancer (IARC, 1983) classified occupational exposure to PAH-containing coal tar pitch volatiles in coal gasification plants and in coke production as carcinogenic to humans. They concluded that there is limited evidence of carcinogenicity to humans in the aluminium production industry.
In addition to respiratory exposure to PAHs at workplaces, dermal contact with PAH-containing material seems to be an important route of entry into the organism (Jongeneelen et al, 1988; Van Rooij et al., 1992). Van Rooij et al. (1993) reported that in the case of coke oven workers, 75% (range 28-95%) of the total absorbed pyrene, a PAH congener, enters through the skin.
'Author to whom correspondence should be addressed. 345
To estimate the total uptake (internal dose) of PAHs, several groups have suggested determining the concentration of the major metabolite of pyrene, 1-hydroxypyrene, in urine as an indicator of PAH exposure (Jongeneelen et al., 1988; Clonfero et al., 1989; Tolos et al., 1990; Buckley and Lioy, 1992; Boogart and van Sittert, 1994). Since the PAH profile for an industrial process such as aluminium production by the Soderberg process or coke distillation is relatively constant, the determination of one congener (pyrene) is used to represent the total PAH content for a specific process (Jongeneelen et al., 1993).
In a further step, an empirical mathematical relationship was used to relate air sampling data and biological monitoring data. Jongeneelen (1992) calculated a urinary concentration of 1-hydroxypyrene of 2.3 jonol per mol creatinine after a 3-day working period in coke oven workers. This is assumed to equal the lung cancer risk of the existing threshold limit values of 2 fig BaP m~3 and 0.2 mg BSM m~3.
Several epidemiological studies have shown that lung cancer is the most relevant health effect of occupational PAH exposure.
The aim of this study was to determine whether measurement of the urinary concentration of 1-hydroxypyrene is suitable to estimate respiratory exposure at work. To this end, six workers of the green section of a carbon anode plant were monitored during a five-shift working week with personal sampling and biological monitoring. During the work week, the airborne concentration of 26 PAHs and the concentration of 1-hydroxypyrene of the post- and pre-shift urine were determined for each worker.
MATERIALS AND METHODS Plant description
Carbon anodes are used in aluminium production in the pre-bake anode process, the carbon anodes are produced in a carbon plant which is separated from the potrooms. The anode plant in this study was divided into three main sections: the green anode section; the oven area; and the anode rodding sections. In the green anode section, coke (calcined petroleum coke) is ground to a specific particle size and blended with a binder of liquid petroleum pitch to form a semi-solid mixture (paste plant), which is then pressed in the forming section to the green anode. Although this process is largely automated, employees working in these sections are exposed to PAH-containing coal tar pitch volatiles, pitch and coke. In the oven area, the green anodes are baked in ovens for several days at a temperature of approximately 1400°C. The volatiles and participates are either kept under pressure in the ovens where they are burned as fuel, or removed and passed through a filter system. After baking, the carbon anode blocks are moved to the burned anode cleaning section, where they are fitted onto rods. In the furnace and anode rodding section, exposure to PAHs occurs to a much lesser extent than in the green anode section.
Study design
In the green anode section of the plant, six workers volunteered to participate in the study. They belonged to the same crew and represented operating, maintenance and supervisory personnel. During a 5-day working week, these workers were
monitored with personal air sampling and biological monitoring. Personal air samples of each of these workers were taken every day during an 8-h shift. The daily activities at the different worksites of each worker were carefully registered. In addition, before (7.30 am) and immediately after the shift (4 pm), urine samples were taken. The job description of the workers at the different worksites is given in Table 1.
Personal air sampling
Personal air sampling was carried out for each worker of the crew in each working shift (8.00-16.00) during a five-shift working week. The sampling equipment comprised a personal sampling pump (SKC Inc., Valley View, U.S.A.) and a GGP-system (Gesamtstaub-Gas-Probenahmekopf) developed by the BIA (Berufsgenos-senschaftliches Institut fur Arbeitssicherheit, Germany). It is possible to collect total particulate onto a glass fibre filter followed by a silver membrane, and volatile compounds with an XAD-2 adsorbent tube in line. Prior to sampling, the personal air sampling pumps were calibrated with a rotameter and a nominal flow rate of 3.5 1. min"1, which corresponds to a suction velocity of 1.25 m s"1. The calibration
of the pumps was checked after sampling, and if the difference exceeded 10% of the flow rate the sample was not taken into account. The air samples were taken at breathing height in accordance with the regulations. After sampling the filters and XAD-2 adsorbent tube were wrapped in aluminium foil and stored at — 20°C until analysis.
The filters and the adsorbent were extracted overnight with cyclohexane in a soxhlet apparatus. The extracts were filtered over silica gel and evaporated to a final volume of 200-500 /J. The detailed description of the analytical procedure is described elsewhere (Petry el al., 1994).
A total of 26 PAHs, including the 16 PAHs according to NIOSH Method 5506, were analysed by the combination of gas chromatography-mass spectrometry. A gas chromatography HRGC 5160 (Carlo Erba, Milan, Italy) equipped with a constant pressure-constant flow unit (CP-CF 516) was used. Separation was performed on a 20 m x 0.3 mm glass capillary coated with polysiloxane PSO86 (film thickness 0.2 /an, Huls America Inc.). The carrier gas was hydrogen at a linear flow rate of 50 cm s~'. Samples were injected 'on column' at 80°C. After 1 min, the temperature was raised to 200°C at 20°C min"1 and then to a final temperature of 320°C at 5°C min"1. The
interface between the gas chromatograph and the mass spectrometer was a 0.15 mm
Table 1. Description of the worksites participating in this study Worksite Job description
Truck driver and control functions Floor worker, operating and maintenance
functions Crane operator
Truck driver and operating functions Crane operator, Floor worker Foreman; operating, control and
maintenance functions Worker 1 Worker 2 Worker 3 Worker 4 Worker 5 Worker 6 Forming section Paste plant
Store Section (broken green anodes and burned anodes)
Forming section
Store section (coke) paste plant All worksites (mainly paste plant)
i.d. persilylated piece of fused silica capillary kept at 300°C. The mass spectrometer (model 4510, Finnigan, Sunnyvale, California, U.S.A.) was run in electron impact ionization mode and detection of the positive ions. The temperature of the ion source was held at 190°C. The ionization energy was set to 70 eV and the electromultiplier to -1700 V. The GC-MS was operated in multiple ion detection (MID) mode for the following m/z values: 128, 136, 152, 154, 164, 166, 178, 188, 202, 228, 234, 240, 252, 264, 276, 278, 300. Quantification was based on signal heights in the mass chromatograms. The method had a 10% precision level and a quantification limit of 1 ng m~3 at a sampling volume 1.5 m3.
The following polycyclic aromatic hydrocarbons (abbreviation given in parenth-esis) were analysed in the workers personal samples: naphthalene (naph) acenaphytylene (Aceny), acenaphthene (Ace), fluorene (Flu), phenanthrene (Phe), antracene (Ant), fluoranthene (Fluor), pyrene (Pyr), benzonaphtho(2.1-d) thiophene (BNT), benzo(ghi)fluoranthene (BghiFl) benzo(c)phenanthrene (BcP), benzo(a)an-thracene (BaA), chrysene (Chr), benzo(b + j)fluoranthene (BjbF), benzo(k)fluor-anthene (BkF), benzo(e)pyrene (BeP), benzo(a)pyrene (BaP), perylene (Per), idenol(1.2.3-cd)pyrene (IND), dibenzo(ac)anthracene (DacA), dibenzo(ah)anthra-cene (DahA), benzo(b)chrysene (BbQ, 278 (not identified), benzo(ghi)perylene (BgP), anthanthrene (ANT) and coronene (Cor).
Biological monitoring
During the working week, urine samples of each of the workers were collected before (7.30 am) and immediately after the workshift (4 pm). The urine samples were stored in plastic bottles at — 20°C until analysis.
According to the method of Jongeneelen et al. (1987) and Gardiner et al. (1992), 10 ml of urine was adjusted to a pH of 5.0 with 1 N hydrochloric acid and 0.1 M acetate buffer (pH 5.0) was added to a final volume of 30 ml. This mixture was incubated overnight (16 h) with 15 fi\ of glucoronidase-arylsulphatase (Bohringer, Mannheim, Germany) at 37°C in an electronically controlled rotary shaking bath. A sample enrichment and purification cartridge, packed with C18 reversed-phase liquid chromatographic material (Sep-Pak C18 cartridge, Waters, Milford, Massachusetts, U.S.A.), was used for the extraction of the metabolites. Before extraction the cartridge was primed with 5 ml of methanol, followed by 10 ml of distilled water. The treated urine was passed through the cartridge at a flow rate of approximately 10 ml min~'. The cartridge was washed with 3 ml of distilled water and 3 ml of 50% methanol in water. Final elution of 1-hydroxypyrene was performed with 8 ml methanol. The solution was evaporated to dryness and reconstituted with 1 ml of methanol.
The HPLC system comprised a Hewlett-Packard 1090 liquid chromatograph with an autoinjector and a Hitachi F1000 fluorescence detector. The extracts (25 /il) were injected onto a 250x4.0 mm column of LiChrosorb RP-18 (Knaur, Berlin, Germany). Column temperature was 40°C and flow rate 0.8 ml min""1. The
solvent gradient was 5 min of methanol-water (46:54), a linear gradient in 35 min to methanol-water (94:6) followed by 10 min holding. The excitation wavelength of the fluorescence detector was set to 242 nm and the emission wavelength to 388 nm.
For establishing a calibration curve, urine samples of non-exposed persons were spiked with 1-hydroxypyrene resulting in final concentrations of 2, 5, 10, 20, 40 and 400 nmol 1. and were treated as described above. A six-point standard curve was prepared across the working range. The peak heights of the chromatograms were used for quantification. The detection limit of the method was approximately 0.5 nmol 1. . The reproducibility of the chromatographic analysis was determined by repeated analysis of the spiked urine samples and gave a variation coefficient of
8-12%.
RESULTS
Personal air sampling
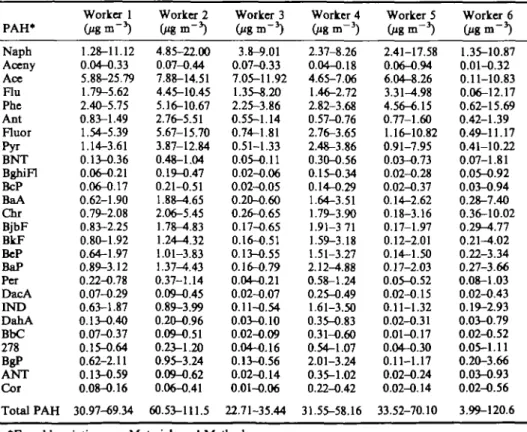
The results of the personal monitoring programme of each worker are shown in Table 2. The exposure to total PAH at the different worksites of the examined carbon anode plant varied from 3.99 to 120.6 jig PAH m~3. Worker 2, who was
mainly working in the paste plant, showed the highest exposure to total PAH with a range of 60.53-111.5 fig m~3 and a BaP concentration from 1.37 to 4.43 fig BaP m~3
(AM = 2.6 fig BaP m"3; GM = 2.39 fig BaP m~3; N= 5). Workers 1 and 4, who had
different tasks in the anode forming section, showed a lower exposure to total PAH
Table 2. Exposure to PAHs at different worksites in the carbon anode plant
PAH* Naph Aceny Ace Flu Phe Ant Fluor Pyr BNT BghiFl BcP BaA Chr BjbF BkF BeP BaP Per DacA IND DahA BbC 278 BgP ANT Cor Total PAH Worker 1 1.28-11.12 0.04-0.33 5.88-25.79 1.79-5.62 2.40-5.75 0.83-1.49 1.54-5.39 1.14-3.61 0.13-0.36 0.06-0.21 0.06-0.17 0.62-1.90 0.79-2.08 0.83-2.25 0.80-1.92 0.64-1.97 0.89-3.12 0.22-0.78 0.07-0.29 0.63-1.87 0.13-0.40 0.07-0.37 0.15-0.64 0.62-2.11 0.13-O.59 0.08-0.16 30.97-69.34 Worker 2 4.85-22.00 0.07-0.44 7.88-14.51 4.45-10.45 5.16-10.67 2.76-5.51 5.67-15.70 3.87-12.84 0.48-1.04 0.19-0.47 0.21-O.51 1.88-1.65 2.06-5.45 1.78-^.83 1.24—4.32 1.01-3.83 1.37-4.43 0.37-1.14 0.09-0.45 0.89-3.99 0.20-0.96 0.09-0.51 0.23-1.20 0.95-3.24 0.09-0.62 0.06-O.41 60.53-111.5 Worker 3 3.8-9.01 0.07-0.33 7.05-11.92 1.35-8.20 2.25-3.86 0.55-1.14 0.74-1.81 0.51-1.33 0.05-0.11 0.02-0.06 0.02-0.05 0.20-0.60 0.26-0.65 0.17-0.65 0.16-0.51 0.13-0.55 0.16-0.79 0.04-0.21 0.02-0.07 0.11-0.54 0.03-0.10 0.02-0.09 0.04-O.16 0.13-0.56 0.02-0.14 0.01-0.06 22.71-35.44 Worker 4 2.37-8.26 0.04-0.18 4.65-7.06 1.46-2.72 2.82-3.68 0.57-0.76 2.76-3.65 2.48-3.86 0.30-0.56 0.15-0.34 0.14-0.29 1.64-3.51 1.79-3.90 1.91-3 71 1.59-3.18 1.51-3.27 2.12-4.88 0.58-1.24 0.25-0.49 1.61-3.50 0.35-0.83 0.31-0.60 0.54-1.07 2.01-3.24 0.35-1.02 0.22-0.42 31.55-58.16 Worker 5 GignT3) 2.41-17.58 0.06-0.94 6.04-8.26 3.31-4.98 4.56-6.15 0.77-1.60 1.16-10.82 0.91-7.95 0.03-0.73 0.02-0.28 0.02-0.37 0.14-2.62 0.18-3.16 0.17-1.97 0.12-2.01 0.14-1.50 0.17-2.03 0.05-0.52 0.02-O.15 0.11-1.32 0.02-O.31 0.01-0.17 0.04-0.30 0.11-1.17 0.02-0.24 0.02-0.14 33.52-70.10 Worker 6 (pgm"3) 1.35-10.87 0.01-0.32 0.11-10.83 0.06-12.17 0.62-15.69 0.42-1.39 0.49-11.17 0.41-10.22 0.07-1.81 0.05-0.92 0.03-O.94 0.28-7.40 0.36-10.02 0.29-4.77 0.21-4.02 0.22-3.34 0.27-3.66 0.08-1.03 0.02-O.43 0.19-2.93 0.03-O.79 0.02-0.52 0.05-1.11 0.20-3.66 0.03-0.93 0.02-0.56 3.99-120.6 *For abbreviations see Materials and Methods.
with a concentration from 30.97 to 69.34 fig m~3 and a BaP exposure from 0.89 to 4.88 fig BaP m~3 (AM = 2.44 fig BaP m~3; GM = 2.14 fig BaP m~3; N=\G). The
crane operator of the coke store (worker 5) showed a higher variation in exposure to total PAH than the crane operator in the store section of broken green anodes and burned anodes (worker 3), mainly owing to his part-time activities in the paste plant. During the week his exposure to total PAH ranged from 33.52 to 70.1 fig PAH m~3
and for BaP from 0.17 to 2.03 fig BaP m~3 (AM = 0.99 fig BaP m~3; GM = 0.72 fig
BaP m~3; N=5). Worker 3, who remained the whole shift in the crane cabin had an
exposure of 22.71-35.44 fig PAH m~3 and 0.16-0.79 fig BaP m~3 (AM = 0.39 fig
BaP m~3; GM = 0.33 fig BaP m~3; N=5), respectively. Owing to his different tasks
as overseeing, maintenance and operating functions, worker 6 showed the highest exposure variation of all worksites. During the week his exposure to total PAH varied from 3.99 to 120.55 fig PAH m~3 and for BaP from 0.27 to 3.66 fig BaP m~3
(AM 1.38 fig BaP m~3; GM = 0.92 fig BaP m~3; N=5).
The weekly concentration of pyrene (gaseous and particulate) at all worksites ranged from 0.41 to 12.84 fig m . The distribution of pyrene between the gas and the particulate phase differed for all worksites from 5.3 to 68.6% by a factor of 13. In geometric mean, the worksites paste plant (GM = 24.6%; N=T), forming section (GM = 21.7%; N=S) and store section (GM = 23.0%; N=l0) showed an equal distribution.
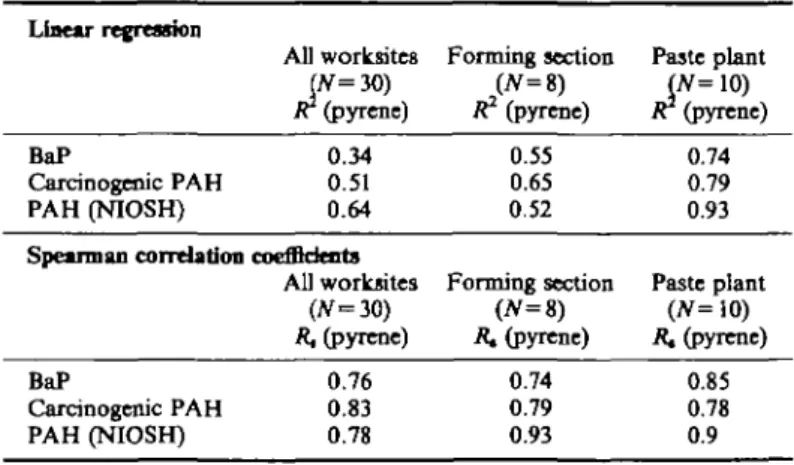
To evaluate the suitability of the congener pyrene as a representative for total PAH (NIOSH) and, from the toxicological point of view, for BaP and for the sum of carcinogenic PAH (classified as animal carcinogens by the IARC: BaA, Chr, BjbF, BkF, BaP, IND, BgP), a correlation was calculated using linear regression analysis. This was done in order to find out if exposure to carcinogenic PAHs such as BaP can be determined by using a marker compound such as pyrene or its metabolite 1-hydroxypyrene. For comparison, correlation analysis for PAH air concentrations using the Spearman rank correlation coefficient is shown, because it is often used to assess the suitability of pyrene as an indicator for PAHs. The results of these two correlation analyses for all worksites, the forming section and the paste plant are shown in Table 3.
Table 3. Linear regression and Spearman PAHs Linear regression BaP Carcinogenic PAH PAH (NIOSH) Spearman correlation BaP Carcinogenic PAH PAH (NIOSH) All worksites W=30) Jc (pyrene) 0.34 0.51 0.64 coefficients All worksites (tf=30) R, (pyrene) 0.76 0.83 0.78
correlation analysis of airborne
Forming section W = 8 ) 1c (pyrene) 0.55 0.65 0.52 Forming section (JV=8) fl. (pyrene) 0.74 0.79 0.93 Paste plant (N= 10) IC (pyrene) 0.74 0.79 0.93 Paste plant (iV= 10) R, (pyrene) 0.85 0.78 0.9
Biological monitoring
The concentration of l-hydroxypyrene in the urine of each worker in the post-and pre-shift samples was referred to creatinine. Considering all urine samples, the creatinine concentration varied from 1 to 43 mmol I."1. Only one sample was
lower than 9 mmol I."1 and one higher than 40 mmol I."1. The background
concentration of l-hydroxypyrene in the urine was determined on the basis of the average of the l-hydroxypyrene content in the pre-shift sample of Monday morning before the working week and Monday morning after the working week. It varied for the non-smokers (N=2) from 0.6 to 0.9 /anol mol"1 and for smokers
(N=4) from 0.5 to 1.5 [imo\ mol"1. The control group (employees of the company
office with no contact to PAH-containing material) showed for non-smokers ( # = 5 ) a l-hydroxypyrene concentration of 0.2-1.2 /anol mol"1 and for smokers
(N=5) 0.2-1.3 /imol mol"1. Owing to the small number of samples, a statistical
significance of the differences between the 1-hydroxypyrene concentration in urine of smoking and non-smoking controls could not be shown. Several authors have found that smokers do not have a statistically significant higher l-hydroxypyrene concentration in the urine (14). During the work week the concentration of 1-hydroxypyrene in the post-shift samples varied from 0.5 to 61.8 /imol mol"1
creatinine and in the pre-shift samples from 0.5 to 38.9 /nnol mol"1 creatinine. In
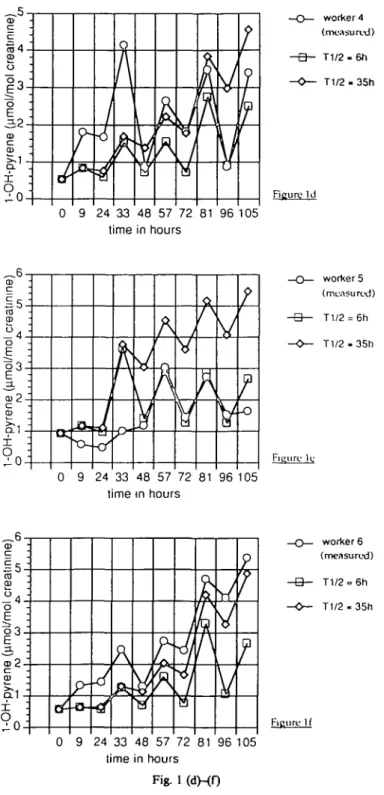
Figs l(a)-(f) the course of urinary l-hydroxypyrene is shown for each worker. Worker 2 in the paste plant showed the highest values during the week with a mean post-shift concentration of 24.6 /xmol l-hydroxypyrene per mol creatinine (GM; N=5) and a range from 14.2 to 61.8 /nnol mol"1, although his exposure to
pyrene was in the same range as that of the workers in the forming section. Urinary l-hydroxypyrene concentration in the post-shift samples of these ranged from 1.8 to 21.7 /anol mol"1 with a mean concentration of 4.8 /rniol mol"1 (GM;
N=5).
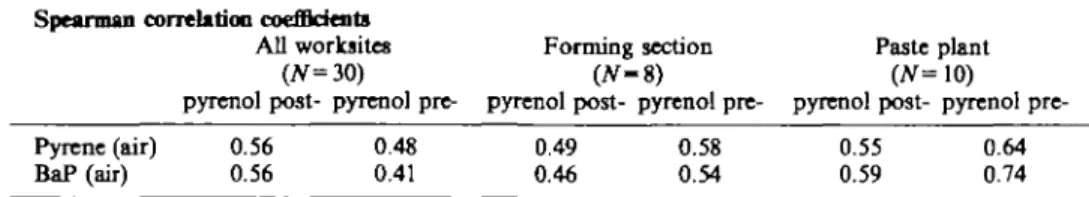
In the first correlation analysis, the Spearman rank correlation test was performed to prove whether there was a correlation between respiratory PAH (for example pyrene and BaP) exposure and the l-hydroxypyrene excretion in the post-and pre-shift samples; see Table 4.
Toxicokinetics
Lung cancer is the dominating health effect of occupational PAH exposure. The systemic PAH concentration, which can be expressed as urinary l-hydroxypyrene, is, however, composed not only of inhaled but also of dermal PAH uptake. Van Rooij
et al. (1993) reported that in the case of coke workers, an average of 75% with a
range from 28 to 95% of the total absorbed amount of pyrene enters the body through the skin. The great variability of dermal exposure of the workers makes it difficult to calculate the inhalatory PAH uptake by determining the concentration of l-hydroxypyrene in urine. To examine if a sufficiently precise relationship between urinary l-hydroxypyrene excretion and inhalatory uptake of pyrene exists, a range of individual periods was investigated and compared with the results of a pharmaco-kinetic model.
The calculation is based on a pharmacokinetic one-compartment model with a constant inhalatory pyrene intake (zero-order absorption) and a first-order
worker 1 (irteasured) T1/2 - 6 h T1/2 = 35h 0 9 24 33 48 57 72 81 96 105 time in hours o o CD 70-60 50 40 30. 20. 1 0-; ; ! ': : Q
A
;J,
=0
V
V /
•Ora
V,
worker 2 (measured) T1/2 = 6h T1/2 = 35h 0 9 24 33 48 57 72 81 96 105 time in hours ra 4 CDI
3
o E -3=2 CD C CDo
^- 0 : : Jti.A
y
/^
y worker 3 (measured) T1/2 = 6h T1/2 - 35h 0 9 24 33 48 57 72 81 96 105 time in hours Fig. 1 <aM<0cd CD o E CD I O 0 9 24 33 48 57 72 81 96 105 time in hours •_ -o-
J
ft
f \
\
v/
V
A
n / ^V
V
V
V
f
-o worker 4 (measured) T1/2-6tl T1/2-35h worker 5 (measured) T1/2 = 6h T 1 / 2 - 3 5 h 0 9 24 33 48 57 72 81 96 105 time in hours • ': \P-
-o-A
f A /1
a
'/^A
>/
t
worker 6 (measured) T 1 / 2 - 3 5 h cu 4 oI
3
Q.1 0 9 24 33 48 57 72 81 96 105 time in hours Fig. 1 (dHOFig. 1. (a)-(f) Measured and calculated 1-hydroxypyrene excretion courses of workers examined during 1 work week at a carbon anode plant.
Table 4. Spearman correlation analysis for airborne pyrene and BaP exposure concentrations and urinary 1-hydroxypyrcne in post- and pre-shift urine samples at the different worksites
Spearman correlation coefficients
All worksites Forming section Paste plant
(N=30) (N-&) (N=\0)
pyrenol post- pyrenol pyrenol post- pyrenol pyrenol post- pyrenol pre-Pyrene(air) 0.56 0.48 0.49 0.58 0.55 0.64 BaP (air) 0.56 0.41 0.46 0.54 0.59 0.74
elimination of the 1-hydroxypyrene in the urine. The half-life of pyrene in man is around 6-35 h (Jongeneelen et al., 1990). For this model, two different half-lives—6 and 35 li—were used to cover the entire range. Furthermore, it was assumed that 20% of the total pyrene intake is excreted as 1-hydroxypyrene in urine, as estimated by Van Rooij et al. (1993). Based on a EPA model (EPA, 1989) for particle bound chemicals, the inhalatory pyrene intake was estimated under the assumption that about 25% of inspired particles are exhaled, 12.5% are deposited in the lower respiratory tract and 62.5% are eliminated from the lungs and swallowed. Furthermore it was assumed that the elution of pyrene from the deposited particles in the lower respiratory tract is 100%, and that of the swallowed fraction of the particle bound pyrene, 40% is absorbed in the gastrointestinal tract (Forth et al., 1988). An absorption factor of 70% of gaseous pyrene was used. The background concentration of 1-hydroxypyrene in the urine was estimated by the average of the 1-hydroxypyrene content in the pre-shift samples of Monday morning before the work week and Monday morning after the work week. In the kinetic calculation, this background concentration was added everyday to the calculated pre- and post-shift concentration of each worker. The calculated 1-hydroxypyrene concentrations in urine for each worker during the whole working week are shown in Figs l(a)—(f), compared with measured concentrations of the six workers.
DISCUSSION
Traditionally, PAH exposure is monitored via personal sampling. This is assumed to reflect the inhalatory uptake of gaseous and particulate PAHs. Epidemiological studies have shown a quantitative relationship between inhalatory PAH exposure at the workplace and increased lung cancer risk. On this basis, occupational PAH exposure is regulated in most countries with threshold limit values based on mean airborne concentration of benzo(a)pyrene or the benzene soluble material of coal tar pitch volatiles.
Several groups have suggested the use of the determination of a PAH metabolite in urine as an indicator of occupational PAH exposure since this is assumed to reflect the internal dose of PAHs. No significant relationship between systemic concentra-tions of PAH metabolites and cancer risks has been determined by the International Agency for Research on Cancer, however. Before establishing a biological exposure limit (BEL) as an indicator of risk for PAH, one should ensure that the concentration of carcinogenic PAH in the lungs (reflecting inhalatory exposure)
can be reliably estimated on the basis of the urinary concentration of a PAH metabolite, for example 1-hydroxypyrene.
To evaluate the suitability of pyrene as an indicator for total PAH (NIOSH) and, from the toxicological point of view, the BaP and the sum of carcinogenic PAHs, a linear regression analyses and the Spearman correlation test were performed on the basis of the personal sampling data. The linear regression analyses (regression coefficient expressed as R2, Table 3) showed a poor correlation for pyrene and BaP air concentrations and a low correlation for pyrene and the sum of carcinogenic PAHs, respectively, total PAH (NIOSH) for all worksites. The same results were found at the worksites in the forming section. A higher correlation between pyrene and BaP, respectively, the sum of carcinogenic PAHs and a good correlation between pyrene and total PAH (NIOSH) were found at the worksites of the paste plant. The same tendency, with a higher correlation, was found when using the Spearman correlation test between pyrene and BaP, total PAH and the sum of carcinogenic PAHs. The Spearman rank correlation coefficient is often used to assess the suitability of pyrene as an indicator for PAHs. Using this test, one must consider the fact that only the rank of the compounds and not their actual concentrations is taken into account. It is therefore questionable whether this test is really appropriate for the evaluation of a quantitative relationship between a substance in the air and in the urine.
The extraction of PAH-metabolites is a result of inhalatory and dermal PAH exposure. Since only the inhalatory exposure was measured here, a toxicokinetic model was used to predict urinary levels and then to compare calculated and measured values.
The comparison between measured 1-hydroxypyrene excretion and that calculated for the workers examined [Figs l(a)-(f)] allows us to assess factors influencing the excretion rate of 1-hydroxypyrene for each individual. Workers 1 and 4 were both working in the forming section with similar tasks (mainly truck driving). Although their pyrene exposure was in the same range (Table 2) their measured urinary 1-hydroxypyrene excretion during the working differed considerably [see Figs l(a) and (d)]. Observation and questioning of both workers led to the conclusion that dermal exposure and varying smoking habits (both were smokers) would not explain this difference. It could be stressed that in the case of worker 1, physiological factors are responsible for this variability of urinary 1-hydroxypyrene excretion. Intensive dermal contact to PAH-containing material is assumed to be responsible for the difference between measured and calculated excretion course of worker 2 [Fig. l(b)] who was working in the paste plant. However, there is no uniformity between the excretion calculated on the basis of his relative constant respiratory pyrene exposure and the measured 1-hydroxypyrene concentrations before and after the shifts. This leads to the conclusion that the daily dermal exposure varies considerably and thus greatly influences the daily excretion rate of 1-hydroxypyrene. On the other hand, the example of worker 6 [Fig. l(f)] should be mentioned. In this case, a good concordance between estimated and measured 1-hydroxypyrene excretion during the work week was found. Because of his overseeing functions, this worker was assumed to have a minimal dermal exposure. In summary, these comparisons suggest that individual 1-hydroxypyrene excretion varies considerably from case to case. At the same workplace, the urinary excretion
of 1-hydroxypyrene differed up to a factor of 5 between workers with virtually the same pyrene exposure and an assumed low dermal exposure. Worksites where dermal exposure seems to be the most important route of entry of PAHs into the body, workers 1-hydroxypyrene excretion underlies a variability of factor 5-10 during a work week.
Data on dermal exposure are limited and the existing studies show a high variability of individual 1-hydroxypyrene elimination depending on worksites, protective measures, personal hygiene and physiological factors. It is, therefore, questionable whether a reliable mean dermal exposure for different processes at different worksites can be established. Indeed, as reported by Van Rooij et al. (1993), 75% of the total absorbed pyrene enters the body via the skin in the case of coke oven workers. Though the extent of dermal absorption is affected by a series of factors relating to the chemical itself or to the characteristics of the skin (Ecetoc, 1993), it is not yet clear how the absorption flux of a non-carcinogenic four-ring congener, such as pyrene, as measured with urinary 1-hydroxypyrene differs from that of carcinogenic five-seven-ring congeners, such as benzo(a)pyrene or dibenzo(a,h)anthracene, for example. With the isolated blood-perfused pig ear model Van Rooij (1994) estimated that the percutaneous absorption of PAH with a higher molecular weight than pyrene are overestimated by a factor of 7 for benzo(a)pyrene and up to a factor of 100 for indeno(1.2.3-cd)pyrene. The authors concluded that it is probably also valid for dermal PAH absorption in man. To date, no confirmation of this supposition, which is of great importance for risk assessment of cancer, is available.
Comparison of the measured and the calculated excretion courses of 1-hydroxypyrene in this investigation showed the influence of different factors on individual urinary 1-hydroxypyrene excretion. Non-concordant behaviour is not a consequence of incorrect pharmacokinetic parameters in the model, since changes in parameters would always change the points on the curve in the same direction. The extremely discordant behaviour observed must, therefore, be the consequences of individual differences in dermal PAH exposure, physiological factors or in personal habits. From the toxicological and medical point of view, lung cancer is the dominating health effect of occupational PAH exposure. Since the ratio of airborne pyrene to one or more carcinogenic PAHs varies from one process to another and no consistency in the relative contribution of dermal and inhalatory PAH exposure can be seen, the determination of urinary 1-hydroxypyrene is not valid for characterizing the respiratory exposure to PAHs of individuals. Knowledge of the inhalatory PAH exposure is however indispensable for the assessment of health risk.
The determination of the concentration of 1-hydroxypyrene in urine seems, therefore, to be suitable to assess the general PAH exposure of workers in comparable processes. The large number of samples in this case allowing individual variations to be balanced out. For a valid assessment of the individual lung cancer risk, however, it cannot replace personal air monitoring because of the important influence of so many confounding factors. Although personal air monitoring does not take into account measures such as wearing facial protective clothing, it reflects more reliably the individual inhalatory PAH uptake, which is still the most relevant for possible health effects.
REFERENCES
Bjerseth A. and Becher, G. (Editors) (1986) PAH in Work Atmospheres: Occurrence and Determination. CRC Press, Boca Raton, Florida.
Boogart, P. J. and van Sittert, J (1994) Exposure to polycyclic aromatic hydrocarbons in petrochemical industries by measurement of urinary 1-hydroxypyrene. Occup. Environ. Afed. 51, 250-258. Buckley, T. J. and Lioy, P. J. (1992) An examination of the time course from human dietary exposure to
polycyclic aromatic hydrocarbons to urinary elimination of 1hydroxypyrene. Br. J. ind. Med 4 9 , 1 1 3 -124.
Clonfero, E., Zordan, M., Venier, P., Paleologo, M., Levis, A. G., Cottica, D., Pozzoli, L., Jongeneelen, F. J., Bos, R. P. and Anzion, R. B. M. (1989) Biological monitoring of human exposure to coal tar. Urinary excretion of total polycyclic aromatic hydrocarbons, 1-hydroxypyrene and mutagens in psoriatric patients. Int. Archs. occup. Environ. Hlth. 61, 363-368.
ECETOC (1993) Percutaneous Absorption. Monograph No. 20. European Centre for Ecotoxicology and Toxicology of Chemicals, Brussels.
EPA (1989) Exposure Factors Handbook. EPA/600/889/043. Office of Health and Environmental Assessment, U.S. Environmental Protection Agency, Washington, DC.
Forth, H., Kahl, R. and Kahl, G. F. (1988) Pharmacokinetics of low doses of benzo(a)pyrene in the rat.
Food Chem. Toxicol. 26, 45-51.
Gardiner, K., Hale, K. A., Calvert, I. A., Rice, C. and Harrington, J. M. (1992) The suitability of the urinary metabolite 1-hydroxypyrene as an index of polynuclear aromatic hydrocarbon bioa variability from workers exposed to carbon black. Ann. occup. Hyg. 36, 681-688.
IARC (1983) 1ARC Monographs on the Evaluation of the Carcinogenic Risk of Chemicals to Humans. International Agency for Research on Cancer, Lyon.
Jongeneden, F. J. (1992) Biological exposure limit for occupational exposure to coal tar pitch volatiles at cokeovens. Int. Archs. occup. Environ. Hlth. 63, 511-516.
Jongeneelen, F. J., Anzion, B. M. and Henderson, P.Th. (1987) Determination of hydroxylated metabolites of polycyclic aromatic hydrocarbons in urine. J. Chromatogr. 413, 227-232.
Jongeneelen, F. J., Ny, E. T. and Jongeneelen, F. (1993) The relationship between polycyclic aromatic hydrocarbons in air and in urine of workers in a Sdderberg potroom. Am. ind. Hyg. Ass. J. 54, 277-284.
Jongeneelen, F. J., Sheepers, P. T., Groenendijk, A., Van Aerts, L., Anzion, R., Bos, R. P. and Veenstra, S. J. (1988) Airborne concentrations, skin contamination, and urinary metabolite excretion of polycylic aromatic hydrocarbons among paving workers exposed to coal tar derived road tars. Am.
ind. Hyg. Ass. J. 49, 600-607.
Jongeneden, F. J., van Leeuwen, F. E., Oosterink, S., Anzion, R. B. M., Van der Loop, F., Bos, R. P. and Van Veen, H. G. (1990) Ambient and biological monitoring of coke oven workers: determination of internal does of PAHs. Br. J. ind. Med. 47, 454-^461.
Petry, Th., Schmid, P. and Schlatter, Ch. (1994) Exposure to polycyclic aromatic hydrocarbons (PAHs) in two silicon carbide plants. Ann. occup. Hyg. 38, 741-752.
Tolos, W. P., Shaw, P. B., Lowry, L. K., MacKenzie, B. A., Deng, J. F. and Markel, H. L. (1990) 1-Pyrenol: a biomarker for occupational exposure to polycyclic aromatic hydrocarbons. Appl. Occup.
Environ. Hyg. 5, 303-309.
Van Rooij, J. G. (1994) Dermal exposure to polycyclic aromatic hydrocarbons among workers. Ph.D. thesis, University of Nijmegen.
Van Rooij, G. M., Bodelier-Bade, M. M., De Looff, A. J. A., Dijkmans, A. P. G. and Jongeneelen, F. J. (1992) Dermal exposure to polycyclic aromatic hydrocarbons among primary aluminium workers.
Med. Lav. 83, 519-529.
Van Rooij, G. M., Bodelier-Bade, M. M. and Jongeneelen, F. J. (1993) Estimation of individual dermal and respiratory uptake of polycyclic aromatic hydrocarbons in 12 coke oven workers. Br. J. ind. Med. 50, 623-632.