Initiation and Termination
of Oriental Fruit Moth Male Response to
Pheromone
Concentrations
in the Field
1T.
c.
BAKER2 AND W. L. ROELOFSDepartment of Entomology, New York State Agricultural Experiment Station, Geneva, New York ABSTRACT
Environ. Entomol. 10: 211-218 (1981)
The distance from the pheromone source at which Grapholitha molesta (Busck) males initiated walking, upwind flight, or wing fanning while walking varied directly with the pheromone emission rate. Roughly a IO-fold increase in emission rate resulted in a ca. 2-fold increase in mean maximum distance for initiation of these behaviors. Also, an apparent upper concentration threshold in males caused upwind flight to be terminated at increasing distances from the source with increasing emission rates. Thus, upper and lower thresholds apparently determine the boundaries of the "active distance" for upwind flight. There was much daily variation in mean maximum active distance, possibly due to temperature effects upon male threshold. The active distance estimates were used to design an optimal moni-toring trap deployment strategy to minimize attraction of males from areas surrounding orchards. Using Bossert and Wilson's equation for active space, the average lower (initiation) threshold for upwind flight was 7.2 x 10⁻¹⁷ g/cm3 and the upper (termination) threshold
was 2. I x 10-13 g/cm3. Their model should be altered so that active space is defined as the
space where pheromone concentration is within both lower and upper thresholds for a particular behavior.
Introduction
In recent years, the pheromone monitoring trap has become a valuable tool in the management of lepidop-terous pests. While providing essential information on adult population peaks for insecticide spray timing or pre1ictive phenological models (Reidl et al. 1976, Welch et al. 1978), its usefulness for estimating popu-lation density has been limited by a number of factors. One is the lack of knowledge of the drawing range of such traps, without which even rudimentary absolute density estimates cannot be made. Correlating relative capture frequencies directly to economic injury levels would seem one way around the population estimate problem, yet correlation accuracies still depend upon variations in the traps' drawing ranges. For example, traps may attract males from outside the crop area, re-sulting in an overestimation of the female population within the crop. Such an error would presumably occur more frequently with smaller plot sizes or with traps placed closer to crop borders, but we can only speculate until actual drawing range measurements are made.
We wanted to make such measurements using several
Grapholitha molesta (Busck) (Oriental fruit moth) sex
pheromone blend dosages, since we felt that dosage-dependent drawing range variation might allow traps to be tailored for optimal positioning within an orchard. Also, because pheromone emission rates had been de-termined for some of the dosages (Baker et al. 1980), we were interested in estimating male response thresh-olds and how they interact with emission rates to define the "active distance" of pheromone communication.
Materials and Methods
Chemicals
The following have been identified as G. molesta sex pheromone components and were used in this study:
(Z)-, Received for publicotion Murch 24(Z)-, 1980.
• Present oddress: Division of Toxieology and Physiology. Department of En· tomology, UniversilY of Califomio, Riverside, CA 92521.
8-dodecenyl acetate (Z8-12:Ac) (Roelofs et al. 1969, A.M. Carde et al. 1979), (E)-8-dodecenyl acetate (E8-12:Ac) and (Z)-8-dodecenyl alcohol (Z8-12:0H) (A. M. Carde et al. 1979, Biwer et al. 1979). The Z8-12:Ac was purchased from Farchan Corporation and found to contain over 3% of the (E) isomer as checked on a 10%-XF-1150 (50% cyanoethyl methylsilicone on 100-120 mesh Chromosorb W-AW-DMCS) 2m x 2mm ID glass OLC (gas-liquid chromatography) column in a Packard model 7300 series gas chromatograph. An H2flame
ion-ization detector was used, and N2at 25 ml/min was the
carrier gas. Oven temperature was 160°C. Retention times were 3.1, 3.4, and 3.8 min for E8-12:Ac,
Z8-J2:Ac, and Z8-12:0H, respectively. We purified the Z8-12:Ac by low pressure liquid chromatography using a high-capacity 2.5 cm J.D. glass column packed with 46 cm of 20% AgN03 on Silica Gel H® (30- 70 mesh) (1. T. Baker Co.) using a 95:5 Skellysolve-B:ethyl acetate solvent system flowing at 5 mllmin. The resulting pur-ified Z8-12:Ac contained 0.04% of the (E) isomer, de-termined by GLC analysis on XF-1150 (using peak height x retention time), no detectable Z8-12:0H, and less than 0.1% other volatile impurities. The E8-12:Ac, obtained from Farchan Corp., also was purified on the 20% AgN03 HPLC column. The resulting E8-12:Ac
contained no detectable (Z) isomer or Z8-12:0H, and less than 0.5% other volatile impurities. The Z8-12:0H, made by saponifying the above-purified Z8-12:Ac, con-tained 0.1% Z8-12:Ac, 0.04% E8-12:0H, no detectable E8-12:Ac, and less than 0.2% other volatile impurities as checked on XF-1150. The final three-component blend checked on XF-1150 was 5.9% E8-12:Ac and
3.8% Z8-12:0H in Z8-l2:Ac, formulated according to
the optimal ratio of Baker and Carde (1979a).Rearing and Handling
G. molesta males were reared on small green thinning apples on a 16:8 light:dark photoperiod regime at 25°C and variable humidity. Light:dark lighting intensities
©
1981Entomological
Society of America
211
were 1400 and less than 0.3 lux, respectively. Pupae were segregated by sex and the adult males were held at 25°C on a 16:8 photoperiod regime in 33 x 27 x 31 cm screen cages in rearing rooms where no females were kept. Males were additionally segregated by daily age, and were divided into two groups in which scotophase (dark phase) commenced at 1100 and 1500 h, respec-tively. This photoperiod shift allowed behavioral obser-vations to be performed outdoors in the morning or afternoon at 0-3 h before scotophase, the period of op-timum pheromone response for G. molesta (Baker and Carde, 1979b). Males for the mark-release-recapture experiment, however, were held on a 16:8 regime with lights-off at 2030 h to coincide with outdoor conditions.
Measurements of Mean Maximum Active Distance of
Response Initiation
We used a large treeless recreation area with ca. 10 cm-high grass at the Geneva Experiment Station for these measurements. A small part of the ca. 10,000 m2
triangular-shaped area was a gravel parking lot and was bordered by trees on two sides and a building on the third. This experimental field had two desirable char-acteristics. One was the lack of turbulence-producing obstructions or pheromone-adsorptive surfaces, and the other was the lack of surfaces that could harbor calling females (of other species) interfering with the measure-ments. G. molesta female interference also was mini-mized by conducting experiments in morning or after-noon using males on shifted photoperiod schedules.
Pheromone was emitted from 1, 10, 100, or 1000 I-tg-loaded rubber septa (A. H. Thomas, #8753-022, sleeve type) impaled, large opening skyward, on an insect pin taped to the top of a 1.7 m high, 5 cm diam. steel pole anchored by a cement base. The septum's vertical po-sitioning made the chemical plume free of directionally biased septum turbulence. The pin and top of the pole were rinsed with acetone whenever septa were changed. A smoke plume-generating apparatus was located 3 m away to indicate wind direction and to provide a parallel but separate marker for pheromone plume position. Am-monium chloride smoke was produced by pumping air from a vacuum pump through separate flasks containing concentrated hydrochloric acid and ammonium hydrox-ide. The vapors traveled up separate tubes whose open-ings met at the top of an identical 1.7 m high pole where a dense plume of bluish-white smoke formed. Depend-ing on the predominant wind direction, the pheromone and smoke sources were maneuvered to minimize the plumes' overlap as the smoke could affect male behav-ior.
A cage of 4-5-day-old males was kept 50-100 m upwind of the pheromone source. Immediately before testing, 3 males were removed and placed together in an 8 cm high x 10 cm basal diam. screen cone com-pletely open at the base. After the males became quies-cent, an observer began walking slowly toward the pher-omone source from several hundred meters downwind, with the open end of the cone held upwind at eye level. The walker tried to keep the smoke approximately 3-5 meters to the side at all times to maximize exposing the males to pheromone at all distances. A distinct smoke plume was not usually visible past 50 m and so
phero-mone plume position often had to be inferred by ob-serving the smoke's direction from a distance. Very little upwind, mostly lateral, walking was used with rapidly changing wind directions to maintain position with re-spect to the smoke but whenever the direction stabilized, the observer walked mostly upwind with small (less than 5 m) lateral oscillations. Upwind advancement also was prohibited when wind velocity exceeded 1.5 m/sec, as monitored on a Hastings-Raydist hot-wire anemometer by another observer near the source. Velocities above 1.5 m/sec significantly reduced to nearly
a
the frequency of flight initiation by males in a laboratory wind tunnel (see Results). Progress toward the source during high velocities, therefore, would have biased against upwind flight active distances relative to those of walking and wing fanning while walking.While walking, the observer watched the males through the back of the cone. Two of the 3 behaviors monitored, walking and wing fanning while walking were scored either when one male exhibited the behavior for 3 or more continuous seconds, or at least 2 of the 3 males exhibited the behavior simultaneously regard-less of duration. Upwind flight was scored when any of the 3 males flew upwind out of the cage, regardless of duration. Flight trajectory was nearly always upwind initially, but it was not possible to follow males for more than a few meters owing to their small size and high flight velocity. The upwind approach of flying males, therefore, was measured in a second experiment de-scribed in the next section. The observer dropped flags coded for the behavior, pheromone dosage, and replicate at the site where the behavior was first observed. Wind velocity at the time each flag was dropped was recorded by the second observer stationed with the anemometer. Distances to the flags from the pheromone source were measured at the completion of the observations. Cones were used once per experiment and rinsed with acetone between uses.
Measurements of Mean Active Distance of Upwind
Flight Termination
A septum containing one of the same four dosages used above and impaled upright on an insect pin was attached to the top of a 0.5 cm diam. steel rod in the ground so that the septum was ca. 15 cm above the grass. Concentric string circles with radii of 10, 30, 100, and 300 cm were placed around the septum. Ob-servations were performed between 1200 and 1500 h using 4-5-day-old males at 0-3 h before onset of lab-oratory scotophase. After approaching from sidewind, the observer placed on the grass 5 m directly downwind of the septum a screen cone containing a single male. The male's flight was then followed and scored for the closest approach to the septum using the string circles as guides. A second observer stationed ca. one m to the septum's side aided in tracking, capturing, and dispos-ing of the males after they either touched the septum or terminated upwind flight. Only one upwind approach per male was allowed.
M ark- Release-R ecapture
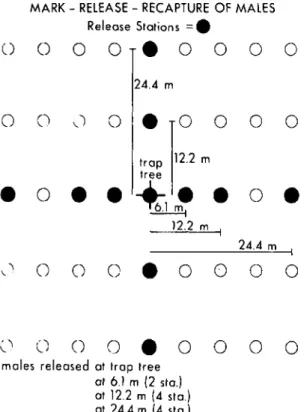
From July 16 to August 3, 1979, at ca. 4 h before sunset 2-5-day-old males were placed, 20 per bag, in
213
4-liter polyethylene bags containing a ca. 100 mg of Dayglo® fluorescent powder. The bags were agitated to dust the males with sufficient powder to be visible later under ultraviolet light. The powder's color was the code for the distance from a central pheromone trap at which these males were to be released. Four release points (20 males/release point) were 24.4 m from the trap, 4 were at 12.2 m, 2 at 6.1 m (40 males total), and 1 was at the trap tree itself (Fig. 1). At ca. 2.5 h before sunset the bags were placed beneath their release-trees in each of two semi-dwarf orchard plots, separated by 40 m. On signal, workers in each plot began releasing males into the canopy of eaeh tree by gently opening and shaking the bags. All males were released within 10 minutes, and within the next 5 minutes, the Pherocon® lC traps were deployed. One trap contained a 10 IJ-g dose, the other a 100 IJ-gdose per septum of the pheromone blend described earlier.
Traps were taken down the next morning and the males examined under UV light. Before a new replicate was run, other traps were placed in the orchards for at least 3 days to capture colored males left in the area.
tffects of Wind Velocity and Temperature
Wind velocity effects were observed in a 2.0 X 0.89
X 0.96 m laboratory wind tunnel (Miller and Roelofs, 1978). Three males contained in a screen cone like that described earlier were placed on a 15 em-high platform
I m downwind from a fan with the cone's open end facing upwind. At random I of 4 wind velocities was
generated for 15 seconds, whereupon five 10 IJ-g septa arrayed on 1/4" mesh screen in a
"+"
formation (5 em between the center and 4 outer septa) were introducedI0 em upwind of the males to insure their exposure to pheromone. The number of males walking, wing fan-ning while walking, and flying were recorded. To meas-ure wind velocities the anemometer was held at the cone's open end with the septum-holding device in po-sition upwind. Males were used once and discarded.
To record temperature effects, the same three behav-iors were observed at 14.5°, 16°, and 18°C. A single 10 IJ-g septum was placed 1.5 m upwind of the cone con-taining 3 males with the tunnel's fan generating wind at 0.36 m/sec. Again, males were used only once.
Results
Mean Maximum Distances of Response Initiation
The distance from the pheromone source at which previously sitting males first exhibited walking, fanning while walking, or upwind flight varied directly with the source dosage. These mean maximum active distances (Fig. 2) averaged over the entire experiment, showed a consistent pattern: higher dosages evoked responses at significantly greater distances than lower dosages. In still air, the emission rates of Z8-12:Ac loaded at 10, 100, and 1000 IJ-g on septa were 1.2, 12, and 219 ng/ h (I IJ-g is not known) (Baker et aI., 1980) and so ca. a IO-fold increase in emission rate resulted in slightly greater than a 2-fold increase in mean maximum active distance for any of the 3 behaviors monitored. R. T. Card6 (1979), using Bossert and Wilson's (1963) equa-MARK - RELEASE - RECAPTURE OF MALES
Release Stations
=.
o •
0
Walking a Upwind Flight aFanning While Walking
a b
b
MEAN MAXIMUM ACTIVE DISTANCES DOSAGE SEPTUM 1"9)1000
o
o
o
•
o
o
o
o
24.4 mo
o
o
•
24.4 mo
\..}o
o
•
(Io
o
o
o
\..'
o
•
o
20 40 60 80 100 120DISTANCE IMI FIRST OBSERVATION OF BEHAVIOR
FIG. 2.-Mean maximum active distances of walking, up-wind flight, and fanning while walking to four pheromone dos-ages. For same behavior, means having no letters in common are significantly different according to an analysis of variance with Waller and Duncan's BSD test(P <0.05). Brackets on the means indicate standard error. For 1000, ]00, 10, and J
(J.g, respectively, for walking N =32, 30, 30, and 25 repli-cates, upwind flight N =20, 20, 22, and 16, and for fanning while walking N = 18, 23, 30, and 22. When a particular behavior did not occur, no value was entered.
o
o
o
('
Cl 0
0
•
0
moles released at trop tree
01 6.1 m (2 sta.)
at 12.2 m (4 sta.) at 24.4 m (4 sta)
FIG. I.-Location of release points for marked G. molesta
males, who were color-coded by distance of release from cen-tral monitoring trap. Two such plots were used, one with a ]0 (J.g-and the other with a ]00 (J.g-baited monitoring trap.
Vol. 10, no. 2
a
W ~ ~ 00 ~ lW 1~DISTANCE (M) FIRST OBSERVATION OF WALKING
FIG. 3.-Daily variation in maximum active distance for walking apparently influenced by average temperature at the time of the observations. Brackets on means indicate standard error. N =3 for each dosage on each date. Six other obser-vation periods are not shown.
tion, calculated that a IO-fold increase in pheromone emission rate should elevate the mean maximum active distance 3.7-fold.
Although considerable daily variation occurred, the active distance rankings always followed those of dos-age (Fig. 3). These large daily variations appeared to be due to a large extent on temperature effects upon males' response thresholds. Many reports have estimated a 16°
flight threshold for male G. molesta (Armstrong, 1929; Reichart and Bodor, 1972; Rothschild and Minks, 1974). This estimate is supported by our data. On days when the temperature was below 16°, no males took flight, hence the active distance for flight was effecti vely zero. Furthermore, in the wind tunnel flight initiation behavior at 14.5° and 16° was significantly less frequent than at 18° (Table I). Other behaviors such as walking also were temperature-affected.
Similarly, wind velocity affected behavior, especially upwind flight, which was totally suppressed at high ve-locities (Table 2). No wind suppression bias against up-wind flight relative to other behaviors should have oc-curred in the field since the mean wind velocity concurrent with behavioral responses was 0.51 m/sec (± .41 S.D.; range among dosages and behaviors 0.32-0.73 m/sec). Laboratory data suggest that certain veloc-ity ranges may favor expression of one behavior over another (Table 2). However, walking occurred at as great a distance as upwind flight (Fig. 2) in spite of an apparent bias in favor of flight at the lowest velocities, those predominating in the field. This may be explained by the interaction of wind and velocity effects. The fact that walking and upwind flight active distances were greater than fanning while walking implies that the first two behaviors have lower pheromone thresholds than
SEPTUM DOSAGE (Ug) 1000 100 10 1 25 Jun 17° (AM) 23 Jun 12° (No Flight,) 26 Jun 19° 25Jun 20° (PMI
Table I.-Effect of temperature on the percentage of G.
molesta males responding to pheromone emitted from a rubber septum impregnated with 10JLg of pheromone. Per-centages were taken after 30 sec of exposure to pheromone. Percentages in same row having no letters in common are significantly different according to aX2 2 x 2 test of
inde-pendence with Yates' correction (P <0.05).N =45 for all treatments.
Temperature(0C)
14.5° 16° 18°
%Males flying 9c 42b 100a
%Males fanning while
walking 7ab 20a Ob
%Malcs walking 20a 20a Ob
%Males sitting 64a 18b Oc
the latter under the average wind and temperature con-ditions of this study.
Average Distance of Upwind Flight Termination
One interesting result of this study was that although the two higher release rates had longer average maxi-mum active distances than lower rates, the higher rates' active distances did not extend all the way to the source. This was evidenced by a higher percentage of males terminating upwind flight before reaching the source to the 1000 and 100 p.g septa although just as many males initiated upwind flight as to the 10 p.g septum (Table 3). R. T. Carde et al. (1975), using a different blend, observed that fewer males landed near a 1000 p.g septum compared to 100 p.g even though equal numbers flew upwind. The average termination distances, 155 and 20 cm for the 1000 and 100 p.g septa, respectively (Table 3), represent the upper limits of upwind flight active distances as dictated by an apparent upper response threshold in males. This level probably was not reached at lower dosages where premature termination was rare and more likely attributable to visual responses to the septum or too little pheromone. A concentration ap-proaching the lower threshold was occurring 5 m away from the one p.g septum where males were released; only 40% of the males initiated upwind flight to one p.g compared to 83-93% to the higher dosages.
A composite picture of the data from both experi-ments illustrates how the average upwind active dis-tances become skewed away from the source as release rate increases (Fig. 4). Applied to trapping strategies, it is clear that increasing the drawing range past a certain limit would have its trade-off in losing "efficiency" at close range.
M ark- Release-Recapture
Recapture frequency by 10 p.g relative to the 100 p.g septum was not sharply reduced at greater than 12.2 m, contrary to what we expected from the average drawing ranges measured in the previous experiments (Fig. 5). Instead, the 100 p.g trap recaptured significantly more of the males released at all distances except at the trap tree. Although dispersal from the release trees could have caused variation in the recapture pattern, the lack of dramatic drop-off in recapture range may be ex-plained by short-term fluctuations in active distance.
April 1981 215
Table 2.-ElTect of wind velocity in flight tunnel on the percentage of males responding to 5 septa containing 10 1-£gof pheromone placed 10 cm upwind of the males. Percentage in same row having no letters in common are significantly dilTerent according to a X2 2x2 test of independence with Yates' correction (P <0.05). N = 21,39,36, and 33 for the
0.89, 1.18, 1.73, and 1.98 mlsec treatments, respectively.
Mean Wind Velocity (mlsec) (±S.D.)
0.89 (±0.09) 1.18 (±0.21) 1.73 (±0.29) 1.98 (±0.31)
%Males I sec 43a 13b 6b Ob
Flying 5 sec 78a 55a 3b Ob
%Males
Fanning while I sec 57a 71a 31b 3c
walking 5 sec 17ab 32a !4ab 6b
'7cMales I sec Ob 8b 63a 64a
Walking 5 sec 6b 8b 54a 61a
'7cMales I sec Ob 8b Ob 33a
Silting 5 sec Ob 5b 29a 33a
Table 3.-ElTect of pheromone dosage on upwind flight approaches to pheromone source byG.molesta males released individually from 5 m downwind. Thirty males were released to each dosage. Those males reaching the source were scored as approaching to 0 cm.
Before reaching 1m away' Septum
dosage
X
Closest approachto pheromone source! % Upwind flight'
% Termination Upwind Flight
Before reaching source' (±S.D.) l1-£g to 1-£g 100 1-£g 1000 1-£g 8.3±28.9cm bc 1.9± 6.3cm c 20.0±24.15cm b 154.8±96.0cm a 40% (12/30) b 87% (26/30) a 93% (28/30) a 83% (25/30) a 0% (0/12) b 0% (0/26) b 4% (1/28) b 56% (14/25) a 8% (1/12) b 12% (3/26) b 88% (23/28) a 100% (25/25) a
I Means in same column having no leiters in common are significantly different according to the I-test (P<0.05).
'JPercentages in same column having no letters in Common are significantly different according to a)(2 2x2 test of independence with Yates' correction (P<0.05).
100
Mean Active Distance· Upwind Flight
SEPTUM DOSAGE 11.0.9) 1000 _____ .~77m 100 •••••••• ~ 29m 10 80 PERCENT RECAPTURED MALES 60 40 20 NS
-1**
1 100119 10119o
2 .4 6 B 10 12DISTANCE FROM PHEROMONE SOURCE (ml FIG. 4.-A depiction of the mean active distances for upwind flight for the four different septum dosages using a composite of the data from Fig. 2 and Table 3.
Although a time-averaged drawing range can be calcu-lated (Fig. 2), the real-time drawing range may fluctuate daily, hourly, or by the minute as a result of wind and temperature effects on male response threshold. A gust of wind suppressing male flight may send the upwind flight active distance from 100 m to nearly 0 and back to 100 in a few seconds as it passes. Thus, because the 10 and 100J.tg active distances should be similarly af-fected by such meteorlogical fluctuations, the 100 J.tg
trap's range should always exceed that of 10J.tg (Fig. 3).
o
4 8 12 16 20 24DISTANCE 1M)
Males Released From Monitoring Trap FIG. 5.-Percent recapture of males released at various dis-tances away from a centrally-located monitoring trap containing either a to or tOO ILg-baited septum. N = 85. 200, 320, and 320 for the 0, 6.1, 12.2, and 24.4 m release points, respec-tively.
Discussion
Sex pheromone lures are usually formulated so that they capture a maximum number of males. These max-imal captures result from a trade-off between drawing range and efficiency (males captured divided by number of approaches) that was evident from our data for G.
216
(drawing range), increased to greater distances from the source with increased pheromone dosage, but so did terminaIion of upwind flight. Thus, the boundaries of the active distance (Fig. 4) apparently are determined by lower and upper thresholds of male response, as hy-pothesized from trap catch data by Roelofs (1978) for other species. These thresholds explain why, despite a greater drawing range, traps containing 1000 p,g capture fewer males than those with 200 p,g (Roelofs and Carde, 1974) or 100 /Jog(Baker and Roelofs, unpublished data). Compared to 1000 p,g, traps containing 100 p,g will have a shorter drawing range, but more males will ap-proach close enough to land and be captured (Fig. 4).
Knowledge of differences in drawing ranges between dosages can be utilized to obtain more accurate within-orchard population estimates by placing monitoring traps far enough from edges so that males are not likely to be attracted from surrounding woods and fields. G.
molesta is found generally only within orchards, so these
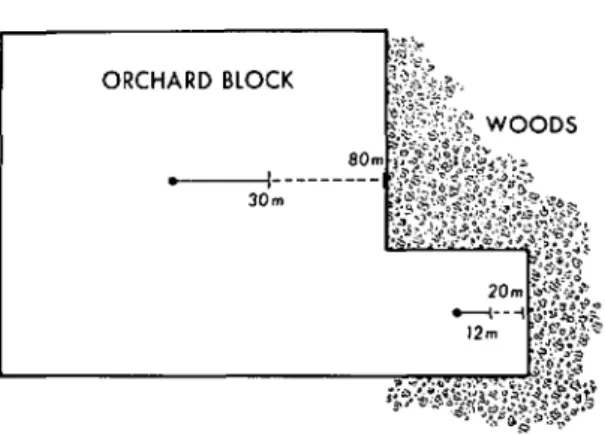
considerations are probably not too important for this species, but they may be for more highly polyphagous species. However, for G. molesta, the upwind flight active distances indicated that the 10 p,g septum is ide-ally suited to monitor smaller areas near edges, corners or in small orchard blocks (Fig. 6). The 20 m maximum recorded upwind flight active distance (dashed line) is the closest to the edge that 10 p,g-containing traps should be placed although the average active distance is 12 m (solid line). Conversely, the 100 p,g dosage may be used in traps placed in the center of larger blocks (Fig. 6) to detect the presence of males over a wider area deter-mined by the 29 m average active distance. Placement of the trap at least 80 m from any edge would preclude attracting males from beyond the orchard. Finally, if fine-grained sampling were needed to locate localized
high-density populations, a dense grid of small active
distance traps such as I or 10 /Jogcould be deployed.
Factors Affecting the Measurements
All measurements were made in an open field so that we could measure maximum possible active distances and the measurements from this simplified environment may not be perfectly applicable to an orchard. If they differ though, the orchard distances should be shOlter due to reasons discussed earlier.
Another factor possibly influencing the measurements was subthreshold pre-exposure to pheromone during the observer's walk upwind. Such low-grade exposure also likely occurs under orchard conditions to both trap- and female-emitted pheromone and thus our data may ac-tually be more representative of real monitoring condi-tions than measurements eliminating such exposure. Our objective was not to describe molecular concentration patterns, a difficult task because male threshold changes must be factored out. Rather, our goal merely was to measure the average maximum active distances which vary with both concentrations and threshold. It appeared
that for G. molesta wind and temperature-induced
threshold variation may have a great influence upon ac-tive distance.
Active Space Models
Nakamura (1976a) attempted to measure the active space of Spodoptera litura (F.) sex pheromone at one
ORCHARD BLOCK
12 l.t'~;i~..:::!
'~";;"~fi~;)~l~
FIG.6.-A depiction of the possible optimal placement of monitoring traps for G. molesta containing the 10 J.Lgseptum (lower dot) and 100J.Lg septum (upper dot). For both traps the solid line represents the average maximsm drawing range, and the dashed line represents the maximum observed drawing range.
dosage and compared it to the active space generated by calling females. His objectives differed from ours, and included trying to infer molecular concentration changes with wind velocity. Using males in completely enclosed cages, he found that for S. fitura the average active distance for flight (upwind flight could not be measured within the cages) was ca. 35 m. Incontrast to our find-ings with G. molesta (Fig. 2), walking appeared to have the highest threshold, occurring only near the source, whereas wing fanning occurred farther away. Nakamura (1976b, 1979) concluded that a double active space, one long and the other short, corresponding to the two dif-ferent S. litura pheromone components, was the most effective model for explaining male attraction. For
G.
molesta the three components used in this study act as
a unit in influencing all stages of behavior (Baker and Carde, 1979a). Hence, only one active space need be considered, that produced by the entire blend and its corresponding thresholds of initiation and termination of upwind flight.
The equations of Sutton (1953) for molecular diffu-sion in wind, and Bossert and Wilson (1963) for the corresponding above-threshold molecular concentration, or "active space", have been the most widely used for describing pheromone concentration effects under vary-ing wind conditions. Bossert and Wilson's equation for maximum active distance, XI/IIIJ' of a
continually-emit-ting pheromone source in moderate wind is:
( 2 Q )1/2-n XlllaJ = K7T C C U
y z
Where Q is the emission rate, K is the male response threshold, U is the average wind velocity, Cy and Cz
are diffusion constants determined by wind profile and surface roughness, and 11 is an undetermined constant. Since emission rates, Q, for 10, 100, and 1000 /Jogsepta of Z8-12:Ac in still air at 23°C are 1.2, 12, and 219 ng/ h (Baker et aI., 1980), these values may be substituted into the above equation for Q. Then, solving forK and using the suggested values (Sutton, 1953) of 0.4 cml/H,
April 1981
three threshold estimates starting with the lowest of the three emission rates are 2.13
x
10-17, 4.50 X 10⁻¹⁷,and 1.50 x 10⁻¹⁶ g/cm3. Average wind speed U, was
0.51 m/ sec. These values of K, within an order of magnitude of each other, indicate that our maximum active distance measurements conform closely to those predicted by the Bossert and Wilson equations. Some possible reasons for the observed variations are: the val-ues substituted for the constants Cy, Cz, and n may not be correct for the average wind speed and surface rough-ness in our experiments; the emission rate values cal-culated in still air may not vary linearly with wind ve-locity; and the initiation of upwind flight in males may have been due to instantaneous peak concentrations rather than the time-averaged concentration required by Sutton's and therefore, Bossert and Wilson's equation.
Using the same formula, we calculated the upper thresholds for upwind flight dictated by the average dis-tance where upwind flight terminated (Table 3). These
Xlllfl,. values of 0.20 and 1.55 m for the 100 and 1000
J.tg septa (Q for each as before) result in upper thresholds of 2.7 x 10⁻¹³ and 1.4 x 10⁻¹³ g/cm3, respectively.
Interestingly, the average upper threshold of 2.1 x 10⁻¹³
g/cm3 is about 3,000 times higher than the average lower
threshold, 7.2 x 10⁻¹⁷ g/cm3• Thus, for this blend, the
active distance boundaries for upwind flight are dictated by threshold limits differing by only a little more than 3 orders of magnitude, seemingly a narrow concentration range. The data for termination of upwind flight give an idea of the steepness of the time-averaged concentration gradient near the source (Table 3). Assuming a constant threshold, an 18-fold increase in effective concentration (12 ng/hr to 219 ng/hr) must have occurred in the 135 cm from 20 cm to 155 cm from the source where upwind flight stopped. Clearly, Bossert and Wilson's model must be altered so that active space is defined as the space where pheromone concentration is within both lower and upper thresholds for a particular behavior.
We do not know whether other blends have more restricted threshold ranges and correspondingly nar-rower active distance boundaries, but field observations of males flying upwind to a range of (E)-(2) ratios in-dicate that the upper threshold is probably lower to treat-ments with increasing (E) (Baker and Card6, 1979a). Males did not approach as closely to the dispenser, ex-hibiting reduced tolerance to too much (E). This should create a more restricted active distance, provided the lower threshold did not also become lower, and would explain reduced male captures to those blends (Baker and Carde, 1979a). On the other hand, trap catch data from a variety of species implies that non-optimal blends can duplicate the threshold span of the optimal blend, but behavioral observations are needed to test this hy-pothesis (Roelofs 1978).
It is clear that for a particular blend in pheromone trapping, exploiting the full range of emitted concentra-tions between the lower and upper thresholds would be desirable for trapping over the widest possible area, whereas an emission concentration slightly above the lower threshold would be best when a smaller drawing range is needed. Further work should provide insight as to how changes in blend quality alter the range of
be-haviorally "active" concentrations delimiting an active space.
Acknowledgment
We thank W. Meyer for excellent technical assistance in the field and laboratory, and F. Wadhams. B. Carney, and K. Poole for rearing G. molesta adults.
REFERENCES CITED
Armstrong, T. 1929. Notes on the life history of the Oriental peach moth at Vineland Station. Rep. Entomo!. Soc. Onto 59: 65-72.
Baker, T. C., and R. T. Carde. 1:1790. Analysis of phero-mone-mediated behavior in maleGrapholitha mo/esta, the Oriental fruit moth, (Lepidoptera: Tortricidae). Environ. Entomo!. 8: 956-68.
Baker, T. C., and R. T. Carde. 1979b. Endogenous and exogenous factors affecting female calling and male sex pheromone response inGrapholitha mo/esta (Busck). J.
Insect Physio!. 25: 943-50.
Baker, T. C., R. T. Carde, and J. R. Miller. 1980. Oriental fruit moth pheromone component release rates measured after collection by glass surface absorption. J. Chern. Ecol. 6: 749-58.
Biwer, G., C. Descoins, and M. Gallois. 1979. Etude des constituants volatils presents dans la glande productrice de pheromone de la femelle vierge deGrapho/itha mo/esta
Busck, Lepidoptere tortricidae (Olethreutinae) C. R. Acad. Sc. Paris, t. 288: 413-6.
Bossert, W. H., and E. O. Wilson. 1963. The analysis of olfactory communication among animals. J. Theoret. BioI. 5: 443-69.
Carde, A. M., T. C. Baker, and R. T. Carde. 1979. Iden-tification of a four-component sex pheromone of the fe-male Oriental fruit moth,Grapho/itha mo/esta (Lepidop-tera: Tortricidae). J. Chern. Ecol. 5: 423-7.
Carde, R. T. 1979. Behavioral responses of moths to female-produced pheromones and the utilization of attractant-baited traps for population monitoring.In R. L. Rabb and G. G. Kennedy (eds.). Movement of highly mobile in-sects: concepts and methodology in research. North Car-olina St. Univ., pp. 286-301.
Carde, R. T., T. C. Baker, and W. L. Roelofs. 1975. Eth-ological function of components of a se· attractant system for Oriental fruit moth males,Grapholitha molesta (Lep-idoptera: Tortricidae).J. Chern. Ecol. I: 475-91. Miller, J.R., and W. L. Roelofs. 1978. Sustained-flight
tun-nel for measuring insect responses to wind-borne sex pher-omone. J. Chern. Ecol. 4: 187-98.
Nakamura, K. 1976a. The effect of wind velocity on the diffusion ofSpodoptera litura (F.) sex pheromone. App!. ent. Zool. 4: 312-9.
Nakamura, K. 1976b. The active space of the pheromone of
Spodoptera litura and the attraction of adult males to the pheromone source, pp. 145-55. "Insect Pheromones and Their Applications. " Proceedings of a symposium on in-sect pheromones and their applications. Nagaoka and To-kyo. December 8- I I, 1976.
Nakamura, K. 1979. Effect of the minor component of the sex pheromone on the male orientation to pheromone source inSpodoptera litura (F.), Xemop. Hac. 4: 153-6. Reichart, G., and J. Bodor. 1972. Biology of the Oriental
fruit moth(Grapho/itha molesta Busck) in Hungary. Acta Phytopathol. Acad. Sci. Hung. 7: 279-95.
Reidl, H., B. A. Croft, and A.J.Howitt. 1976. Forecasting codling moth phenology based on pheromone trap catches and physiological-time models. Can. Entomo!. 108: 449-60.
218
Roelofs, W. L. 1978. Threshold hypoIhesis for pheromone perception. J. Chern. Ecol. 4: 685-99.
Roelofs, W. L., and R. T. Carde. 1974. Orienlal fruit moth and lesser appleworm attractant mixtures refined. Environ. Entomol. 3:586-8.
Roelofs, W. L., A. Comeau, and R. SeUe. 1969. Sex pher-omone of the Orienta] fruit moth. Nature 244: 723. Rothschild, G. H. L., and A. K. Minks. 1974. Time of
activity of male Oriental fruit moths at pheromone sources in the field. Environ. Entomol. 3: 1003-7.
Sutton, O. G. 1953. "Micrometeorology." McGraw-Hili, New York. 333 pp.
Welch, S. M., B. A. Croft, J. F. Brunner, and M. F. Mich· els. 1978. PETE: an extension phenology modeling sys-tem for management of multi-species pest complex. En-viron. Entomol.7: 487-94.