Thermostatic Voting: Presidential
Elections in Light of New Policy Data
Jørgen Bølstad,Center for Comparative and International Studies, ETH Zurich
ABSTRACT
Existing studies imply a model of “thermostatic voting”—a phenomenon
char-acterized by negative feedback from government policy to election outcomes, suggesting
that a party’s success in setting policy diminishes its electoral prospects. This
phenom-enon could give politicians an incentive to constrain the fulfillment of public demands,
which would conflict with the notion of electoral accountability, which also forms part of
the theoretical framework in question. This article addresses this paradox and provides
new data that expand an existing time series of American policy liberalism. Employing the
new data, the article identifies thermostatic voting in American presidential elections, but
in light of the analysis, certain empirical features are also identified that reduce the
possi-ble incentive to withhold promised policy changes.
D
o election outcomes reflect the extent to whichcur-rent government policy is liberal or conservative? A set of existing studies implies so. Wlezien (1995, 1996) argues public opinion works as a thermo-stat in the sense that policy preferences respond negatively to policy change. Thus, liberal policies, for example, result in a less liberal public (see also Erikson, MacKuen, and Stimson 2002). Related studies further argue public opinion influ-ences election outcomes, as less liberal preferinflu-ences translate into fewer liberal votes (Erikson, MacKuen, and Stimson 2002; Stim-son 1999b). Although these studies imply that current govern-ment policy shapes election outcomes through public opinion, this implication has not been subjected to direct empirical inquiry, nor has it received thorough theoretical discussion.
The implication that votes reflect current policy is referred to in this article as “thermostatic voting:” More liberal policy satisfies the demands of a liberal few, and with less demand for additional liberal policies, liberal candidates receive fewer votes. The follow-ing paradox presents itself: Political actors elected with the help of a particular public mood, and who in turn respond to the public’s demands as promised, may diminish their own electoral pros-pects. Thus, politicians may have an incentive to withhold prom-ised changes to avoid satisfying the demands that got them elected into office. This incentive would conflict with the model of elec-toral accountability, which assumes it is rational for politicians to respond to public demands in an accurate way to avoid electoral
defeat. The tension between these two models poses a challenge to the theoretical framework, as this framework contains them both (Erikson, MacKuen, and Stimson 2002; Stimson, MacKuen, and Erikson 1995; see also Soroka and Wlezien 2004, 2005, 2010; Stim-son 1999a, 2004; Wlezien 2004).
Although the existing literature rests on a sound empirical foun-dation, the analyses rely on a limited number of observations with respect to presidential elections. This article therefore provides new data that expand an existing time series of American policy liberalism so that it covers the period from 1947 to 2008, which encompasses fifteen presidencies. The new data test the hypoth-esis of thermostatic voting, and the hypothhypoth-esis does receive sup-port. Given the tension between the models of thermostatic voting and electoral accountability, the article concludes with a discus-sion of how certain features of the empirical results may allow for the presence of both.
BACKGROUND
Whereas voters long appeared disappointingly uninformed about politics, and their policy preferences seemed random and incoher-ent,1Stimson’s Public Opinion in America demonstrates that the
preferences of American citizens conform to a coherent overall pattern, referred to as their public policy mood (Stimson 1991, 1999b; Stimson, MacKuen, and Erikson 1994). Stimson further argues the single dimension of liberalism versus conservatism suf-fices to capture the mood of the American public.2Because the
items that make up this dimension tend to be issues of more or less government, Stimson’s measure of mood captures policy pref-erences that are relative to current policy.
Classic system theories of democracy suggest that such rela-tive policy preferences respond to policy outputs and generate
Jørgen Bølstad is a post-doctoral researcher in European politics at the Center for Comparative and International Studies (CIS), ETH Zurich, Switzerland. He was a Fulbright Fellow at Harvard University, 2010–2011, and obtained his PhD from the European University Institute in Florence, Italy. He can be reached at j.boelstad@alumni.lse.ac.uk.
...
https:/www.cambridge.org/core
. University of Basel Library
, on
11 Jul 2017 at 15:40:56
, subject to the Cambridge Core terms of use, available at
https:/www.cambridge.org/core/terms
.
its relative preference [. . .]—represents the difference between the public’s preferred level of policy [. . .] and policy [. . .] itself” (Wle-zien 1995, 985–986, see also Erikson, MacKuen, and Stimson 2002; Franklin and Wlezien 1997; Soroka and Wlezien 2010). Whereas Wlezien applies this model to spending in specific policy areas, this model has also been applied to the liberal-conservative dimen-sion (Erikson, MacKuen, and Stimson 2002, 325–382). The public’s preferred level of policy along this dimension is referred to in this article as its Preference, and its relative preference as Mood. Thus, Wlezien’s model can be expressed as:
Moodt⫽ Preferencet⫺ Policyt⫺l, (1)
where the subscript t refers to time and l is the appropriate lag of policy (depending on how quickly the public takes notice of new policies). This model implies that mood will be positively affected by an increase in the public’s preference and negatively affected by an increase in policy.3
Looking at the effect of mood on policy, Stimson, MacKuen, and Erikson (1995) argue “dynamic representation” takes place in the United States (see also Erikson, MacKuen, and Stimson 2002). In other words, policy changes when mood changes, so that the former tracks the latter over time. For example, a more liberal public mood results in more liberal policies. Two mechanisms are said to account for this relationship. One is that of “rational anticipation”—the notion that politicians adapt to changes in mood to avoid electoral defeat. The other is the “turnover” mechanism— the notion that mood influences election outcomes, putting new politicians in power and, thus, indirectly affecting policy. More specifically, a liberal mood is expected to translate into a larger liberal (i.e., Democratic) vote share, and ultimately to more liberal policies. Accordingly, a few studies attempt to explain presiden-tial elections by the current mood (Erikson, MacKuen, and Stim-son 2002, 237–283; StimStim-son 1999b, 97–120).4
Although both the effect of policy on mood and the effect of mood on presidential elections have received empirical support, neither is as firmly established as one might expect. Looking at the impact of mood on presidential elections, Stimson (1999b) analyses 11 observations of the national vote. Erikson, MacKuen, and Stimson (2002, 243) regret that “between 1952 and 1996,” they “have a scant 12 observations of presidential elections for statis-tical analysis,” and state “any statisstatis-tical results must remain ten-tative and open to rival interpretation.” This article adds to policy data presented in current literature and focuses on the hypothesis of thermostatic voting, which is presented in the following text. This approach allows more elections to be included in the analy-sis, and a positive result will increase confidence in earlier findings. THERMOSTATIC VOTING AND ELECTORAL
ACCOUNTABILITY
Taken together, the earlier studies imply that election outcomes, in terms of support for one party rather than the other, react to policy. If elections are influenced by mood and mood is influ-enced by policy, then elections must be influinflu-enced by policy. The effect of policy on elections is referred to here as thermostatic voting. If the liberal end of the liberal-conservative dimension is
where a is a constant, b is a coefficient, « is an error term captur-ing all other influences, and equation 1 is used to replace mood in the last part. In terms of change we have:
DDemocratic Votet⫽ bD~Preferencet⫺ Policyt⫺l!⫹ «t+ (3) The negative feedback of policy in this model is rather paradoxi-cal. For example, it suggests a Democratic incumbent will lose votes by enacting liberal policies, as the public’s mood will grow more conservative.5In other words, political actors elected with
the help of a public mood, and who subsequently respond to the public’s demands as promised, may diminish their own electoral prospects. This electoral reaction could give politicians an incen-tive to constrain the fulfillment of public demands to avoid satis-fying the mood that helped elect them into office.
Thus, the model of thermostatic voting stands in notable con-trast to that of electoral accountability, which instead requires voters to punish poor representation of voter preferences (e.g., Maravall and Sánchez-Cuenca 2007; Przeworski, Stokes, and Manin 1999). According to the latter model, a Democratic incum-bent should not be losing votes by satisfying a liberal policy mood, but rather by failing to do so. This idea is also reflected in the theory of dynamic representation, as the mechanism of rational anticipation assumes it is rational for politicians to please the electorate in terms of policy (Erikson, MacKuen, and Stimson 2002; Stimson, MacKuen, and Erikson 1995). The idea of electoral accountability suggests the incumbent will gain votes if the gap between policy and the public’s preference is decreased, and lose votes if the gap grows. In other words, the incumbent will be rewarded for reducing the absolute value of mood, and punished for increasing it, as expressed by this model:
DIncumbent Votet⫽ ⫺bD6Moodt6⫹ «t
⫽ ⫺bD6Preferencet⫺ Policyt⫺l6⫹ «t+ (4) In the case of a Democratic incumbent, for whom the model is more easily compared to the preceding models, we have:
DDemocratic Votet⫽ ⫺bD6Preferencet⫺ Policyt⫺l6⫹ «t+ (5) In other words, for a Democratic incumbent, the models of ther-mostatic voting (equation 3) and electoral accountability (equa-tion 5) overlap when policy is more liberal than the public’s preference, so that mood is conservative. A Democratic incum-bent enacting liberal policies will then lose votes according to both models. The models conflict, however, when the public’s pref-erence is more liberal than current policy so that mood is liberal, which is a likely situation for a newly elected Democrat. In this situation, electoral accountability suggests that satisfying the lib-eral mood by enacting liblib-eral policies will be rewarded, whereas thermostatic voting suggests the opposite. To test the hypothesis of thermostatic voting and to facilitate further research on these topics, this article provides new policy data through a brief review of recent American political history.
MEASURING CURRENT POLICY
Erikson, MacKuen, and Stimson (2002, 328–336, 374–380) con-struct a measure of policy that works well in relation to mood,
https:/www.cambridge.org/core
. University of Basel Library
, on
11 Jul 2017 at 15:40:56
, subject to the Cambridge Core terms of use, available at
https:/www.cambridge.org/core/terms
.
and it is used here as well. They code the ideological content of enactments seen as important at the time, as listed by Mayhew (1991). Their data cover the period from 1953 to 1996, which would only allow the analysis of 10 presidential elections (given the appro-priate lag).6However, this is an unnecessarily short series.
May-hew’s first investigation starts with 1947, and he continues to make available lists of more recent enactments (the more recent sources of relevance are: Mayhew 2005, 2008, 2009a, 2009b). To strengthen the analysis, this article provides new policy data for the years from 1947 to 1952 and from 1997 to 2008. This means that 5 addi-tional elections can be included in the analysis.
The data have been produced in accordance with Erikson, MacKuen, and Stimson’s procedures which means that enact-ments relating to agriculture or foreign or defense policy, and those with a predominantly local impact, have been excluded. Erikson, MacKuen, and Stimson’s strategy of coding the content based on their own judgment of “whether the law was seen by contemporary observers as moving policy in a conservative or a liberal direction” has also been pursued here (Erikson, Mac-Kuen, and Stimson 2002, 330). Such coding inevitably relies on subjective judgment, and it involves many tough decisions, some of which are discussed in the text that follows. Several enact-ments have been omitted because they were trade-offs or had an ambiguous content. Scholars who disagree with particular cod-ing decisions, but who would like to use these data, are invited to revise the coding.
A few additional coding decisions are worth mentioning. Enactments with a “triggering cause more or less external to American national politics” (Mayhew 2005, 136) have not been excluded automatically. Such enactments have often been per-ceived as involving important policy changes, and they reflect the political environment of their time. Enactments with sunset clauses have neither necessarily been excluded, as their enact-ment often has been seen as (at least signaling) important policy changes, in contrast to their termination.
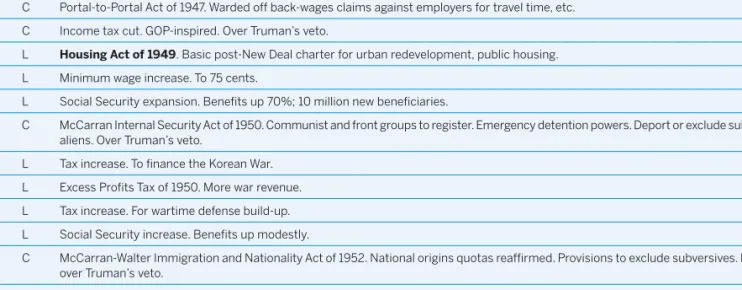
Table 1 reports the enactments coded from 1947 to 1952. Enact-ments judged by Mayhew to have been exceptionally important at the time are in bold. The most difficult cases in this period are the three temporary tax increases made to finance the Korean War. Because the war could have been financed in other ways, and in accordance with the procedures laid out earlier, these bills have all been counted as liberal.
From 1991 to 1996, Erikson, MacKuen, and Stimson’s data were not based on Mayhew, but generated using similar procedures.7
Comparison with a coding of Mayhew’s later published data sug-gests a high level of reliability. Nevertheless, there are a few dis-agreements, and, in these cases, the measure used in this article follows Mayhew. Note, however, that this adjustment is so mar-ginal it has no notable effect on the results. Mayhew’s coding is preferred for consistency—it now serves as basis for the whole dataset. The relevant disagreements are the following: Erikson, MacKuen, and Stimson do not count the Omnibus Energy Act of 1991, which here is scored as liberal. In 1996 they count as conser-vative a bill regarding same sex marriages that is not counted by Mayhew, and therefore is disregarded here. In the same year, they leave out an overhaul of pesticides regulation that is counted by Mayhew, and in this article it is coded as liberal.
Table 2 reports the coded enactments from 1997 to 2004.8A
dominant feature of this period was the terrorist attacks of Sep-tember 11, 2001. Eight enactments could be identified as triggered by these events. Assessing their ideological content and deciding whether to count these enactments is often hard. After consider-ation of each, in light of the generally applied criteria, only three remain in the table: the 2001 Patriot Act, the airline security bill of the same year, and the 2002 terrorism insurance bill. The first and the last of these enactments have been counted as liberal. This coding may seem to place the threshold too low, but excluding these enactments would seem too restrictive compared to Erik-son, MacKuen, and Stimson.9Another hard case in this period is
the 2003 reform of Medicare, which was criticized both for being
Ta b l e 1
Important Enactments, 1947–1952, Scored for Ideological Content and Importance
YEAR LEGISLATION
1947 C Taft-Hartley Labor-Management Relations Act of 1947. Major anti-union rollback of Wagner Act. Enacted over Truman’s veto. 1947 C Portal-to-Portal Act of 1947. Warded off back-wages claims against employers for travel time, etc.
1948 C Income tax cut. GOP-inspired. Over Truman’s veto.
1949 L Housing Act of 1949. Basic post-New Deal charter for urban redevelopment, public housing. 1949 L Minimum wage increase. To 75 cents.
1950 L Social Security expansion. Benefits up 70%; 10 million new beneficiaries.
1950 C McCarran Internal Security Act of 1950. Communist and front groups to register. Emergency detention powers. Deport or exclude subversive aliens. Over Truman’s veto.
1950 L Tax increase. To finance the Korean War. 1950 L Excess Profits Tax of 1950. More war revenue. 1951 L Tax increase. For wartime defense build-up. 1952 L Social Security increase. Benefits up modestly.
1952 C McCarran-Walter Immigration and Nationality Act of 1952. National origins quotas reaffirmed. Provisions to exclude subversives. Enacted over Truman’s veto.
Note: L represents a liberal change in policy, and C a conservative one. Exceptionally important enactments ~according to Mayhew! are in bold.
Source: Mayhew ~2005!.
T h e r m o s t a t i c Vo t i n g
...
https:/www.cambridge.org/core
. University of Basel Library
, on
11 Jul 2017 at 15:40:56
, subject to the Cambridge Core terms of use, available at
https:/www.cambridge.org/core/terms
.
too expensive and for assigning the private sector too large a role. This reform could have been excluded as an ideological trade-off, but it has been kept on the list as a mainly welfare-expanding ( liberal ) measure.
Table 3 reports the coded enactments from 2005 to 2008. In this period, another four enactments can be seen as triggered by September 11. Two of these have been kept as conservative mea-sures: the 2006 Military Commissions Act and the 2008 Domestic Surveillance Act. In 2008, the financial crisis triggered three major enactments: the $168 billion stimulus package, the housing relief program, and the $700 billion financial sector bailout. Although these enactments were in part criticized for being too supportive of business, they all have been counted as liberal measures, involv-ing greater governmental intervention in the economy.
Based on the enactments listed in tables 1, 2, and 3, and the slightly revised version of Erikson, MacKuen, and Stimson’s list for the years in between, a measure of current policy liberalism has been created. Liberal enactments have been coded as 1 and conservative enactments as⫺1. In addition, enactments listed as exceptionally important by Mayhew have been given double weight. Then, for each year, all bills enacted into law by the end of the year have been cumulated to produce a measure of cumulative policy liberalism. However, as Erikson, MacKuen, and Stimson note, most enactments are liberal, and political battles can be seen as mainly revolving around the pace of liberal legislation. This observation can be taken into account by using the overall trend as a base from which to view the status quo. To achieve this, the
cumulative measure has been regressed on time. The set of resid-uals obtained from this regression measure cumulative policy lib-eralism with the linear trend removed and is referred to as Policy. Erikson, MacKuen, and Stimson (2002, 348) lag policy by two years when they predict mood, while they use the current mood to predict election outcomes. As their analyses thus imply a two-year lag for the effect of policy on elections, a two-two-year lag is used here as well.
ANALYSIS
As mentioned, the main hypothesis presented is that when cur-rent policy is more liberal, the Democratic candidate receives fewer votes, and vice versa. The number of variables in the analysis is kept to a minimum due to the limited number of observations. Along with policy, only a variable representing the incumbency advantage is included. This variable, which has proven relevant in prior studies (e.g., Stimson 1999b, 97–120), is included because of its theoretical importance, which will be discussed in the text that follows. Thus, the main equation to be estimated is this:
Democratic Votet⫽ a ⫹ b * Policyt⫺l⫹ g * Incumbencyt⫹ «t, (6) where b is expected to be negative, g is expected to be positive, and variation in the public’s non-relative policy preference is cap-tured by the error term.
Leaving policy aside, the operationalization of the variables is straightforward. The dependent variable is the Democratic presidential candidate’s share of the combined Democratic and
1997 L Deal to balance the budget by 2002. $263 billion in spending cuts; $95 billion in tax cuts; $33 billion for new children’s health insurance; new $500 child tax credit.
1997 L Adoption of foster children. To ease the process.
1998 L Transportation construction. $218 billion for highways and mass transit. 1998 C Overhaul of Internal Revenue Service. More rights and protections to taxpayers. 1998 L 100,000 new school teachers. A Clinton plan.
1999 C Y2K planning. To limit firms’ liability for new-millennium computer mix-ups.
2000 L Community Renewal and New Markets Act. $25 billion over 10 years for development in poor locales.
2001 C Bush tax cut. $1.35 trillion over 10 years; rate cuts; phase-out of estate tax; ease marriage penalty; expansion of child tax credit. 2001 C USA Patriot Act. Broad new authority to president to track, arrest, and prosecute domestic terrorists.
2001 L Airline security. New government program to hire 30,000 airport screeners. 2001 L Education reform. To require annual student testing; $263 billion in new funds. 2002 L Campaign finance reform. To ban soft money and certain pre-election ads.
2002 L Corporate Responsibility Act. To regulate the accounting industry and crack down on corporate fraud. After the collapse of Enron. 2002 L Election reform. New nationwide standards; $3.9 billion to help the states meet them.
2002 L Terrorism insurance. $100 billion back-up against future attacks; to aid insurance and real-estate industries.
2003 L Medicare reform. New prescription drug benefit; large new role for private health plans. To cost a projected $400 billion over a decade. 2003 C $350 billion tax cut. Bush administration plan. Cuts for families, investors, businesses.
2003 C Partial Birth Abortion Ban Act of 2003.
2004 C Unborn Victims of Violence Act. “Laci and Connor’s law.” Makes it a crime to harm a fetus during commission of a violent federal crime. Note: L represents a liberal change in policy, and C a conservative one. Exceptionally important enactments ~according to Mayhew! are in bold.
Sources: Mayhew ~2005, 2008!.
https:/www.cambridge.org/core
. University of Basel Library
, on
11 Jul 2017 at 15:40:56
, subject to the Cambridge Core terms of use, available at
https:/www.cambridge.org/core/terms
.
Republican votes. The data are from the US Census Bureau (2008) and Federal Election Commission (2009). Although imperfect, the two-party vote share is a convenient expression of the sup-port for one major party relative to the other, leaving out third-party candidates. The incumbency advantage is represented by a variable referred to as Incumbency. It has been scored 1 when a Democratic president is seeking re-election, 0 when a Republi-can is, and .5 otherwise.10As a final step, the policy variable has
been recoded so that it takes on a maximum of 1 and minimum of 0, making the magnitude of its effect more readily interpret-able and comparinterpret-able.
The results of the analyses are reported in table 4. Model 1 includes only policy and shows a sizeable coefficient for this vari-able. The coefficient has the expected sign and it is significant at the 5% level. Measured by the adjusted R2, it explains 13% of the
variance. Model 2 contains only the incumbency variable. This variable also has a sizeable and significant coefficient with the expected sign, explaining a fourth of the variance. Model 3 includes both variables, which increases the explained variance to 41%. The two estimates are hardly changed, while their standard errors are reduced, underlining that this is a better-specified model.11
The identified feedback from policy to election outcomes is not only statistically significant, but also of a considerable mag-nitude. When policy is at its most liberal, as opposed to most conservative, support for the Democratic candidate in terms of the two-party vote is lower by more than eight percentage points.12
The corresponding standardized regression coefficient is⫺0.44. Figure 1 illustrates the effect of policy, plotting it over time together with residual vote shares, taken from model 2, which only includes
the incumbency advantage. As the effect of policy is negative, the residuals have been reversed to ease interpretation. Thus, the resid-uals refer to Republican votes, while liberalism still scores high with regard to policy. The policy measure used here is the same as noted earlier, except it is not lagged. Thus, not surprisingly, the plot appears to show a lagged effect of policy, in accordance with earlier studies.
Ta b l e 3
Important Enactments, 2005–2008, Scored for Ideological Content and Importance
YEAR LEGISLATION
2005 C Bankruptcy reform. Makes it harder for consumers to shed their debts.
2005 C Class Action Fairness Act. Shifts class-action suits to federal courts, making it harder to bring them against businesses. 2005 L $286 billion transportation measure. Funds for highways, mass transit, a record 6,371 pet member projects.
2006 L Pension reform. To shore up often-shaky private retirement programs for 44 million workers and retirees. 2006 C Military Commissions Act. Sets rules for the government to prosecute terrorism suspects in military tribunals.
2007 L Minimum wage hike. Raised to $7.25 per hour in three stages over two years. Combined with $4.84 billion in tax breaks for small businesses. 2007 L Ethics and lobbying reform. New restrictions on gifts, meals, and travel supplied by lobbyists, and on the “revolving door” into the private
sector.
2007 L Overhaul of college student aid programs. Subsidies to private lenders cut; grants to needy students increased.
2007 L Energy conservation. Includes boost in fuel-efficiency standards for automobiles, biofuels subsidies, phase-out of incandescent light bulbs.
2008 L $168 billion economic stimulus package. Includes rebates to taxpayers, tax incentives for business investment.
2008 L Housing relief program. Includes $300 billion authorization to insure home mortgages; rescue and tightened regulation of Fannie Mae and Freddie Mac.
2008 L $700 bailout of the financial sector. Combined with $150 billion dollar in tax breaks.
2008 C Domestic Surveillance Act. Major expansion of federal anti-terrorism surveillance powers asked by Bush; telecoms immunized against liability for previous wiretapping.
2008 L New G.I. bill for veterans. $62.8 billion over 11 years to guarantee a four-year college education.
2008 L Guarantee of mental illness insurance. Insurance companies required to cover mental and physical illnesses equally. Note: L represents a liberal change in policy, and C a conservative one. Exceptionally important enactments ~according to Mayhew! are in bold.
Sources: Mayhew ~2009a, 2009b!.
Ta b l e 4
Models of Democratic Two-Party Vote
Shares in American Presidential Elections,
1952–2008
MODEL 1 MODEL 2 MODEL 3
Policy −8.411** −8.349** ~4.744! ~3.926! Incumbency 8.743** 8.702** ~3.713! ~3.293! Constant 53.129*** 44.914*** 49.326*** ~2.876! ~2.089! ~2.782! N 15 15 15 AdjustedR2 0.13 0.25 0.41 Chi2 0.199 0.270 0.017
Note: ***p< .01, **p< .05, *p< .10, in one-tailed tests. Standard errors are reported in parentheses.Chi2-entries refer to Breusch-Godfrey ~LM! tests for first-order
auto-correlation.
T h e r m o s t a t i c Vo t i n g
...
https:/www.cambridge.org/core
. University of Basel Library
, on
11 Jul 2017 at 15:40:56
, subject to the Cambridge Core terms of use, available at
https:/www.cambridge.org/core/terms
.
DISCUSSION
The analysis supports the notion that thermostatic voting takes place in American presidential elections. When policy is more liberal, the Democratic candidate receives fewer votes, and vice versa. On closer inspection, however, the results not only support the hypothesis derived from the literature, but also do so in a way that seems compatible with the model of electoral accountability. The empirical model has two features that may reduce the possi-ble incentive for presidents to withhold policy changes.
The first feature is the lag with which the public responds to policy change. Although it is hard to ascertain its exact form, it is clear that policy changes tend to have a weaker effect on the first election following them than they do on later elections. This lag may thus shield first-term presidents from some of the feedback they would otherwise have faced in their second election.
The second feature is the incumbency advantage. Given the amount of policy change during an average presidency and the size of the incumbency advantage, the latter should generally over-shadow the negative feedback of policy for presidents seeking re-election. This is important, as these presidents are exactly the ones who might otherwise have had the most reason to be con-cerned. Moreover, in the analysis presented in this article, as in earlier studies, the effects of incumbency and policy have been modeled as independent of each other, although it is possible that policy change contributes to the incumbency advantage, or at least is required to retain it.13Incumbent presidents may partly gain
their advantage by delivering popular policies. Several of the mech-anisms proposed to explain the incumbency advantage, such as “credit claiming,”14might allow for such a link to policy change.
This possible link could remove any short-term incentive to con-strain the fulfillment of public demands.
Together, the lag and the incumbency advantage suggest ther-mostatic voting is more strongly felt in the long run and in elec-tions in which the incumbent president is not running. The latter is almost exclusively the case when a president has reached the term limit, and thus has had a significant chance to influence policy. Accordingly, presidents’ successor candidates tend to be greatly disadvantaged. The only apparent exception to this rule would be if these candidates could share in the incumbency advantage—a possibility illustrated by the widely held belief that
N O T E S
The author wishes to thank Mark Franklin, Carolien van Ham, Till Weber, and anony-mous reviewers for valuable feedback. He is also grateful for support from the European University Institute, the Fulbright Foundation, and the Norwegian Research Council (project no. 184566).
1. See, for example, Berelson, Lazarsfeld, and McPhee (1954), Campbell et al. (1960), or Converse (1964, 1970).
2. This conclusion could be challenged based on the fact that the items available for analysis have been selected by pollsters (see Best 1999), but in this article, as in the extant literature, this one-dimensional model is used.
3. It also implies that policy and the public’s preference are measured on compa-rable scales, as no coefficients are included. Neither is a constant included in this definition, which means that mood is 0 when policy equals the public’s preference. Asking people in surveys “how much” government they would like is generally not a viable option, however, so we cannot normally know this preference and this issue is therefore mostly of theoretical relevance. 4. Other studies have focused on house elections (e.g., De Boef and Stimson
1995).
5. For simplicity, these illustrations use the case of a Democratic incumbent, but note that equivalent illustrations could be made referring to a Republican one.
6. After 1990, their data are not based on Mayhew’s work (see later paragraph). 7. The initial list of important enactments was made by Jay Greene (Erikson,
MacKuen, and Stimson 2002, 329–330).
8. Contemporary articles and comments in The New York Times have been used as sources on how the enactments were perceived.
9. Setting the threshold higher would not noticeably affect the reported results. 10. However, two special cases arise because the candidates were vice presidents
who assumed presidency before the election: Lyndon B. Johnson, after the assassination of John F. Kennedy, and Gerald Ford, after the resignation of Richard Nixon, following the Watergate scandal. As this scandal probably caused as much damage as holding office gave an advantage, the latter case has been coded as 0.5 (whereas the other case has been coded as 1). 11. This model also performs well in terms of diagnostic tests. Tests for
auto-regressive autocorrelation (Breusch-Godfrey), autoauto-regressive conditional het-eroskedasticity (Engle’s ARCH), and hethet-eroskedasticity conditional on fitted values (Breusch-Pagan) do not indicate that the residuals of this model are nonspherical. Moreover, the Dickey-Fuller test indicates that the residuals are significantly stationary.
12. This result does not appear dependent on specific modeling choices. Nor is it driven by any particular election, judging by jackknifed regressions, and stan-dard errors based on these.
13. This idea can only be tested if properly specified, which first would require the development of a more elaborate theory. Therefore, and also because of the few available degrees of freedom, this idea has not been incorporated in the analysis presented. It is, however, an interesting topic for further research. 14. Although Mayhew (1974) introduced this term with regard to congressional
incumbency advantages, the term appears just as relevant with regard to pres-idents, as Weisberg (2002) notes.
R E F E R E N C E S
Berelson, Bernard R., Paul F. Lazarsfeld, and William N. McPhee. 1954. Voting: A Study of Opinion Formation in a Presidential Campaign. Chicago: University of Chicago Press.
Best, Samuel J. 1999. “The Sampling Problem in Measuring Policy Mood: An Alternative Solution.” Journal of Politics 61 (3): 721–40.
Campbell, Angus, Philip E. Converse, Warren E. Miller, and Donald E. Stokes. 1960. The American Voter. New York: Wiley.
Converse, Philip E. 1964. “The Nature of Belief Systems in Mass Publics.” In Ideol-ogy and Discontent, ed. D. E. Apter. New York: Free Press.
Converse, Philip E. 1970. “Attitudes and Non-attitudes: Continuation of a Dia-logue.” In The Quantitative Analysis of Social Problems, ed. E. R. Tufte. Reading, MA: Addison-Wesley.
Note: The vote residuals have been obtained from a regression only including the incumbency advantage.
https:/www.cambridge.org/core
. University of Basel Library
, on
11 Jul 2017 at 15:40:56
, subject to the Cambridge Core terms of use, available at
https:/www.cambridge.org/core/terms
.
De Boef, Suzanna, and James A. Stimson. 1995. “The Dynamic Structure of Con-gressional Elections.” Journal of Politics 57 (3): 630–48.
Deutsch, Karl. 1963. The Nerves of Government: Models of Political Communication and Control. New York: The Free Press of Glencoe (Macmillan).
Easton, David. 1953. The Political System: An Inquiry into the State of Political Sci-ence. New York: Alfred A. Knopf.
Easton, David. 1965. A Systems Analysis of Political Life. New York: Wiley. Erikson, Robert S., Michael B. MacKuen, and James A. Stimson. 2002. The Macro
Polity. Cambridge: Cambridge University Press.
Federal Election Commission. 2009. “2008 Official Presidential General Election Results.” www.fec.gov/pubrec/fe2008/2008presgeresults.pdf (August 23). Franklin, Mark N., and Christopher Wlezien. 1997. “The Responsive Public: Issue
Salience, Policy Change, and Preferences for European Integration.” Journal of Theoretical Politics 9 (3): 347–63.
Maravall, José María, and Ignacio Sánchez-Cuenca, eds. 2007. Controlling Govern-ments: Voters, Institutions, and Accountability. Cambridge: Cambridge University Press.
Mayhew, David. 1974. Congress: The Electoral Connection. New Haven, CT: Yale University Press.
Mayhew, David. 1991. Divided We Govern: Party Control, Lawmaking, and Investiga-tions, 1946–1990. New Haven, CT: Yale University Press.
Mayhew, David. 2005. Divided We Govern: Party Control, Lawmaking, and Investiga-tions, 1946–2002. 2nd ed. New Haven, CT: Yale University Press.
Mayhew, David. 2008. “Important laws enacted by the 108th Congress during 2003–04.” http://pantheon.yale.edu/;dmayhew/dataset_DWG04_laws_2003_ 2004.doc (June 28).
Mayhew, David. 2009a. “Important laws enacted by the 109th Congress during 2005–06.” http://pantheon.yale.edu/;dmayhew/dataset_DWG04_laws_2005_ 2006.doc (June 25).
Mayhew, David. 2009b. “Important laws enacted by the 110th Congress during 2007–08.” http://pantheon.yale.edu/;dmayhew/dataset_DWG_laws_2007-2008.doc (June 25).
Przeworski, Adam, Susan C. Stokes, and Bernard Manin, eds. 1999. Democracy, Accountability, and Representation. Cambridge: Cambridge University Press.
Soroka, Stuart N., and Christopher Wlezien. 2004. “Opinion Representation and Policy Feedback: Canada in Comparative Perspective.” Canadian Journal of Political Science 37 (3): 531–59.
Soroka, Stuart N., and Christopher Wlezien. 2005. “Opinion–Policy Dynamics: Public Preferences and Public Expenditure in the United Kingdom.” British Journal of Political Science 35 (4): 665–89.
Soroka, Stuart N., and Christopher Wlezien. 2010. Degrees of Democracy: Politics, Public Opinion, and Policy. Cambridge: Cambridge University Press.
Stimson, James A. 1991. Public Opinion in America. Moods, Cycles, and Swings. Boul-der, CO: Westview.
Stimson, James A. 1999a. “Party Government and Responsiveness.” In Democracy, Accountability, and Representation, ed. A. Przeworski, S. C. Stokes, and B. Manin. Cambridge: Cambridge University Press.
Stimson, James A. 1999b. Public Opinion in America. Moods, Cycles, and Swings. 2nd ed. Boulder, CO: Westview.
Stimson, James A. 2004. Tides of Consent: How Public Opinions Shapes American Politics. Cambridge: Cambridge University Press.
Stimson, James A., Michael B. MacKuen, and Robert S. Erikson. 1994. “Opinion and Policy: A Global View.” PS: Political Science and Politics 27 (1): 29–34. Stimson, James A., Michael B. MacKuen, and Robert S. Erikson. 1995. “Dynamic
Representation.” American Political Science Review 89 (3): 543–65.
US Census Bureau. 2008. “Table 384. Vote Cast for President, by Major Political Party: 1948 to 2004.” www.census.gov/compendia/statab/2008/tables/ 08s0384.xls (July 15).
Weisberg, Herbert F. 2002. “Partisanship and Incumbency in Presidential Elec-tions.” Political Behavior 24 (4): 339–60.
Wlezien, Christopher. 1995. “The Public as Thermostat: Dynamics of Preferences for Spending.” American Journal of Political Science 39 (4): 981–1000. Wlezien, Christopher. 1996. “Dynamics of Representation: The Case of U.S.
Spending on Defense.” British Journal of Political Science 26 (1): 81–103. Wlezien, Christopher. 2004. “Patterns of Representation: Dynamics of Public
Preferences and Policy.” Journal of Politics 66 (1): 1–24.
T h e r m o s t a t i c Vo t i n g
...
https:/www.cambridge.org/core
. University of Basel Library
, on
11 Jul 2017 at 15:40:56
, subject to the Cambridge Core terms of use, available at
https:/www.cambridge.org/core/terms
.