Simultaneous Determination of Human Plasma Levels of
Citalopram, Paroxetine, Sertraline, and Their Metabolites
by Gas Chromatography-Mass Spectrometry
C.B. Eap1'*, G . Bouchoux2, M. Amey1, N. Cochard1, L. Savary1, and P. Baumann1
1
Unité
de Biochimie et Psychopharmacologie Clinique, Département Universitaire de Psychiatrie Adulte, Hôpital de Cery, CH-1008 Prilly-Lausanne, Switzerland and 2Département de Chimie, Laboratoire des mécanismes réactionnels, Ecole Polytechnique, F-91128Palaiseau Cedex, France
Abstract
* Author to whom correspondence should be addressed: Dr. C.B. Eap, Hópital de Cery, CH-1008 Prilly-Lausanne, Switzerland, e-mail Chin.Eap@inst.hospvd.ch
A gas chromatography-mass spectrometry method is presented which allows the simultaneous determination of the plasma concentrations of the selective serotonin reuptake inhibitors citalopram, paroxetine, sertraline, and their pharmacologically active N-demethylated metabolites (desmethylcitalopram,
didesmethylcitalopram, and desmethylsertraline) after derivatization with the reagent
N-methyl-bis(trifluoroacetamide). No interferences from endogenous compounds are observed following the extraction of plasma samples from six different human subjects. The standard curves are linear over a working range of 10-500 ng/mL for citalopram, 10-300 ng/mL for desmethylcitalopram, 5-60 ng/mL for didesmethyl citalopram, 20-400 ng/mL for sertraline and
desmethylsertraline, and 10-200 ng/mL for paroxetine. Recoveries measured at three concentrations range from 81 to 118% for the tertiary amines (citalopram and the internal standard methylmaprotiline), 73 to 95% for the secondary amines (desmethylcitalopram, paroxetine and sertraline), and 39 to 66% for the primary amines (didesmethylcitalopram and
desmethylsertraline). Intra- and interday coefficients of variation determined at three concentrations range from 3 to 11 % for citalopram and its metabolites, 4 to 15% for paroxetine, and 5 to 13% for sertraline and desmethylsertraline. The limits of quantitation of the method are 2 ng/mL for citalopram and paroxetine, 1 ng/mL for sertraline, and 0.5 ng/mL for desmethyl citalopram, didesmethylcitalopram, and desmethyl sertraline. No interferences are noted from 20 other psychotropic drugs. This sensitive and specific method can be used for single-dose pharmacokinetics. It is also useful for therapeutic drug monitoring of these three drugs and could possibly be adapted for the quantitation of the two other selective serotonin reuptake inhibitors on the market, namely fluoxetine and fluvoxamine.
Introduction
Citalopram (CIT), paroxetine (PAR), and sertraline (SER) (Figure 1) are new antidepressants belonging to the class of the selective serotonin reuptake inhibitors (SSRIs). They exhibit
clin-Figure 1 . Chemical structures of CIT, DCIT, DDCIT, PAR, SER, DSER, and MMP (internal
ical efficacy comparable to that of classical tricyclic antidepres sants, but they are devoid of some of the adverse anticholinergic and cardiovascular effects commonly associated with these drugs (1). In the organism, these SSRIs are biotransformed toN-demethylated metabolites (2). Desmethylparoxetine is consid ered pharmacologically inactive, whereas desmethylcitalopram (DCIT), and perhaps also desmethylsertraline (DSER), contribute to the pharmacological activity of their parent drug (2).
Although no therapeutic windows have been defined for SSRIs in contrast to tricyclic antidepressants, analytical methods for therapeutic drug monitoring of SSRIs are useful in several instances. They are necessary for pharmacokinetic experiments, but one of their major potential uses is to check compliance. It has been shown that up to one-third of patients stop taking their antidepressants after six weeks, two-thirds of whom do not report it to their general practitioner (3). Several thin-layer chromatography, high-performance liquid chro matography (HPLC), or gas chromatography (GC) methods have been published (4) for the determination of the five SSRIs presently on the market (CIT, PAR, SER, fluoxetine [FLX], flu-voxamine [FLV]) and their metabolites in plasma or serum
samples. Recently, we described a GC-mass spectrometric (GC-MS) method which allows the simultaneous determina tion of the enantiomers of FLV and either FLX or norfluoxetine (NFLX) after derivatization with (S)-(-)N-trifluoroacetylprolyl chloride (5). To our knowledge, this is the only published method which allows the simultaneous determination of two SSRIs (5). Such methods would not only decrease the cost and speed up analysis, but would also be useful when two SSRIs are administered simultaneously (4). In the present paper, we describe a sensitive and specific GC-MS method which simultaneously measures CIT, SER, PAR, and their N-demethylated pharmacologically active metabolites.
Experimental
Reagents
CIT hydrobromide, DCIT hydrochloride, and didesmethylci talopram (DDCIT) L-tartrate monohydrate were supplied by Lundbeck (Copenhagen, Denmark). SER hydrochloride and
Table I. Main Ions (m/z) and Relative Abundance (%) in the Mass Spectra of CIT, PAR, SER, Their N-Demethylated Metabolites, and MMP after Derivatization with N-Methyl-bis(trifluoroacetamide)
CIT DCIT DDCIT PAR SER DSER MMP
Relative Relative Relative Relative Relative Relative Relative
abundance abundance abundance abundance abundance abundance abundance
m/z (%) m/z (%) m/z (%) m/z (%) m/z (%) m/z (%) m/z (%) 58 1000* 238 1000* 238 1000* 138 1000* 274 1000* 274 1000* 58 1000* 324 31 † 58 8 69 47 425 467† 402 723† 388 52† 291 98† 56 12 60 8 75 15 69 67 69 140 101 198 42 39 59 39 69 44 78 14 79 41 101 273 115 149 43 17 70 7 75 10 95 34 107 53 102 126 116 80 44 13 71 21 78 9 109 23 109 483 110 227 127 74 45 41 73 10 95 23 114 13 110 83 115 198 128 232 56 13 75 6 109 18 115 19 115 50 127 227 129 161 59 38 84 11 110 9 116 14 121 68 128 335 146 90 70 11 86 4 114 8 123 19 122 43 129 352 159 206 71 20 95 12 115 12 126 28 123 62 159 599 161 138 73 45 109 9 116 10 127 9 126 38 160 293 172 144 84 29 114 4 123 15 140 10 133 111 161 416 174 90 85 20 115 7 140 52 154 9 135 521 202 330 202 172 165 19 123 7 168 10 181 10 137 45 203 301 203 180 176 22 181 4 181 8 183 50 139 107 204 185 204 174 177 11 182 5 183 41 184 13 140 110 238 246 215 150 178 31 183 12 184 12 190 59 146 57 239 225 238 95 189 53 190 14 190 51 191 10 147 161 240 208 239 219 190 22 208 27 191 9 195 12 148 37 242 128 240 87 191 55 209 9 195 10 208 83 149 43 275 313 241 81 192 10 218 8 208 71 209 23 151 56 276 676 246 120 201 10 220 10 209 20 218 61 161 90 277 177 248 100 202 66 221 9 218 52 220 63 166 298 278 127 259 85 203 72 238 36 220 54 221 44 175 200 302 133 275 240 204 58 239 6 221 39 222 10 192 49 386 144 276 650 205 25 325 7 222 9 234 11 234 59 400 869 277 137 215 18 234 9 239 170 288 183 401 947 278 113 217 13 239 171 240 18 426 109 403 606 387 174 218 14 240 18 374 14 404 198 389 113 292 23 388 17 * Base peak. † M+.
N-DSER maleate were obtained from Pfizer (Groton, CT). PAR hydrochloride was provided by SmithKline Beecham (Wor thing, United Kingdom). N-MMP was supplied by Novartis (Basel, Switzerland). N-Methyl-bis(trifluoroacetamide) was from Fluka (Buchs, Switzerland). Stock solutions of CIT, DCIT, and DDCIT were prepared using 10 ng/μL of each drug in 0.1M HC1, and stock solutions of PAR, SER, and DSER were pre pared using 100 ng/μL of each drug in 0.1M HC1. Working solutions were prepared using 10 and 1 ng/μL of each drug in 0.01M HC1. Stock and working solutions of methylmaprotiline (MMP, internal standard) were prepared using 1 mg/mL in methanol and 2 ng/μL in 0.01M HC1, respectively. Working solutions were distributed into small aliquots and stored for up to 3 months at -20°C until use. All other reagents were of ana lytical or HPLC grade.
Instrumentation and chromatographic conditions
Analyses were performed on a Hewlett-Packard (Meyrin, Geneva, Switzerland) HP 5890 series II GC equipped with a splitless capillary and an electronic control pressure system. The GC was linked to a quadrupole HP 5972 MS operated in the electron impact mode. The MS conditions were as follows: ion izing electron energy, 50 eV; emission current, 50 μA; ion source temperature, approximately 180°C (heated by the interface); and GC-MS capillary direct interface, 280°C. Splitless injec tions of 3 μL were made into a fused-silica Optima 5 capillary column (15 m × 0.25-mm i.d., 0.25-μm film thickness) (Macherey-Nagel, Oensingen, Switzerland) with helium as the carrier gas. The column head pressure was set to maintain a con stant flow with a pressure of 2 psi (14 KPa). The total flow was 50 mL/min and the septum purge was 3 mL/min. GC conditions
Table II. Statistical Data Concerning the Analysis of CIT, PAR, SER, and Their N-Demethylated Metabolites
CIT DCIT DDCIT PAR SER DSER
Calibration (n = 4)
Range (ng/mL) 10-500 10-300 5-60 10-200 20-400 20-400
Slope: mean ± SD (CV)* 0.35 ±0.02 (5) 11.2 ±1.75 (16) 4.57 ±1.09 (24) 0.94 ±0.12 (13) 1.18 ±0.05 (4) 1.37 ±0.15 (11) Coefficient of correlation: mean (range) 0.998 (0.997,0.999) 0.998 (0.997,0.999) 0.991 (0.988,0.999) 0.995 (0.989,0.998) 0.999 (0.997,0.999) 0.995 (0.993,0.999)
Recovery (n = 6) Concentration used (ng/mL) 20 20 10 20 30 30 Recovery (%): mean ±SD (CV) 112 ±21 (19) 76 ±8 (10) 46 ±4 (9) 73 ±13 (18) 81 ± 7(9) 49 ±6 (12) Concentration used (ng/mL) 100 50 25 50 100 100 Recovery (%): mean ± SD (CV) 118 ±16 (14) 84 ±10(12) 49 ±6 (12) 80 ±18 (22) 95 ±13 (14) 66 ±10 (15) Concentration used (ng/ml) 300 100 40 150 300 300 Recovery (%): mean ±SD (CV) 91 ±15(16) 75 ±11 (14) 39 ±5 (12) 75 ±7 (10) 75 ±11 (14) 48 ±7 (14) Within-day variation (n = 8) Theoretical values (ng/mL) 20 20 10 20 30 30
Measured values (ng/mL): mean ± SD (CV) 20.8 ±1.5 (7) 19.7 ±1.7 (9) 9.6 ±1 (10) 21.8 ±3.0 (14) 31.4 ±2.3 (7) 33.6 ± 2.6 (8)
Percentage of theory 104 99 96 109 105 112
Theoretical values (ng/mL) 100 50 25 50 100 100
Measured values (ng/mL): mean ± SD (CV) 90.1 ± 2.3 (3) 45.4 ±1.7 (4) 25.5 ± 2 (8) 52.4 ±2.2 (4) 93.7 ±8.8 (9) 105 ±11.9 (11)
Percentage of theory 90 91 102 105 94 105
Theoretical values (ng/mL) 300 100 40 150 300 300
Measured values (ng/mL): mean ± SD (CV) 283 ±10.8 (4) 91.9 ±5.1 (6) 40.9 ±4.1 (10) 154 ±7.7 (5) 299 ±15.1 (5) 333 ±32.5 (10)
Percentage of theory 94 92 102 102 100 111
Day-to-day variation (n = 7)
Theoretical values (ng/mL) 20 20 10 20 30 30
Measured values (ng/mL): mean ± SD (CV) 21.5 ±2.3 (11) 21.4 ±1.9 (9) 10.5 ±1.1 (10) 22.4 ±3.4 (15) 34.3 ±4.6 (13) 28.9 ±3.7 (13)
Percentage of theory 107 107 105 112 114 96
Theoretical values (ng/mL) 100 50 25 50 100 100
Measured values (ng/mL): mean ± SD (CV) 89.1 ± 3.3(4) 45.6 ± 4.2 (9) 26.4 ± 2.7 (10) 48.4 ± 5.3 (11) 95.4 ± 5.5 (6) 86.2 ± 6.7 (8)
Percentage of theory 89 91 106 97 95 86
Theoretical values (ng/mL) 300 100 40 150 300 300
Measured values (ng/mL): mean ± SD (CV) 284 ± 9.1 (3) 95 ± 6.5 (7) 44 ± 4.0 (9) 146 ±12.7 (9) 292 ±18.5 (6) 275 ±20.7 (8)
Percentage of theory 94 95 111 97 97 92
Limit of quantitation (n = 8)
Theoretical values (ng/mL) 2 0.5 0.5 2 1 0.5
Measured values (ng/mL): mean ± SD (CV) 2.14 ±0.36 (17) 0.53 ±0.06 (11) 0.47 ±0.07 (16) 1.94 ±0.19 (10) 0.96 ±0.06 (6) 0.47 ±0.08 (16)
Percentage of theory 107 106 94 97 96 94
were as follows: initial temperature, 160°C; initial time, 0.5 min; heating rate, 30°C/min until 260°C (final time 3.40 min); and injector temperature, 250°C. Analyses were performed in the selected-ion monitoring (SIM) mode with a dwell time of 50 ms
Figure 3, SIM tracing of 1 mL blank plasma.
for the ions at m/z 238 (DDCIT and DCIT), 274 (DSER and SER), 291 (MMP), 324 (CIT), and 425 (PAR).
Extraction conditions
To a 1-mL volume of heparinized plasma sample were added 100 μL of MMP (internal standard, 2 ng/μL), 1 mL of 1M sodium car bonate buffer (pH 9.4), and 6 mL of n-heptane-ethylacetate (80:20, v/v). Extraction was per formed on a rotary shaker for 15 min. After cen-trifugation (8 min, 3400 × g), the organic layer was transferred to another tube containing 1.2 mL 0.1M HC1. After shaking for 15 min and cen-trifugation, the aqueous phase was transferred to another tube containing 1 mL of 1M car b o n a t e buffer (pH 9.4) and 150 μL of t o l u e n e - i s o a m y l a l c o h o l (85:15, v/v). After shaking for 15 min and centrifugation for 2 min, the solvent was transferred to injection vials and evaporated to dryness under a stream of nitrogen at 40°C.
Figure 4. SIM tracing of 1 mL plasma from a patient receiving 20 mg/dav CIT. CIT, ion 324, 4.68
min; DCIT, ion 238, 5.77 min; DDCIT ion 238, 5.43 min; MMΡ, ion 291, 4.36 min.
Derivatization conditions
The residue was dissolved by thorough vortex mixing with 20 μL of N-methyl-bis(trifluoroac-etamide) and left for 1 h at 60°C in a closed injec tion vial. The reagent was then evaporated to dryness under a stream of nitrogen at 40°C, reconstituted in 100 μL toluene-isoamylalcohol (85:15, v/v, thorough vortex mixing), and 3 μL was injected into the GC-MS system.
Results and Discussion
We recently described a GC-MS method for the simultaneous determination of FLV and the enan-tiomers of FLX and NFLX with (S)-(-)N-trifluo-roacetylprolyl chloride as the derivatizing reagent (5). To our knowledge, this was the first published method which simultaneously measured the con centrations of two SSRIs. We first attempted to use the same reagent for the three remaining SSRIs without success. Apparently, there was no deriva tization under our conditions (data not shown). After several trials with other reagents, we found that a good derivatization was obtained with N-methyl-bis(trifluoroacetamide). Table I lists the main ions in the mass spectra of CIT, SER, and PAR; of their N-demethylated pharmacologically active metabolites; and of MMP after derivatization with this reagent. The probable fragmentation pathways of the molecular cations of CIT, PAR, SER, and MMP are presented in Figure 2.
It should be mentioned that FLX, NFLX, and FLV (the other SSRIs not analyzed by the present m e t h o d ) a r e also readily derivatized w i t h
N-methyl-bis(trifluoroacetamide) and elute at retention times which are different from those of CIT, PAR, SER, and their metabolites (data not shown). We did not include FLX, NFLX, and FLV in the validation steps of the present method because we were more interested in separating the enantiomers of the former drug, which is only possible with the use of a chiral derivatizing reagent. However, the method described in the present paper could allow the simultaneous determination of the five SSRIs presently on the market; that is, if one is not interested in mea suring the enantiomers of FLX and NFLX separately. It should be mentioned that the present method and the method we previ ously described for FLX, NFLX, and FLV use the same extraction procedure.
Figure 3 shows the SIM tracing of a blank plasma. Figures 4-6 are examples of chromatograms obtained from the analysis of plasma samples drawn from patients receiving 20 mg/day of CIT, 40 mg/day of PAR, and 75 mg/day of SER, respectively. The
Figure 5. SIM tracing of 1 mL plasma from a patient receiving 40 mg/day PAR. PAR, ion 425,
6.39 min; MMΡ, ion 291, 4.37 min.
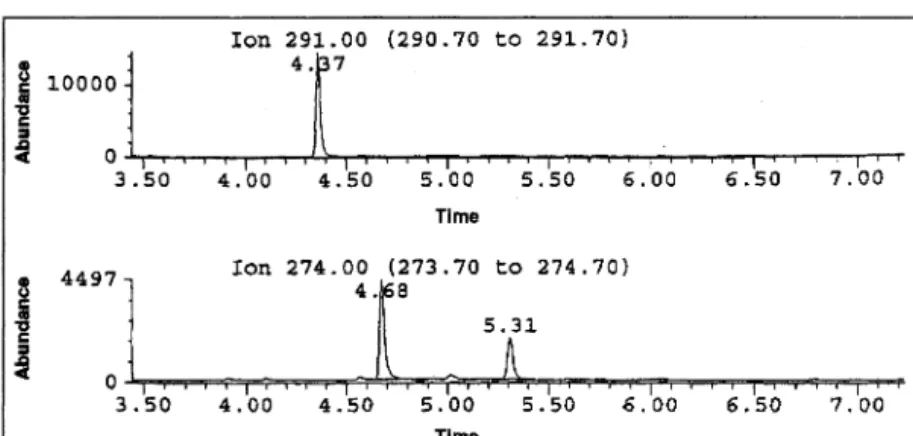
Figure 6. SIM tracing of 1 mL plasma from a patient receiving 75 mg/day SER. SER, ion 274,
5.31 min; DSER, ion 274, 4.68 min; MMP, ion 291, 4.37 min.
Table III. Relationships between the Concentrations of CIT, DCIT, DDCIT as Measured by GC-MS and GC-NPD*
GC-MS η r r2
CIT (ng/mL) -1.772 + 0.89(GC-NPD) 60 0.991 0.982 DCIT (ng/mL) -3.758 + 0.988(GC-NPD) 58 0.943 0.889 DDCIT (ng/mL) -1.462 + 1.192(GC-NPD) 37 0.917 0.841
There are unequal numbers of samples included in the statistical analysis because results that were below LOQ were eliminated.
measured concentrations of CIT, DCIT, DDCIT, PAR, SER, and DSER were 4 3 , 2 4 , 1 6 , 7 4 , 2 9 , and 56 ng/mL, respectively.
Table 2 shows a summary of the statistical data on the anal ysis of CIT, PAR, SER, and their metabolites. In summary, the mean coefficients of correlation of the calibration curves obtained from four separate experiments were 0.998, 0.998, 0.991, 0.995, 0.999, and 0.995, respectively. It should be men tioned that no values are given for the intercepts because the option "force through the origin" was chosen for the calibration curves; with this option, better results were obtained for control plasma samples of low concentration (data not shown). Because pure standards of the derivatized compounds are not available, recovery was calculated by dividing the mean areas (n = 6) obtained after the complete extraction and derivatization pro cedure of plasmas containing low, medium, and high concen trations of the SSRIs by the mean areas obtained after direct derivatization of the same quantities of the pure standards. Recoveries were satisfactory for all compounds, ranging from 81 to 118% for the tertiary amines (CIT and MMP), from 73 to 95% for the sec ondary amines (DCIT, PAR, and SER), and from 39 to 66% for the primary amines (DDCIT and DSER). The variability of the assays for the i n t r a - (n = 8) and t h e i n t e r d a y
(n = 7) experiments measured at three concen
trations for each substance, as assessed by the coefficients of variation, ranged from 3 to 11% for CIT and its metabolites, from 4 to 15% for PAR, and from 5 to 13% for SER and DSER. The percent theoretical concentrations, which represent the accuracy of the method, were all within ± 10% for CIT and its metabolites, within ± 9% for PAR, and within ± 12% for SER and DSER.
The limits of quantitation are defined as the concentrations for which the mean value of replicate determinations (n = 8) is within 20% of the actual value, the coefficient of variation less than 20%, and which gives a signal-to-noise ratio of at least 10. Limits of quantitation were 2 ng/mL for CIT and PAR, 1 ng/mL for SER, and 0.5 ng/mL for DCIT, DDCIT, and DSER.
The specificity of the assay was also evaluated. Samples (200 ng) of each of the following substances diluted in methanol were dried, deriva tized, dried, reconstituted in 100 μL toluene-isoamylalcohol (85:15, v/v), and injected into the GC-MS: amitriptyline, nortriptyline, clomipra mine, desmethylclomipramine, trimipramine, desmethyltrimipramine, maprotiline, methadone, mianserin, desmethylmianserin, clozapine, desmethylclozapine, imipramine, desmethylim-ipramine, fluoxetine, norfluoxetine, fluvoxamine, procyclidine, risperidone, and 9-hydroxy risperi done. No interferences were noted from these 20 psychotropic drugs. Likewise, no interferences were observed from endogenous compounds fol lowing the extraction of plasma samples from six
different human controls who were not receiving any medication. It should be noted that ions of high molecular weight or molec ular ions were intentionally chosen in order to minimize poten tial interferences from other substances. Also, MMP, which was used as the internal standard, is not a metabolite of maprotiline and is not detected in patients receiving this drug (6). The sta bility of CIT, PAR, SER, and their metabolites was evaluated by analyzing spiked plasma samples stored at -20°C for different periods of time. No loss was noted after storage of up to 3 months. Finally, the stability of the derivatized forms of these three SSRIs with their metabolites was evaluated. No change was noted after storage of up to 3 days at room temperature (data not shown).
Before the development of the present method, the concentra tions of CIT, DCIT, and DDCIT were measured in our laboratory using GC with a nitrogen-phosphorus detector (GC-NPD) after derivatization of the secondary and primary amines with trifluo-roacetic anhydride (7). Sixty plasma samples which were sent to our laboratory for therapeutic drug monitoring of CIT using GC-NPD were reanalyzed using GC-MS. Table 3 shows the good correlations obtained between the two methods. It should be men tioned, however, that one value of DCIT was excluded from the sta tistical analysis because of a marked difference in the results between the two methods (142 ng/mL with GC-NPD and 30 ng/mL with GC-MS). We believe that the high DCIT concentration in the former method was caused by an unknown substance, probably a comedication, eluting at the same retention time.
Conclusion
This method, which is both sensitive and selective, allows the simultaneous quantification of CIT, PAR, SER, and their N-demethylated metabolites in plasma samples and can be used for single-dose pharmacokinetic studies. This procedure decreases the cost and time of analysis. It provides a good alter native analytical method for psychiatric patients who are often comedicated and also for patients who are medicated with two
SSRIs (4). Finally, this method could probably be used for the simultaneous quantification of the five SSRIs on the market.
Acknowledgements
We gratefully acknowledge the editorial assistance of Mrs. C. Bertschi and the bibliographic help of Mrs. J. Rosselet, Mrs. M. Gobin, and Mrs. T. Bocquet. We thank Lundbeck for providing us with CIT and its metabolites, Pfizer for SER and its metabo lite, SmithKline Beecham for PAR, and Novartis for MMP.
References
1. R. Lane, D. Baldwin, and S. Preskorn. The SSRIs: advantages, disadvan tages and differences. J. Psychopharmacol. 9 (suppl.): 163-78 (1995). 2. P. Baumann. Pharmacology and pharmacokinetics of citalopram and
other SSRIs. Int. Clin. Psychopharmacol. 11 (suppl. 1): 5-11 (1996). 3. J.C. Maddox, M. Levi, and C. Thompson. The compliance with antide pressants in general practice. J. Psychopharmacol. 8:48-53 (1994). 4. C.B. Eap and P. Baumann. Analytical methods for the quantitative
determination of selective serotonin reuptake inhibitors for thera peutic drug monitoring purposes in patients. J. Chromatogr. Biomed.
Appl. 686:51-63 (1996).
5. C.B. Eap, N. Gaillard, K. Powell, and P. Baumann. Simultaneous determination of plasma levels of fluvoxamine and of the enantiomers of fluoxetine and norfluoxetine by gas chromatography-mass spec trometry. J. Chromatogr. Biomed. Appl. 682:265-72 (1996). 6. G . Gabris, P. Baumann, M . Jonzier-Perey, P. Bosshart, B. Woggon, and
A. Küpfer. N-Methylation of maprotiline in debrisoquine/ mephenytoin-phenotyped depressive patients. Biochem. Pharmacol.
34:409-10(1985).
7. P. Reymond, M. Amey, A. Souche, S. Lambert, H. Konrat, C.B. Eap, and P. Baumann. Determination of plasma levels of citalopram and its demethylated and deaminated metabolites by gas chromatography and gas chromatography-mass spectrometry. J. Chromatogr. Biomed.
Appl 616: 221-28 (1993).