Cochlear Neuropathy:
Detection using envelope following responses
and Impacts on central auditory coding
by
Luke A. Shaheen B.S. Electrical Engineering Northeastern University, 2009
SUBMITTED TO
THE HARVARD-MIT DIVISION OF HEALTH SCIENCES AND TECHNOLOGY IN PARTIAL FULFILLMENT OF THE REQUIREMENTS FOR THE DEGREE OF
DOCTOR OF PHILOSOPHY
IN SPEECH AND HEARING BIOSCIENCE AND TECHNOLOGY AT THE
MASSACHUSETTS INSTITUTE OF TECHNOLOGY
Signature of Author:
SEPTEMBER 2016
@ 2016 Luke A. Shaheen. All rights reserved The author hereby grants to MIT permission to reproduce
and to distribute publicly paper and electronic copies of this thesis document in whole or in part
in any medium now known or hereafter created.
Signature redacted
M IJTE OF TECHNOLOGYFOCT
1 12013
LIBRARIES
ARCHIVES
Certified by: Accepted b1/
Luke A. ShaheenHyvard-MIT Division of Health Sciences and Technology
- -July 1, 2016
Signature redacted
M. Charles Liberman, Ph.D. Thesis Supervisor Director, Eaton-Peabody Laboratory, Massachusetts Eye & Ear Infirmary Harold F. Schuknecht Professor of Otology and Laryngology, Harvard Medical School
:
Signature redacted
Emery Brown, MD, PhD Director, Harvard-MIT Division of Health Sciences and Technology Professor of Computational Neuroscience and Health Sciences and Technology
Cochlear Neuropathy:
Detection using envelope following responses
and Impacts on central auditory coding
by
Luke A. Shaheen
Submitted to the Harvard-MIT Division of Health Sciences and Technology on July 1, 2016 in partial fulfillment of the requirements
for the degree of Doctor of Philosophy in Speech and Hearing Bioscience and Technology
Abstract
Nearly all information about the acoustic environment is conveyed to the brain by auditory nerve (AN) fibers. While essential for hearing, these fibers may also be the most vulnerable link in the auditory pathway: moderate noise exposure can cause loss of AN fibers without causing hair cell damage or permanent threshold shift. This neuropathy is undetectable by standard clinical examination, but post-mortem evidence suggests that it is widespread in humans. Its impact on suprathreshold hearing ability is likely profound, but is not well understood.
An essential tool for evaluating the impact of neuropathy is a non-invasive test useable in humans. Since noise-induced neuropathy is selective for high-threshold AN fibers, where phase locking to envelopes is particularly strong, we hypothesized that the envelope following response (EFR) might be a more sensitive measure of neuropathy than the more traditional auditory brainstem response (ABR). We compared ABRs and EFRs in mice following a neuropathic noise exposure. Changes to EFRs were more robust: the variance was smaller, thus inter-group differences were clearer.
Neuropathy may be the root cause of a number of deficits that can occur in listeners with normal audiograms, such as speech discrimination in noise and ability to use envelope cues. We searched for neural correlates of these deficits in the mouse auditory midbrain following exposure. Consistent with reductions in EFRs, synchronization to envelopes was impaired. Neural detectability of tones in background noise was impaired, but only for cases when noise level changed every 600 milliseconds. When noise level changed every minute, responses were equal to those of unexposed mice, implicating changes to adaptation. In quiet, tone-evoked rate-level functions were steeper, indicating that neuropathy may initiate a compensatory response in the central auditory system leading to the genesis of hyperacusis. In sum, we found compensatory effects on coding in the midbrain beyond the simple direct effects expected by peripheral neuropathy.
Thesis supervisor: M. Charles Liberman, Ph.D.
Table of Contents
Abstract 3
General Introduction 7
Chapter 1: Towards a diagnosis of cochlear neuropathy with envelope following responses
Abstract 9 Introduction 10 Methods 12 Results 15 Discussion 28 Acknowledgments 32
Chapter 2: Effects of neuropathy on spontaneous and evoked activity in the inferior colliculus
Abstract 33 Introduction 34 Methods 35 Results 40 Discussion 58 Supplemental Figures 64
Chapter 3: Effects of neuropathy on coding of tones in noise and synchronization to envelopes in the inferior colliculus
Abstract 71 Introduction 72 Methods 73 Results 76 Discussion 91 Supplemental Methods 95 Supplemental Results 95 Supplemental Figures 97 General Discussion 105 References 107 Acknowledgments 119
Figure Reference
Figure 1.1. Schematics of AN responses according to SR group. 11
Figure 1.2. Schematic of electrode configurations. 13
Figure 1.3. EFR stimuli and response. 14
Figure 1.4. Noise-exposure causes permanent synaptic loss with minimal
permanent threshold shift. 16
Figure 1.5. Cochlear neuropathy reduces EFR amplitudes and phase-locking
values (PLVs). 18
Figure 1.6. Acute ouabain-induced neuropathy reveals hair cell contributions
to ABRs and EFRs. 19
Figure 1.7. Effects of electrode configuration on EFRs and ABRs. 21 Figure 1.8. EFR amplitudes and phase-locking values are most sensitive
to cochlear neuropathy for modulation frequencies near 1 kHz. 22 Figure 1.9. Amplitude ratios between control and noise-exposed groups
for each of the five ABR waves suggest central compensation. 23
Figure 1.10. After neuropathic noise, changes in EFR amplitude and
phase-locking values were more robust than changes in ABR Wave I amplitude. 24 Figure 1.11. EFR is a more powerful measure of cochlear neuropathy
than ABR, and effect sizes are largest at moderate SPLs. 25
Figure 1.12. BK channel knockout decreases EFR amplitudes over a
wide range of carrier frequencies, modulation frequencies, and levels. 27 Figure 2.1. Noise-exposure causes permanent synaptic loss with minimal
permanent threshold shift. 41
Figure 2.2. Spontaneous rates are unchanged following neuropathic noise exposure. 42 Figure 2.3. Peripheral thresholds in additional noise-exposed groups. 43 Figure 2.4. Spontaneous rates are not elevated when noise exposure is
more intense or unilateral. 43
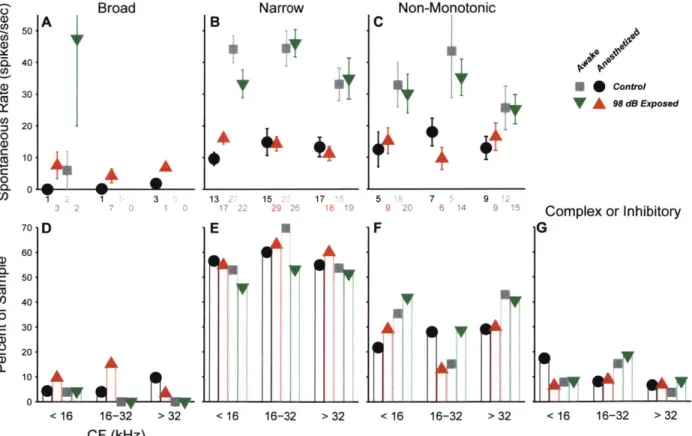
Figure 2.5. Unit types based on frequency response areas. 44 Figure 2.6. Spontaneous rates are unchanged for all tone frequency response types. 45 Figure 2.7. Unit types based on binaural noise response areas. 46 Figure 2.8. Spontaneous rates are unchanged for all binaural noise response types. 47 Figure 2.9. Spontaneous rates are unchanged for all contralateral noise response types. 48 Figure 2.10. Effect of noise exposure on responses to tones. 50 Figure 2.11. Single-unit slope is increased in the neuropathic region. 51 Figure 2.12. Multi-unit slope is increased in the neuropathic region. 52 Figure 2.13. Current source density slope is increased in the threshold-shift region. 53 Figure 2.14. Off-CF responses to tones suggest a reduction in inhibition. 54 Figure 2.15. Responses to noise are reduced in neuropathic mice. 56 Figure 2.16. Maximum driven rate to noise is reduced in noise-exposed mice. 57
Figure S2.1. Spike sorting examples. 65
Figure S2.2. Metrics used for unit typing by FRA. 66
Figure S2.3. Elevations in slope are limited to non-monotonic neurons. 67
Figure S2.4. Spike threshold is higher in awake mice. 68
Figure S2.5. CSD tuning functions. 69
Table 2.1. Summary of studies measuring SRs in the IC following noise exposure. 70
Figure 3.1. Tone-in-noise stimuli. 74
Figure 3.2. Example responses to tones in noise. 77
Figure 3.4. Tone thresholds in noise. 79
Figure 3.3 Tone thresholds in quiet. 79
Figure 3.5. Effect of noise on tone-driven rate range. 80
Figure 3.6. Response to noise alone is not affected by neuropathy. 81 Figure 3.7. Neural detection of low-SNR tones is impaired at moderate noise levels
Figure 3.8. Mutual information is reduced in the neuropathic region for the
interleaved, but not blocked noise paradigm. 84
Figure 3.9. Tone-driven rate dynamic range at LQ90 is unchanged in exposed mice. 85
Figure 3.10. Tone slope is elevated in noise in the non-neuropathic region of exposed mice. 86 Figure 3.11. Example response to temporal envelope stimuli. 87 Figure 3.12. Synchronization to temporal envelopes at moderate levels is
impaired in the neuropathic region. 88
Figure 3.13. Exposure effects on synchrony were minimal in the non-neuropathic region.
89 Figure 3.14. Synchronization changes in the threshold-shift region are consistent
with a loss of sensitivity. 91
Figure S3.3 Multi-unit tone thresholds in quiet. 97
Figure S3.4. Multi-unit tone thresholds in noise. 98
Figure S3.5. Contrary to single-units, relative tone-driven rate is unaffected by
exposure in 16-32 kHz multi-units of awake mouse multi-units. 99
Figure S3.6. Response to noise alone in multi-units. 100
Figure S3.7. Neural detection of low-SNR tones in multi-units. 101 Figure S3.8. Mutual information at low SNRs in multi-units. 102 Figure S3.9. Tone-Driven Rate Dynamic Range at LQ90 is unchanged in exposed mice. 103
Figure S3.10. Contrary to single-units, tone slope in noise is unchanged in the
General Introduction
The mammalian auditory system interprets the acoustic environment with remarkable sensitivity and range. From the quietest sounds to the loudest, hearing extends over a dynamic range of 120 dB (Viemeister, 1988). Humans maintain fine discrimination of level differences (-1 dB) across this range, and can discriminate frequency differences as low as .1 % at moderate and high intensities (Wier et al., 1977; Viemeister, 1983; Florentine et al., 1987). Furthermore, the system is superbly impervious to noise; young humans can pick out and discriminate context-free speech streams at a signal to noise ratio of 0 dB relative multi-talker babble (Plomp and Mimpen, 1979; Dubno et al., 1984), a feat that, despite decades of work, has yet to be matched by machine algorithms (Sroka and Braida, 2005; Benzeghiba et al., 2007).
Auditory perception is supported by specializations in both cochlear and neural anatomy. Insight into the distinct role of these two components can be gleaned by studies of pathology. Acoustic overexposure can cause a variety of insults to the cochlea, including outer hair cell (OHC) stereocilia damage, OHC loss, and inner hair cell (IHC) damage and loss (Liberman et al., 2010). Damage to OHCs reduces their ability to amplify auditory signals, causing elevated thresholds and impaired frequency selectivity (Liberman and Dodds, 1984). At more moderate noise exposure levels, OHC morphology and function and initially altered, but recover completely, generally by 1-2 weeks post-exposure. However, it is now clear that such exposures are not benign, and can cause loss of at least 50% of the synapses between IHCs and auditory nerve (AN) terminals, followed by a slow degeneration of AN cell bodes and central axons, without causing permanent threshold elevations (Kujawa and Liberman, 2009). Elderly humans with normal audiometric thresholds often exhibit perceptual deficits in understanding speech in noise, perhaps due to difficulty using both fine structure and temporal envelope cues (Harris et al., 2009; Clinard et al., 2010; King et al., 2014; summarized in Plack et al., 2014). While numerous studies have identified changes in the central nervous system that could be responsible for these deficits, they may also be caused, or perhaps triggered, by cochlear neuropathy. However, a robust test for neuropathy has yet to be devised, and so its impact on hearing is as of yet unknown. The aims of this thesis were two: 1) to evaluate the utility of the envelope following response as a non-invasive method for quantifying neuropathy, and 2) to identify changes in midbrain auditory coding following neuropathy, with the hope that any changes found may ultimately be used to predict
impacts of neuropathy on auditory perception.
In guinea pigs, noise-induced neuropathy is selective for high-threshold, low-spontaneous rate fibers (Furman et al., 2013). Since phase locking to envelopes is particularly strong in these fibers (Joris and Yin, 1992), I hypothesized that the envelope following response (EFR) might be a more sensitive non-invasive measure of neuropathy than the more traditional auditory brainstem response (ABR). In Chapter 1, 1 compare ABRs and EFRs in mice following a neuropathic noise exposure. Changes to EFRs were more robust: the variance was smaller, thus inter-group differences were clearer. I further explored principles that can be used to optimize the EFR for detection of neuropathy, and found that best separation of control and exposed groups was
achieved with a high modulation frequency and moderate levels.
While the neural consequences of acoustic overexposure have been studied for decades, most exposures used have caused both hair cell and neural damage. Based on anatomical, physiological and behavioral evidence, I hypothesized that cochlear neuropathy alone may cause neural hyperactivity, impaired coding of signals in noise, and impaired coding of envelopes. These hypotheses were tested by comparing single- and multi-unit responses in the inferior colliculus of mice with noise-induced neuropathy with those of age-matched controls. Consistent with reductions in EFRs, synchronization to envelopes was impaired. Neural detectability of tones in background noise was impaired, but only for cases when noise level changed every 600 milliseconds. When noise level changed every minute, responses were equal to those of unexposed mice, implicating changes to adaptation. In quiet, tone-evoked rate-level functions were steeper, indicating that neuropathy may initiate a compensatory response in the central auditory system leading to the genesis of hyperacusis. In sum, we found a combination of both positive and negative changes to coding in the midbrain, some of which as likely direct effects of neuropathy, and some of which could be due to central compensation.
Chapter 1
Towards a diagnosis of cochlear neuropathy with envelope
following responses
Luke A. Shaheen, Michelle D. Valero, and M. Charles Liberman
ABSTRACT
Listeners with normal audiometric thresholds can still have suprathreshold deficits, for example, in the ability to discriminate sounds in complex acoustic scenes. One likely source of these deficits is cochlear neuropathy, a loss of auditory nerve (AN) fibers without hair cell damage, which can occur due to both aging and moderate acoustic overexposure. Since neuropathy can affect up to 50% of AN fibers, its impact on suprathreshold hearing is likely profound, but progress is hindered by lack of a robust non-invasive test of neuropathy in humans. Reduction of suprathreshold auditory brainstem responses (ABRs) can be used to quantify neuropathy in inbred mice. However, ABR amplitudes are highly variable in humans, and thus more challenging to use. Since noise-induced neuropathy is selective for AN fibers with high thresholds, and because phase locking to temporal envelopes is particularly strong in these fibers, the envelope following response (EFR) might be a more robust measure. We compared EFRs to sinusoidally amplitude-modulated tones and ABRs to tone-pips in mice following a neuropathic noise exposure. EFR amplitude, EFR phase-locking value, and ABR amplitude were all reduced in noise-exposed mice. However, the changes in EFRs were more robust: the variance was smaller, thus inter-group differences were clearer. Optimum detection of neuropathy was achieved with high modulation frequencies and moderate levels. Analysis of group delays was used to confirm that the AN population was dominating the responses at these high modulation frequencies. Application of these principles in clinical testing can improve the differential diagnosis of sensorineural hearing loss.
INTRODUCTION
Moderate noise exposure can cause a rapid loss of synapses between cochlear hair cells and auditory nerve (AN) terminals, followed by a slow degeneration of AN cell bodies and central axons (Kujawa and Liberman, 2009; Lin et al., 2011). This neuropathy can occur without damage to hair cells, and despite full recovery of thresholds for distortion-product otoacoustic emissions (DPOAEs) and auditory brainstem responses (ABRs). In normal ears, from 10 - 30 AN fibers synapse on each inner hair cell (IHC), depending on species and cochlear location (Liberman et al., 1990; Maison et al., 2013b) and these fibers can be divided into functional subgroups based on spontaneous discharge rate (SR) and sensitivity to sound (Liberman, 1978). The SR distribution is bimodal, with roughly 40% in the low-rate peak (SR < about 18 spikes/second) and 60% in the high-rate peak. Single-fiber recordings in guinea pig suggest that noise-induced neuropathy is selective for high-threshold, low-SR fibers, and that the remaining low-threshold, high-SR fibers exhibit normal responses (Furman et al., 2013). This helps explain why noise-induced cochlear neuropathy can have no discernible effect on ABR thresholds, which must rely only on high-SR fiber responses since low-SR fibers are unresponsive at low stimulus levels (Liberman, 1978).
Post-mortem studies suggest that AN primary degeneration may be widespread in humans (Makary et al., 2011), but it is currently undetected by routine clinical examination. Work in animals shows that more than 80% of the AN fiber population can be silenced without shifting behavioral thresholds for tones in quiet, so long as the outer hair cell (OHC) amplifier is intact (Lobarinas et al., 2013). The impact of such primary neural degeneration on suprathreshold hearing ability is likely profound, but not well understood. A prerequisite for diagnosing this "hidden hearing loss" is a robust test for neuropathy suitable for use in humans. In animal studies, changes in suprathreshold amplitudes of ABR wave I are well correlated with cochlear neuropathy, so long as the cochlear amplifier is undamaged (Kujawa and Liberman, 2009).
However, the envelope following response (EFR), the far-field response to an amplitude-modulated tone (Rickards and Clark, 1972; Campbell et al., 1977; Kuwada et al., 1986), may provide a more robust metric of neuropathy than ABR. Human studies have documented a strong correlation between EFR threshold and ABR threshold (Stapells et al., 1987; Johnson and Brown, 2005; D'haenens et al., 2009). The EFR, and related measures such as the steady-state response to synthetic vowels, have also been investigated at suprathreshold levels: reduced responses in listeners with normal audiograms have been associated with deficits detecting signals in noise (Dimitrijevic et al., 2004), using temporal cues (Ruggles et al., 2011), and in modulation and interaural-time-delay thresholds (Bharadwaj et al., 2015). One possible cause of these deficits may be partial cochlear neuropathy of the sort documented histologically in noise-exposed animals (Kujawa and Liberman, 2009; Furman et al., 2013; reviewed in Bharadwaj et al., 2014) and aging animals (Sergeyneko et al. 2013).
To the extent that they are dominated by AN fibers, EFRs might be particularly sensitive to noise-induced neuropathy, because low-SR AN fibers show greater synchronization than high-SR fibers to sinusoidally amplitude-modulated (SAM) tones (Joris and Yin, 1992), especially at
moderate-to-high stimulus levels (Fig 1.1B). In contrast, ABRs are evoked by transient stimuli and dominated by onset responses, which are relatively small in low-SR fibers (Rhode and Smith, 1985; Taberner and Liberman, 2005; Fig. 1A). Thus, the low-SR contribution to the ABR is disproportionately low (Bourien et al., 2014). In addition, phase information can be extracted from EFRs, and measures of phase-locking value (PLV) might be more robust to human anatomical variations (Gorga et al., 1988; Nikiforidis et al., 1993) that complicate amplitude measures in both electrophysiological tests.
In this study, we compare EFRs and ABRs in mice with selective low-SR neuropathy after noise exposure. We contrast this etiology with one affecting all SR groups: mutant mice lacking the BK channel, the large-conductance K+ channel expressed in hair cells and AN fibers (Skinner
70- 50- 30-2 0J 70. 50 30.
Tone Pip (ABR)
A Medium SR High SR Time Time S2040 60 80 C 00 200 100 0-E 201 06 20 40 60 80 Level (dB SPL)
SAM Tone (EFR)
B Modulated Rate Average Rate 0 20 40 60 80 D F 6 20 40 60 80 Level (dB SPL)
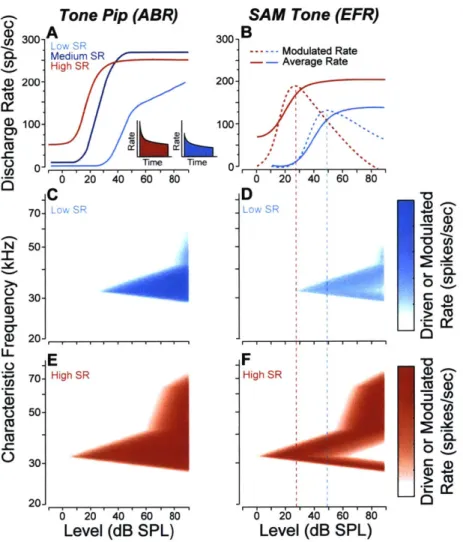
Figure 1.1. Schematics of AN responses according to SR group. A, Rate-vs.-level functions for
high-medium- and low-SR fibers to tone bursts at the characteristic frequency (Liberman, 1978). The insets show post-stimulus time histograms of the response to a moderate-level tone burst: onset rates are higher in the high-SR fiber than in the low-SR fiber (Taberner and Liberman, 2005). B, Responses to SAM tones in high- vs. low-SR fibers expressed as average rate and modulated rate. Responses are to carrier tones at the characteristic frequency, amplitude modulated at 100 Hz (Joris and Yin 1992). C-F, Simulated response of mouse low- (C,D) and high-SR fibers (E,F) to a 32 kHz tone (C,E) and 32 kHz SAM tone (D,F). Depth of shading indicates rate (C,E) and modulated rate (D,F) as indicated in the scale at the right.
11
'I
300-.) 200-100 00-I
N 0 Cr CD IL C.) C) CU 0 0 a) 0 0 0 0) 1-, a) Cn Co a) Cur771
et al., 2003; Hafidi et al., 2005). In this model, OHC function is normal, but AN fiber firing rates are decreased regardless of SR (Oliver et al., 2006), due to an increase in the IHC time constant, which decreases spike synchronization at stimulus onset, and an increase in the AN refractory period, which directly affects maximum rate.
EFR amplitude and PLV were reduced in both noise-exposed and BK knockout (KO) mice, as was the amplitude of ABR wave I. However, the two pathologies caused different patterns of reduction vs. stimulus level in ways consistent with the different subgroups of AN fibers affected. We found an optimum range of EFR modulation frequencies where sensitivity to AN loss is maximal (-1 kHz), below which responses are increasingly dominated by a mixture of sources, and above which responses are dominated by hair cell potentials. In both models, the EFR data outperformed the ABR data with respect to the sensitivity and specificity for the detection of pathology.
METHODS
Animals and groups: Male CBA/CaJ mice were exposed awake and unrestrained to
octave-band noise (8-16 kHz) for 2 hrs, within a cage suspended directly below the horn of the loudspeaker in a small, reverberant chamber. Noise calibration to target SPL was performed immediately before each exposure session. Control mice were of the same age, gender, and strain, but were not exposed to the noise. Three different groups were used, each with their own age-matched controls; Group 1a - exposed to 98 dB SPL at 8 wks of age, (4 control, 5 exposed), Group lb - also exposed to 98 dB SPL at 8 wks (6 control, 6 exposed), and Group 2 - exposed to 99 dB SPL at 16 wks (8 control, 10 exposed). Both histology and physiology were conducted 2 wks after noise exposure.
Heterozygous breeding pairs of the mutant mouse line with targeted deletion of the gene for the alpha subunit of the BK Ca channel were obtained from the laboratory of origin (Meredith et al., 2004). This same line has been used previously for studies on the role of the BKCa channel in the inner ear (Pyott et al., 2007; Maison et al., 2013a). The mice were maintained on an FVB/ NJ background. Offspring of the heterozygous paternal stock were bred and genotyped in-house to produce homozygous null animals and wildtype littermates. Physiology was conducted at 6-8 weeks of age and included 5 control and 5 KO mice of mixed genders. The comparison here was between wild-type and KO mice; none of these mice were noise-exposed.
In one experiment, electrophysiology was conducted during application of ouabain to the round window niche in order to cause unilateral cochlear neuropathy (Lang et al., 2011; Yuan et al., 2014). After anesthetization (see below) the pinna was removed and a retroauricular incision was made. The underlying muscles and facial nerve were separated by blunt dissection to expose the middle compartment of the bulla, and the round window niche was exposed through a small opening. Ouabain (1-2 pl, 1 mM in distilled water) was applied to the round window membrane for 20 min using a 10 pl Hamilton syringe, and then wicked off and exchanged for a fresh solution
every 20 min for 4 total applications.
All procedures were approved by the Institutional Animal Care and Use Committee of the
Massachusetts Eye and Ear Infirmary.
Physiology: Mice were anesthetized with ketamine (100 mg/kg i.p.) and xylazine (20 mg/
kg i.p). Recordings were conducted in an acoustically and electrically shielded room held at 30 C. Custom LabVIEW and MATLAB software controlling National Instruments 24-bit digital input/
output boards generated all stimuli and recorded all responses. Stimuli were presented using a custom acoustic assembly containing two electrostatic drivers (CUI CDMG15008-03A) and an electret condenser microphone (Knowles FG-23329-P07). The assembly was calibrated with a
1
%-inch Bruel and Kjaer condenser microphone. All stimuli were presented unilaterally to the left ear, with the mouse on its right side, and the acoustic assembly just above the ear canal. In-ear calibrations were performed at the onset of each experiment.
DPOAEs were recorded in response to two tones f, and f2, each presented to separate
speakers to reduce system distortion (frequency ratio f2/f1 = 1.2, and level difference L, = L2 +
10 dB). DPOAE response was measured at 2f,-f2 by Fourier analysis of the ear-canal sound
pressure waveform. Stimulus duration was 1.6 seconds at each level combination (L2 varied from 20 to 80 dB SPL in 5 dB steps). Threshold was defined as the interpolated f2 level producing a
DPOAE of 5 dB SPL.
Both ABR and EFR were recorded differentially with subdermal needle electrodes with the common ground at the base of the tail; four different electrode configurations were used (Fig 1.2). The first two configurations were used after a dorsal-ventral incision at the intertragal notch of the ipsilateral pinna to allow direct visualization of the eardrum. Following the incision, electrode pairs were placed both (1) vertex (positive electrode) to ipsilateral pinna, with the latter just caudal to the intertragal notch, and (2) contralateral pinna (positive) to ipsilateral pinna, with both electrodes caudal to the intertragal notch. This configuration pair was used for Group 1. In Group la the pinna electrode was just caudal to the intertragal notch, which is the standard position used
A VertexI Pinna Pinna V 1 c PinnaD B Vertex Cana a Juxtapinna Figure 1.2. Schematic of electrode configurations. A, Intact-pinna configurations:
vetex to pinnaD shown, vertex to pinnav location illustrated
by magenta dot. For pinna
to pinna configurations the
positive (green) electrode
was placed in an identical location on contralateral side (not shown). B, Removed-pinna configurations: vertex to ear canal, vertex to
by our lab (Vertex - PinnaD). In Group 1b, the pinna electrode was placed slightly more ventral along the antitragus in order to increase the early ABR waves (Vertex - Pinnav). The second two configurations were used after removing the entire pinna and surrounding skin (8-10 mm posterior to the tympanic ring) to access the bulla and round window. Following that, electrodes were placed both (3) vertex (positive) to ipsilateral ear canal, with the latter through the rostral edge of the severed ear canal, and (4) vertex (positive) to ipsilateral juxta-pinnal skin, with the latter through the cut edge of the skin posterior to the ear canal. This configuration was used for Group 2. Responses were measured simultaneously from each configuration pair.
Responses were amplified 1 0,OOOX using two Grass P511 amplifiers with a 0.3-3 kHz passband for ABR, and a 0.03-30 kHz passband for EFR. ABRs were evoked with 5-msec. tone-pips with 0.5 msec. cos2 rise-fall presented in alternating polarity at a rate of 40/s. Tone-pip frequencies were 11.3 or 32 kHz. Trials where the response amplitude exceeded 15 pV were rejected; 512 artifact-free trials of each polarity were averaged to compute ABR waveforms. Threshold was defined by blinded visual inspection of the stacked waveforms as the lowest level at which a reproducible peak or trough appears, which usually occurs one level-step below that at which peak-to-peak amplitude begins to grow. EFR stimuli were 30-sec. SAM tones using 100% modulation depth and carrier frequencies (fcs) of 11.3 kHz or 32 kHz. Modulation frequency (fm) ranged from 400 Hz to 1990 Hz. EFR amplitude was measured at fm using Fourier analysis. To minimize system distortion, the carrier tone was presented using one of the speakers and the two sidebands using the other. Postmortem measurements demonstrated that this approach eliminated distortion for stimulus levels up to 90 dB SPL. In the mouse, the quadratic difference tone distortion product at
fm (generated by interaction of the carrier and either sideband) falls outside the range of hearing for all fms used (up to 2 kHz), so it should not influence results. Cubic difference tones were measureable at f + nfm for n = {-4,-3,-2, +2}, but since their amplitude was always at least 50 dB lower than that of the stimulus tones, contribution to the EFR was minimal. EFR group delay was calculated for each individual by 1) measuring the phase at fm
using MATLAB's unwrap, 3) fitting a line to each consecutive
A
Single-trial Response
Average Response
SAM Tone Stimulus
B
C
00
2700
by Fourier analysis, 2) unwrapping trio of points to find the local slope Figure 1.3. EFRs were recorded in
response to a 30-sec. continuous SAM tone, a 20 ms sample of which is shown in A, along with a typical single-trial and average response. To compute EFR phase-locking value (PLV), the
30-sec. response was split into
100-ms 'trials' and the phase of each trial (B, thin-line vectors) was computed. The phase for the single trial in A is shown is color coded to match. For clarity, only 100 trials are shown in B; Grey bars in C show a histogram of all
300 trials. All 300 single-trial phases
were vectorially summed to compute the PLV (B and C, thick red line).
(group delay), and 4) smoothing with a three-point moving average. Modulation sampling was sufficiently fine (30 or 60 Hz steps) to unambiguously unwrap phase (see Fig 1.5E-G). EFR PLV (Dobie and Wilson, 1989; Zhu et al., 2013) was calculated by 1) breaking the 30-sec. continuous record into 300 1 00-msec. 'trials' (Fig 1.3A, top panel), 2) measuring the phase of each trial at fm
by Fourier analysis (Fig 1.3B, thin lines), and 3) computing the magnitude of the vector average of all phases, assigning each vector equal amplitude (Fig 1.3B,C, thick red line). 'Trials' where voltage exceeded 15 pV were rejected as artifact. A 'trial'length of 100 msec. was chosen because it yielded a good signal-to-noise ratio for all data presented in this paper, for other datasets a different length may be necessary. Under this protocol, PLV ranges from 0 (random phase) to 1 (each 'trial' having identical phase).
Cochlear Immunostaining and Innervation Analysis: Mice were perfused transcardially with 4%
paraformaldehyde. Cochleas were decalcified, dissected into half-turns and incubated in primary antibodies: 1) mouse (IgG1) anti-CtBP2 from BD Biosciences at 1:200 and 2) mouse (IgG2) anti-GluA2 from Millipore at 1:2000. Primary incubations were followed by 60-min incubations in species-appropriate secondary antibodies. Cochlear lengths were obtained for each case, and a cochlear frequency map computed using a custom ImageJ plugin (http://www.masseyeandear. orq/research/otolaryngolog y/investigators/aboratories/eaton-peabody-laboratories/epl-h
istology-resources/) that translates cochlear position into frequency according to the published map for
the mouse (Mller et al., 2005; Taberner and Liberman, 2005). Confocal z-stacks from each ear were obtained using a glycerol-immersion objective (N.A. = 1.4) and 3.17X digital zoom on a Leica TCS SP5 confocal. Synapses in the IHC area were counted using Amira (Visage Imaging) to find the xyz coordinates of all the ribbons (CtBP2-postiive puncta), and custom re-projection software was then used to assess the fraction of ribbons with closely apposed glutamate-receptor patches (i.e. GluA2 puncta).
Statistical Analysis: Statistical testing was performed in MATLAB, using the anova, ranova, and multicompare functions for ANOVA, repeated-measures ANOVA, and post-hoc tests. When
statistically significant interactions were identified, post hoc two-sample t-tests were performed using a Holm-Bonferroni correction for multiple comparisons.
RESULTS
Noise-induced Synaptic Loss after Reversible Noise-Induced Threshold Shift
We titrated the sound level of an octave-band noise (8-16 kHz) such that a 2-hr exposure would produce a large temporary threshold shift (1 day post-exposure) but minimal permanent threshold shift (2 wks post-exposure). For DPOAEs and ABRs, peak threshold shift at 24 hrs. post-exposure was - 40 - 50 dB (data not shown). By 2 wks post-exposure, DPOAE thresholds
were not significantly elevated at any test frequencies except for at 45 kHz, where thresholds were elevated by 5-20 dB, depending on group (Fig 1.4A). ABR thresholds, measured at 11.3 and
32 kHz, were not significantly elevated in any groups (Fig 1.4B). Consistent with the observation
that overall noise vulnerability decreases with age from 8 to 16 wks (Kujawa and Liberman, 2006), complete threshold recovery was observed in the mice exposed at 16 wks of age (Fig 1.4A,B Group 2). The high-frequency threshold shifts in the 8-wk exposure group were associated with scattered loss of OHCs in the extreme basal regions of the cochlea (Fig 1.4C). While no significant differences were found in OHC loss between the animals exposed at 8 wks and those exposed at 16 wks, a trend toward more loss and a larger threshold shift suggest greater damage to OHC
20 1B 8 16 32 Frequency (kHz) 64 10 U) -7 0 C-) -20 7! '-8 1 --0 -- Group la (8 wk) ---o. Group lb (8 wk) Group2(16wk) 6 32 64 Frequency (kHz) 201D noise band 8 16 32 Cochlear Frequency (kHz T 15 10-CL : 5 -U)
0-)
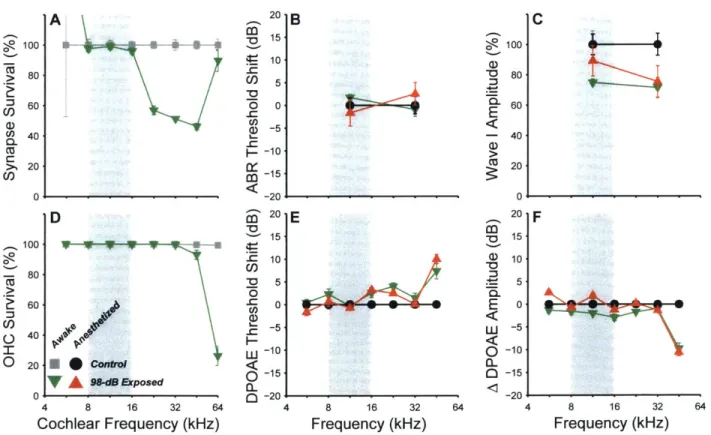
64 .. . .. -... -t , Z1~ noise band 8 16 32 Cochlear Frequency (kHz)Figure 1.4. Noise-exposure causes permanent synaptic loss with minimal permanent threshold shift. A,B, Mean DPOAE thresholds (A) and ABR thresholds (B) for each of three different groups, normalized to
their own age-matched controls: Group 1a - exposed to 98 dB SPL at 8 wks of age (4 control, 5 exposed),
Group 1b - exposed to 98 dB SPL at 8 wks (6 control, 6 exposed), and Group 2 - exposed to 99 dB SPL
at 16 wks (8 control, 10 exposed). C, OHC survival in control (black) and exposed (red) mice. D, Counts of pre-synaptic ribbons and post-synaptic glutamate receptors show loss of AN synapses on inner hair cells throughout the basal half of the cochlea. For histology (C&D), a subset of Group 2 was used (3 control, 5
exposed), all ears were used in Group 1a and Group 1b. A, There were no significant effects of exposure
on DPOAE thresholds by two-way repeated-measures ANOVA for group 1 a and group 2: F1,4 2) = 0.01 p =
0.91 and F (1102) = 0.05 p = 0.83. For group lb the effect of exposure was significant (interaction between
frequency and exposure condition F (6,0)= 5.97, p < 0.001). B, There were no significant effects of exposure
on ABR thresholds: group 1a: F(1,7) = 0.00 p = 1, group 1b: F(1,10) = 1.24 p = 0.29, group 2: F1 16) = 0.33 p
= 0.57. C, While the effect of exposure was significant (interaction F(14, 84)= 3.07, p < 0.01), there were no
significant pairwise comparisons after Bonferroni-Holm correction. D, There was a significant interaction
between frequency and exposure group for both Group lb (F ( = 16.56, p < 0.001) and Group 2 (F7,35)
= 8.26, p < 0.001). Stars indicate significant paired differences (p<0.01 or better) between exposed and
corresponding control. 16 20A wU 0 a-0 0 10-CO) -0 0--C (D-10- -20- 100- 80-60 U) 40- 20-0 0- 64 . . .
function in the 8 wk group. There were no significant IHC losses in any ears (effect of exposure by
two-factor repeated-measures ANOVA for group 1b and group 2: F(1,63) = 0.21 p = 0.66 and F(13 5, ) = 0.01 p = 0.94).
While noise-exposure minimally affected cochlear thresholds, histological analysis clearly demonstrated loss of AN synapses (Fig 1.4D). Each mammalian AN fiber contacts one IHC via a single synaptic terminal, with a single active zone, seen in the electron microscope as apposed pre- and post-synaptic plaques of membrane thickening, with a prominent pre-synaptic ribbon surrounded by a halo of synaptic vesicles (Liberman, 1980; Stamataki et al., 2006). At the light-microscopic level, we can count the synapses between AN fibers and IHCs by immunostaining pre-synaptic ribbons and post-synaptic glutamate receptors using antibodies against a ribbon protein (CtBP2: Khimich et al., 2005) and an AMPA-type glutamate receptor subunit (GluR2: Matsubara et al., 1996). In control mice, the number of synapses per IHC varies with cochlear location, with a peak of -18 synapses/HC in the middle of the cochlear spiral (Fig 1.4D). Noise-exposure caused significant synaptic loss throughout much of the basal half of the cochlea, with maximum losses occurring 1% to 2 octaves above the noise-exposure band (Fig 1.4D). At the 32 kHz region the mean loss of synapses was 53% (Group 1b) and 50% (Group 2). Prior work has shown that this synaptic loss is permanent, and followed by a delayed degeneration of spiral ganglion neurons (Kujawa and Liberman, 2009).
EFR measures in noise-exposed ears: effects of modulation frequency
EFRs were recorded 2 wks after noise exposure in response to 30-sec. continuous SAM tones. We placed the carrier frequencies at 32 kHz (Fig 1.5B,D,FH) and 11.3 kHz (Fig 1.5A,C,E,G) to probe cochlear regions with and without neuropathy, respectively (Fig 1.4D). We varied modulation frequency from 400 to 1400 Hz to probe responses from different portions of the ascending auditory pathways. With ABRs, contributions from different auditory centers are, at least partially, separated in time (Melcher and Kiang, 1996). With EFRs, responses from different nuclei are, at least partially, separated by modulation frequency: more peripheral neurons (e.g. AN) dominate at high modulation frequencies, whereas more rostral neurons (e.g. inferior colliculus) dominate at low modulation frequencies (Rickards and Clark, 1972; Herdman et al., 2002; Kuwada et al., 2002). In exposed animals, EFR amplitudes were reduced by up to 55% in response to the carrier frequency probing the neuropathic region (32 kHz), but unchanged for the non-neuropathic region (11.3 kHz). For the 32 kHz carrier, the maximum differences in amplitude were seen at higher modulation frequencies (near 1000 Hz), consistent with the idea that AN fibers contribute a larger portion of the response at these higher frequencies than more central auditory nuclei. We computed EFR PLV from the same data (see Methods). Changes in PLV mirrored the changes in EFR amplitude (Fig 1.5C,D).
To better understand the generators of the EFR in mouse, we calculated group delay from the slope of the phase-vs.-modulation-frequency function (Fig 1.5E-H; See Methods). For a single generator, group delay is equivalent to the latency of that generator. Group delay becomes complicated when two sources contribute, but can still be informative near the amplitude peaks,
11.3 kHz Carrier 32 kHz Carrier 0. A B S0.2 _ .0 01 0 C 0.0 10 F a) C 08 S0.6-LL o0. C0.2- -Control a. _ Exposed 0.0 E F 4-W (D v 3 I W 2 C 1 -(U -6 G H W 5-E 4-LLa)
>J
A/l . LW0 2 ~ ave I CL WaveI 0 (0 0 70 dB SPL 400 600 800 1000 1200 1400 400 600 800 1000 1200 1400Modulation Frequency (Hz) Modulation Frequency (Hz)
Figure 1.5. Cochlear neuropathy reduces EFR amplitudes and phase-locking values (PLVs). A-D, EFR amplitude (A,B) and EFR PLV (C,D) were decreased in the noise-exposed group for 32 kHz carriers (B,D:
F(1,231) = 6.21, p = 0.041; F(1,231) = 5.75, p = 0.048), but not for 11.3 kHz carriers (A,C: F(1,231) = 0.32, p = 0.59;
F 1 2 3 1= 0.18, p = 0.68). E,F, EFR phase, unwrapped for each individual and shifted by an integer number
ofcycles for best alignment in the 1 to 1.4 kHz range. G,H, EFR group delays, computed as the slope of
phase-vs.-modulation-frequency functions on an individual basis (see Methods). Horizontal lines show ABR
peak latencies measured at 70 dB SPL, the same level used for the SAM tone response shown here. Thin
dashed lines show individual noise floors (A and B only), thin solid lines show individual responses (E and
F), and thick lines and shaded areas show group means SEMs. Data are from Group 1a, recorded using
where group delay is equal to a weighted sum (by their amplitudes) of the two sources (Shera and Bergevin, 2012). Consistent with traveling wave delays in the cochlea, 11.3 kHz carriers (Fig
1.5G) gave rise to longer group delays than 32 kHz carriers (Fig 1.5H) at the 1-kHz modulation
01 =L > CL Cl, E =3 0 0_ Vx - Canal Ai SP sp IV III 1msec ).4 B ).3 0.0 -3 C -Control __ uabain 3 Vx-PinnaD Control Wave 11 2 w 1.5- k Wave I 0SI 0.5 32 kHz 70 dB SPL 5 1 1.5 2 Modulation Frequency (kHz)
Figure 1.6. Acute ouabain-induced neuropathy reveals hair cell contributions to ABRs and EFRs. A, ABR waveforms
in response to 70 dB SPL, 32 kHz
tone-pips. B,C, EFR amplitude and group delay in response to a 32 kHz carrier at 70 dB
SPL. Horizontal lines in C show ABR peak
latencies. In all panels, responses are shown before (black) and after (green) cochlear neuropathy induced by ouabain application to the round window. Data are obtained using the vertex to ear canal electrode configuration in an 8 wk mouse. Grey line in panel C replots control vertex to pinnaD mean group delay from Fig 1.5H.
frequency (arrows). The difference in group delays (3.1 vs. 2.0 = 1.1 ms) was significantly larger than that observed in ABR peak I latency (1.44 vs. 1.24 = 0.2
ms; two-sided paired t-test t(8) = 3.44, p = 0.009). The
difference in first-spike latency of mouse AN fibers at these two CF regions is intermediate (3.0 vs 2.5 = 0.5 ms; Fig. 4.5, Taberner, 2005). EFR group delay was unchanged following noise-exposure except at amplitude minima (Fig 1.5G,H), suggesting little shift in the locus of the neuronal groups dominating the responses. Large swings in group delay near amplitude minima do not necessarily indicate a change in generators, as phase-vs.-frequency gradients can be complicated when multiple sources destructively interfere (see Discussion).
Effects of electrode placement on EFR measures: determining sources
The EFRs in Figure 5 were recorded with a vertex to pinna electrode configuration (see Methods), similar to that used in clinical settings (Hall, 2006). However, noise-induced cochlear neuropathy may be more robustly detected by electrode configurations that increase the relative contributions from peripheral generators, such as electrodes on the tympanic membrane or round window niche as used in electrocochleography (Schwaber and Hall, 1990). To mimic these configurations in the mouse, we removed the pinna and placed the negative electrode through the cartilage of the ear canal, leaving the positive electrode at the vertex. This increased the amplitude of wave I and revealed a short-latency shoulder on wave I (Fig 1.6A), which is the analog of the summating potential (SP) recorded on the round window, reflecting summed receptor potentials from IHCs (Durrant et al., 1998; Yuan et al., 2014). Contributions of IHCs and AN fibers were also increased in the EFRs, as group
19 U-LU LL LU
I
Vx - PinnaD
A
Group la
PinnaD - PinnaD Vx - Pinna
Group lb Pinnav - Pinna B Vx - Canal C Group 2 Vx - Juxtapinna D I V I 'VV 1 I v
4
VIV
0.4 0.3 02 E 0.1 0.0 4 3.5 C E U-IL 3 2.5 CD 1 5 0 2~ 1 0.5 0 Control Exposed K Wave 1 5 1 1Wave I2 0.5 1 1.5 2 F L 0.5 1 1.5 2 G 1HV
M 0.5 1 1.5 2 N 0.5 1 1.5 2 0 0 1 SI 0.5 1 1.5 2 P 32 kHz 70dB SPL 0.5 1 1.5 2 Modulation Frequency (kHz) ZN 1 msec 0.5 1EFigure 1.7. Effects of electrode configuration on EFRs and ABRs. A-D, Mean ABR waveforms in response
to 70 dB SPL, 32 kHz tone-pips. E-J, Mean EFR amplitudes and K-P, mean group delays in response to
32 kHz carriers at 70 dB SPL. Horizontal lines (K-P) show ABR peak latencies; SP latency is shown only
when a clear local maxima is found. Because ABRs were not recorded for the pinna to pinna configuration, latencies (L,N) are from vertex to pinna data. Thin dashed lines (E-J) show individual noise floors, thick lines
and shaded areas in all panels show group means SEMs. Wave I amplitude was significantly increased
by a slight change in the location of the pinna electrode (A vs. B; two-way repeated-measures ANOVA: F(1,17) = 10.17, p = 0.005). For Group 2, group delay was significantly affected by electrode configuration (0
vs. P; three-way repeated-measures ANOVA: F (1,231) = 6.20, p = 0.02, significant pairwise effect of electrode
configuration at 1330 Hz (arrows), p = 0.002).
delays around 1 kHz (the amplitude peak) were shorter than those measured with the vertex to pinna configuration (Fig 1.6C, black line vs. grey line). Due to destructive interference between multiple sources, large group delay excursions around amplitude minima are not close to the latency of either source. Therefore, the large reversal of group delays around 750 Hz does not indicate a sudden change in the source of the EFRs at this frequency.
To validate the use of group delay to infer EFR generators, we made measurements in one mouse before and after inactivating AN responses, without affecting hair cell function, by round-window application of ouabain, a blocker of a neural-specific Na/K ATPase (Azarias et al., 2013; Obrien et al., 1994; Schmiedt et al., 2002). Ouabain effectively eliminated all ABR waves except those from pre-synaptic sources, i.e. the SP (Fig 1.6A, green line). Both EFR functions flattened, consistent with a transformation from multiple interacting sources to a single, short-latency source
(Fig 1.6B,C). Since EFR group delay was approximately equal to SP latency (0.8 ms), the post-ouabain EFR is likely generated by the IHCs: the SAM tone is similar to a series of rapid tone bursts, in response to which IHC receptor potentials fluctuate at the envelope frequency.
To determine if the vertex to ear canal configuration provides a more robust indicator of cochlear neuropathy, we measured ABRs and EFRs from two electrode configurations in one group of control and noise-exposed ears after completely removing the pinna: 1) vertex to cartilaginous ear canal (Fig 1.7C,I,0) vs. (2) vertex tojuxta-pinnal skin (Fig 1.7D,J,P; see Methods). EFR amplitudes were reduced by the neuropathy for both configurations, but dependence on modulation frequency was more complex in the vertex to ear canal configuration, suggesting greater constructive and destructive interference among multiple generators. At 1330 Hz modulation, the locus of the amplitude peak for the vertex to ear canal configuration, group delay was significantly shorter than for the vertex to juxtapinna configuration (Fig 1.70 vs. 7P), suggesting a greater contribution from peripheral generators, as confirmed by the relative heights of the early ABR waves (Fig 1.7C vs. 7D). At the highest modulation frequencies group delays for both configurations fell below 1 msec., indicating that responses were dominated by hair cell potentials.
As a fourth electrode configuration, we measured from ipsilateral pinna to contralateral pinna, thinking that this symmetrical placement ought to emphasize AN and cochlear nucleus contributions over those from higher auditory centers such as the inferior colliculus, given that the peripheral structures are more asymmetrically located with respect to the two electrodes (Ping et al., 2007). In two series of exposed and control ears, responses were simultaneously recorded
from vertex to pinna (Fig 1.7A,E,K,B,G,M) and pinna to pinna (Fig 1.7FL,H,N). Group delays were not generally shorter for the pinna to pinna configuration, perhaps because even the lowest modulation frequencies tested may still be too high for colliculus neurons, which respond poorly when modulation frequencies exceed 400 Hz (Joris et al., 2004, Fig. 9).
In Group lb the pinna electrode was placed slightly more ventral along the antitragus. Perhaps because this decreased the distance to the cochlea, this configuration resulted in a significantly larger SP and wave I amplitude with respect to Group 1a (Fig 1.7A vs. 7B). Along with this small change in ABR, we observed increased EFR amplitudes and shorter group delays at low modulation frequencies (Fig 1.7E,K vs. 7G,M), consistent with EFR contributions from AN
responses throughout the modulation frequency range tested.
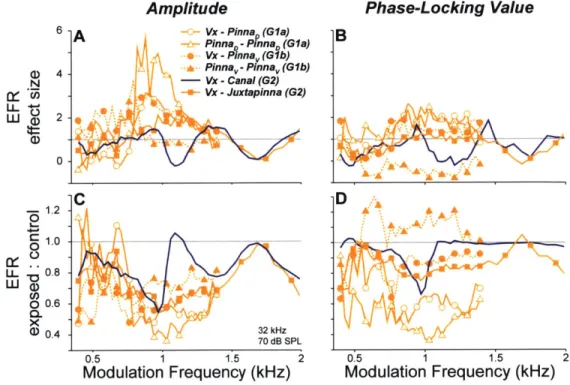
To more directly assess the effects of electrode configuration and modulation frequency on the detection of cochlear neuropathy, we computed amplitude ratios for responses measured in exposed vs. control ears. As shown in Fig 1.8C, amplitudes were reduced over a broad range of modulation frequencies in most electrode configurations. Surprisingly, although the vertex to ear canal configuration showed the largest AN contributions (as seen in the ABR), this configuration was the least effective in yielding consistent EFR amplitude reductions over a wide range of modulation frequencies (Fig 1.8C, purple line). Since the ability to separate two groups depends not only on the means, but also their variability, we calculated effect size (Hedge's g), the difference in means divided by the pooled standard deviation (Hentschke and Stottgen, 2011). As shown
Amplitude Phase-Locking Value
6 A Vx -PinnaD (Gla) B
PinnaQ -PinnaD (Gla)
Vx -Pinnav(G1b)
D 4 Pinna -Pinnav (Gib)
N - Vx - Canal (G2) Vx -Juxtapinna (G2) LL +-' LLJa 2 0 -2C D -- 1.2 0 Wa 0.6 (1 0.4 32 kHz 70 dB SPL 0.5 1 1.5 2 05 1 1.5 2
Modulation Frequency (kHz) Modulation Frequency (kHz)
Figure 1.8. EFR amplitudes (A,C) and phase-locking values (B,D) are most sensitive to cochlear neuropathy for modulation frequencies near 1 kHz. A,B, The effect size (Hedge's g; (Hentschke and StOttgen, 2011)) is the difference in group means (control vs. exposed) divided by the square root of the weighted sum of group variances. Higher values indicate greater separation of the two groups. C,D, Ratio between control and exposed means. Data in all panels are for the 32 kHz carrier at 70 dB SPL. Key in A applies to all panels.
in Fig 1.8A, effect size exceeded one standard deviation over a broad frequency range for the vertex to pinna, pinna to pinna, and vertex to juxtapinna configurations, but not for the vertex to ear canal configuration (orange lines vs. purple line). With EFRs, detection of neuropathy using an electrode configuration more sensitive to cochlear sources may be detrimental, as AN reductions due to neuropathy are diluted by hair cell potentials, which are unchanged. For such configurations, choice of modulation frequency becomes critical.
Ratio and effect size computed from PLVs were similar to those of amplitude, but effect size reached lower maximum values (Fig 1.8 B,D). In cases where signal-to-noise-ratio (SNR) was very high (Vx-Canal, see Fig 1.81), PLVs became saturated and were therefore less useful for detecting neuropathy (Fig 1.8B,D, purple line). In the pinna to pinna configuration of Group 1b,
noise floors were higher in some control animals (Fig 1.7H). This caused the two groups to have similar SNRs, and thus PLVs, so effect size was small (Fig 1.80, filled triangles). PLVs appear not to be useful in high-SNRs conditions such as these, but may be helpful in situations where SNR is poor.
EFR amplitude reductions were minimal at low modulation frequencies (below -600 Hz) for all configurations and groups (Fig 1.8C). If EFR at high modulation frequencies is dominated by more peripheral sources (i.e. hair cells and AN fibers), and by more central sources (e.g. inferior colliculus) at lower modulation frequencies (Kuwada et al., 2002), these data could be reflecting an amplified central auditory response in the face of peripheral response reductions after trauma (Gu et al., 2012; Schaette, 2014). This speculation is supported by the ABR data (Fig 1.9): while noise exposure significantly decreased the amplitudes of waves I, 11, and 111, waves IV and V were unaffected. Data in Figure 9 are for the vertex to pinna configuration of Group 1a. For Group 2, waves III and V were too small to measure in individual cases, but the trend towards less reduction in later waves can be seen in the mean waveforms: wave I ratios 0.66 & 0.70 vs. wave IV/V ratios 0.98 & 1.08 for Figure 7C and D, respectively. However, wave I and wave IV/V were equally reduced in Group 1b (0.68 vs. 0.69; Fig 1.7B). This difference could be due to the mild threshold shift observed in that group (Fig 1.4A).
Figure 1.9. Amplitude ratios between control and noise-exposed groups for each of the five ABR waves suggest
1.0 " central compensation. ABR waves were identified using a
0 .derivative-based peak-finding algorithm, and are measured
v -peak-to-trough. Data are from Group 1a, recorded using
<.* the vertex to pinnaD electrode configuration. There was
06 a significant interaction between wave and exposure by
a three-way repeated-measures ANOVA: F(4,35) = 3.19, p
* = 0.025. Significant exposed:control differences for each
0.2 32 kHz wave are indicated by stars: [1,ll,1ll,IV,V], p = [0.004, 0.015,
20 40 60 80 0.002, 1, 1].
EFR measures in noise-exposed ears: effects of stimulus level
We recorded amplitude-vs.-level functions for ABR and EFR at a variety of modulation frequencies for all three groups of noise-exposed mice. For brevity, only responses from the vertex to pinna configuration (Group 1a) are shown in Fig 1.10, but they are representative of all three groups. ABR wave I (Fig 1.1 OA,B) showed the behavior expected based on prior studies of noise-induced neuropathy in mice (Kujawa and Liberman, 2009): i.e. a fractional reduction of response amplitudes at 80 dB SPL comparable to the fractional loss of synapses in the appropriate cochlear region.
To examine the level dependence of noise-induced changes in EFR, we used the modulation frequency producing the largest responses in controls: 820 Hz for the 11.3 kHz carrier and 1000
11.3 kHz Carrier A 7-C E - Control Exposed 820 Hz B 32 kHz Carrier D F 1000 Hz 0.0 0.3 0.2 0.1 0.0 0.8 0.6 0.4 0.2 U.0 20 40 60 80 20 40 60 80 Level (dB SPL)
Figure 1.10. After neuropathic noise, changes in EFR amplitude (C,D) and phase-locking values (E,F) were more robust than changes in ABR Wave I amplitude (A,B). EFR data were measured at the modulation frequency producing the largest response in normal mice: 820 Hz for the 11.3 kHz carrier and 1000 Hz for the 32 kHz carrier (see Fig 1.4). ABR wave I amplitude was measured peak to following trough. Thin dashed lines show individual noise floors, and thick lines and shaded areas show group means SEMs. Data are from Group 1a, recorded using the vertex to pinnaD electrode configuration.
1.2- 0.8- 0.4-E CO uL O-U a0 E (, 0 -j I
Hz for the 32 kHz carrier (Fig 1.5A,B). The EFR data (Fig 1.10C,D) showed the same trends as seen in the ABR, however, the noise-induced changes in EFR were more robust: the scatter was smaller, and the inter-group difference were clearer. Changes to EFR PLV were similar to changes in EFR amplitude. This phase-locking measure may be particularly useful when signal-to-noise is poor (Zhu et al., 2013).
To more quantitatively assess the separability of control vs. noise-exposed groups in EFRs and ABRs, we calculated amplitude ratio and effect size as a function of level (Fig 1.11). Several general trends are seen regardless of electrode configuration. First, as suggested from the mean data, the effect sizes are higher with EFRs than with ABRs at all but the highest sound pressure levels, where EFRs become less affected by neuropathy, while effects on ABRs increase (Fig
1.11, A-F). This tendency likely reflects the fact that AN synchrony to amplitude-modulated tones
rises with sound pressure level to a peak and then falls, whereas rate response to pure tones rises to saturation and does not decline with further level increases.
The second general trend emerging from the effect size and ratio data (Fig 1.11) is that effects of neuropathy are minimal on both ABR and EFR at low sound levels. This trend is consistent with the idea that the noise damage is selective for fibers with low SRs and higher thresholds (Furman et al., 2013): since they don't normally contribute to either EFRs or ABRs at near-threshold levels, their loss does not affect the amplitudes of either.
Thirdly, it is important to consider the effects of modulation frequency. Across all electrode configurations, the most robust intergroup differences were seen with modulation frequencies between 820 and 1330 Hz. Using a higher modulation frequency, e.g. 1810 Hz, was less robust
Group la Group lb Group 2
Vx - PinnaD PinnaD PinnaD Vx - Pinnav Pinnav - Pinnav Vx - Canal Vx - Juxtapinna
A B C D E F 4 N 02 -A 0) G H I ,JK L O 550 Hz 1000 Hz 1330 Hz A Wave 820 Hz 1150 Hz 1810 Hz VWaveISP C: 1.0 0 V 0.8 -0 - ' (0.41 ___II_1__ 32_k_ z 20 40 60 80 20 40 60 80 20 40 60 80 20 40 60 80 20 40 60 80 20 40 60 80 Level (dB SPL)
Figure 1.11. EFR is a more powerful measure of cochlear neuropathy than ABR, and effect sizes are largest at moderate SPLs. A-F, Effect sizes (Hedge's g) for pairwise comparison between each noise-exposed group and its respective controls for both ABR (purple) and EFR (orange) measures. G-L, Simple ratios for the same pairwise comparisons shown in A-F. For clarity, only levels at which mean responses were one standard deviation above the mean noise floor are displayed. Key applies to all panels. Up-arrows