HAL Id: hal-02528292
https://hal.archives-ouvertes.fr/hal-02528292
Submitted on 16 Apr 2021
HAL is a multi-disciplinary open access
archive for the deposit and dissemination of sci-entific research documents, whether they are pub-lished or not. The documents may come from teaching and research institutions in France or abroad, or from public or private research centers.
L’archive ouverte pluridisciplinaire HAL, est destinée au dépôt et à la diffusion de documents scientifiques de niveau recherche, publiés ou non, émanant des établissements d’enseignement et de recherche français ou étrangers, des laboratoires publics ou privés.
Patient-specific high-tibial osteotomy’s ‘cutting-guides’
decrease operating time and the number of fluoroscopic
images taken after a Brief Learning Curve
Christophe Jacquet, Akash Sharma, Matthieu Ehlinger, Jean-Noël Argenson,
Sebastien Parratte, Matthieu Ollivier
To cite this version:
Christophe Jacquet, Akash Sharma, Matthieu Ehlinger, Jean-Noël Argenson, Sebastien Parratte, et al.. Patient-specific high-tibial osteotomy’s ‘cutting-guides’ decrease operating time and the num-ber of fluoroscopic images taken after a Brief Learning Curve. Knee Surgery, Sports Traumatology, Arthroscopy, Springer Verlag, 2020, �10.1007/s00167-019-05637-6�. �hal-02528292�
Patient‑specific high‑tibial osteotomy’s ‘cutting‑guides’ decrease
operating time and the number of fluoroscopic images taken
after a Brief Learning Curve
Christophe Jacquet1,2 · Akash Sharma1,2 · Maxime Fabre1,2 · Matthieu Ehlinger3 · Jean‑Noël Argenson1 ·
Sebastien Parratte1,2,4 · Matthieu Ollivier1,2
Abstract
Purpose Patient-specific cutting guides (PSCGs) have been advocated to improve the accuracy of deformity correction in opening-wedge high-tibial osteotomies (HTO). It was hypothesized that PSCGs for HTO would have a short learning curve. Therefore, the goals of this study were to determine the surgeons learning curve for PSCGs used for opening-wedge HTO assessing: the operating time, surgeons comfort levels, number of fluoroscopic images, accuracy of post-operative limb alignment and functional outcomes.
Methods This prospective cohort study included 71 consecutive opening-wedge HTO with PSCGs performed by three dif-ferent surgeons with different experiences. The operating time, the surgeon’s anxiety levels evaluated using the Spielberger State-Trait Anxiety Inventory (STAI), the number of fluoroscopic images was systematically and prospectively collected. The accuracy of the postoperative alignment was defined by the difference between the preoperative targeted correction and the final post-operative correction both measured on standardized CT-scans using the same protocol (ΔHKA, ΔMPTA, ΔPPTA). Functional outcomes were evaluated at 1 year using the different sub-scores of the KOOS. Cumulative summation (CUSUM) analyses were used to assess learning curves.
Results The use of PSCGs in HTO surgery was associated with a learning curve of 10 cases to optimize operative time (mean operative time 26.3 min ± 8.8), 8 cases to lessen surgeon anxiety levels, and 9 cases to decrease the number of fluoroscopic images to an average of 4.3 ± 1.2. Cumulative PSCGs experience did not affect accuracy of post-operative limb alignment with a mean: ΔHKA = 1.0° ± 1.0°, ΔMPTA = 0.5° ± 0.6° and ΔPPTA = 0.4° ± 0.8°. No significant difference was observed between the three surgeons for these three parameters. There was no statistical correlation between the number of procedures performed and the patient’s functional outcomes.
Conclusion The use of PSCGs requires a short learning curve to optimize operating time, reduce the use of fluoroscopy and lessen surgeon’s anxiety levels. Additionally, this learning phase does not affect the accuracy of the postoperative
correction and the functional results at 1 year.
Level of evidence II: prospective observational study.
Keywords High-tibial osteotomy · Patient-specific instruments · Accuracy · Correction · Fluoroscopy · Operative time
Introduction
In patients with moderate tibiofemoral osteoarthritis and varus alignment of the leg, an opening-wedge high-tibial osteotomy (HTO) is an ideal joint sparing operative solu-tion [3, 12, 26]. The angular correction must however be optimal in all three spatial planes for the osteotomy to be effective. In general we have seen Computer-assisted surgery being used intra-operatively to control the overall frontal alignment of the lower limbs axis, however, it has not been
This work was performed at the Institute for Locomotion, Aix-Marseille University, Aix-Marseille, France.
* Matthieu Ollivier
able to demonstrate an ability to control the degrees of cor-rection required within the osteotomy itself. In fact, the pin trackers of the navigation system cannot be implanted in each segment of the tibia to control the exact opening and therefore produce the exact correction required in the frontal and sagittal planes [27]. Furthermore, the navigation sys-tem requires a significant capital investment and the syssys-tem might be cumbersome to use in the operative room [11, 25]. The recent introduction of patient-specific cutting guides (PSCGs) based on pre-operative CT-scan templating now offers the possibility of providing instrumentation specific guides to each patient allowing the accurate control of the correction during the procedure for both the frontal and the sagittal planes [2, 21]. The accuracy of these systems has been demonstrated in different in vivo and in vitro studies, with superior correction accuracy when compared to con-ventional techniques [9, 13, 17]. These studies using PSCGs have also shown a decrease in operating time and a reduc-tion in the number of fluoroscopic images per intervenreduc-tion compared with conventional techniques [2, 7, 21]. As for each and every new technological advance that emerges, this system may have a learning curve, but this has not been evaluated in the literature [15, 29]. From our early experi-ence with systems, it was our hypothesis that PSCGs for opening-wedge high-tibial osteotomies (HTO) would have a short learning curve with regards to the operating time and the use of fluoroscopy without any influence on the accuracy of correction. The objectives of this study were to determine the surgeon’s learning curve for PSCGs in HTO surgery in order to identify the point of the surgeon’s transition from the learning phase to the proficiency phase based on the analysis of the following: (1) the intra-operative parameters measured as operating time, surgeon’s comfort levels using the State-Trait Anxiety Inventory (STAI) scoring system, the number of fluoroscopic images and (2) the radiological results measuring the differences between the targeted cor-rection and the achieved corcor-rection on pre and post-operative
CT-scans, respectively and (3) the functional outcomes at 1 year.
Materials and methods
All patients undergoing medial opening-wedge HTO with PSCGs between February 2014 and November 2017 were enrolled in this single-centre, prospective, observational study. The inclusion criteria were: patients < 60 years old with medial knee osteoarthritis (Ahlbäck ≤ 3 [1]) with sig-nificant genu varum (HKA < 176°). The exclusion criteria were: advanced osteoarthritis (Ahlbäck > 3). Patient consent was obtained pre-operatively after they were informed of the procedure in accordance with the principles of the Declara-tion of Helsinki. All osteotomies were performed by three different surgeons. The first surgeon specialized in sports surgery of the knee and hip was referenced in this study as the “Sports” surgeon (SP). The second surgeon who is a specialist in knee and hip arthroplasty surgery and more specifically reconstructive surgery was referenced as the “Recon” surgeon (MFA). The last surgeon was trained in sports surgery and arthroplasty; we referenced him as the “Combi” surgeon (MO). Details regarding all surgeon’s pro-cedures are presented Table 1.
Prior to the start of the enrollment period, all three sur-geons had significant experience performing osteotomies (more than 50 cases each) using the conventional technique with the same fixation plate, with no experience of using PSCGs for osteotomy previously. Preoperatively, all patients had conventional radiographs taken (weight-bearing long-leg, A/P and lateral views) and underwent a CT-scan using a dedicated protocol including the hip, the knee and the ankle. The targeted correction was defined by the surgeon based on the physical examination and the radiological analysis of the hip–knee–ankle (HKA) angle, medial proximal tibia angle (MPTA) and the posterior proximal tibia angle (PPTA).
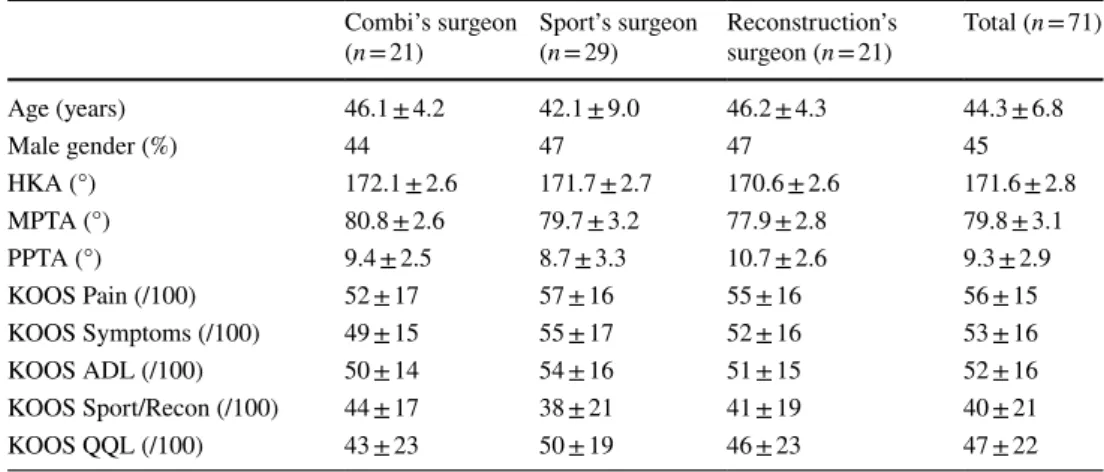
Table 1 Pre-operative data in patients undergoing HTO with PSCGs/all the P value between the three surgeons were non-significant
HKA hip–knee–ankle angle, MPTA medial proximal tibial angle, PPTA posterior plateau tibial angle
Combi’s surgeon
(n = 21) Sport’s surgeon (n = 29) Reconstruction’s surgeon (n = 21) Total (n = 71) Age (years) 46.1 ± 4.2 42.1 ± 9.0 46.2 ± 4.3 44.3 ± 6.8 Male gender (%) 44 47 47 45 HKA (°) 172.1 ± 2.6 171.7 ± 2.7 170.6 ± 2.6 171.6 ± 2.8 MPTA (°) 80.8 ± 2.6 79.7 ± 3.2 77.9 ± 2.8 79.8 ± 3.1 PPTA (°) 9.4 ± 2.5 8.7 ± 3.3 10.7 ± 2.6 9.3 ± 2.9 KOOS Pain (/100) 52 ± 17 57 ± 16 55 ± 16 56 ± 15 KOOS Symptoms (/100) 49 ± 15 55 ± 17 52 ± 16 53 ± 16 KOOS ADL (/100) 50 ± 14 54 ± 16 51 ± 15 52 ± 16 KOOS Sport/Recon (/100) 44 ± 17 38 ± 21 41 ± 19 40 ± 21 KOOS QQL (/100) 43 ± 23 50 ± 19 46 ± 23 47 ± 22
An order form was then filled by the surgeon to convey the requested corrections to the engineers.
Virtual templating
The CT-scan protocol consisted of acquiring images centred on the femoral head, the knee (allowing the distal femur and 15 cm of the proximal tibia to be captured), and one cen-tred over the ankle. The slice thickness was 0.625 mm for the knee and 2 mm for the hip and ankle (GE Light Speed VCT64). All measurements were constructed using algo-rithm-calculated constructions on the corresponding tibia which were then mapped. Previous accuracy and reproduc-ibility analysis estimated that this system allows automated measurement of upper femur anatomy with a margin of error < 2 mm and < 1° [4]. The concept was then to cre-ate a 3D model of the tibia using the CT-scan images and to mimic the HTO correction following the request of the surgeons with regard to the degrees of correction required in both the frontal and sagittal planes. After simulating the osteotomy on the 3D tibial model, the plate (Activmotion HTO plate, Newclip Technics®, Haute-Goulaine, France)
was virtually positioned in the ideal anatomical location to stabilize the osteotomy. The placement of the screws and
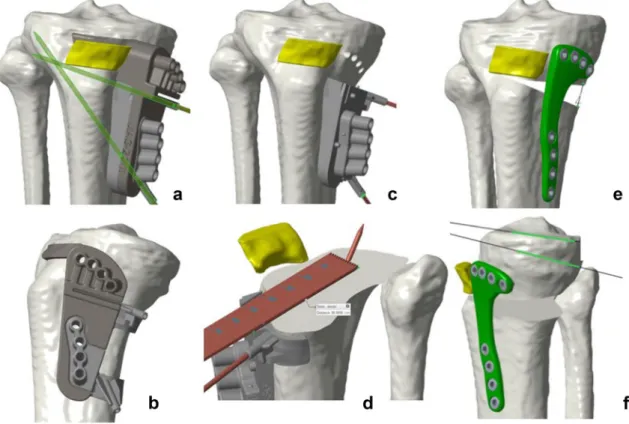
screw sizes were also calculated. Once the final construct was virtually created, the pre-osteotomy cutting jig was designed to guide the cut and to drill the final screws hole. Additionally, two k-wires were virtually positioned to pro-tect the lateral hinge during the cut and the opening of the wedge. Intra-operatively, the surgeon positioned the PSCG on the tibia, drilled the holes, performed the cut, and carried out the opening of the wedge. The plate was positioned on the tibia and when the plate holes match the pre-drilled holes on the tibia, the correction was achieved both on the frontal and the sagittal plane using this method (Fig. 1a–f).
Surgical technique
After performing the standard surgical approach, the PSCG was positioned on the tibia and secured by using two k-wires [8]. The final position of the cutting guide was confirmed with fluoroscopy. The screw holes were then pre-drilled using the jig and dedicated pin were inserted to secure the position of the jig on the tibia. Using the dedicated slot of the jig, the saw blade was guided during the cut. The upper part of the PSCG was then removed to finalize the cut and another slot of the jig was used to guide the bi-planar ante-rior cut below the tibial tuberosity. The osteotomy cut was
Fig. 1 Preoperative 3D templating illustrating the operative technique of custom cutting guides. a, b Optimal positioning of the cutting guide with two pins (one to protect the lateral hinge during the oste-otomy and one to guide the saw). c Pre-drilling the eight holes of the
plate with the guide and removing the top of the guide. d Illustration of lateral hinge protection by pin using the dedicated slot of the guide with the saw. e, f Opening of the osteotomy with definitive position-ing of the plate and screws on the pre-drilled holes
then gradually opened/distracted using a laminar-spreader until having the holes of the plate aligned with the pre-drilled holes on the tibia. The screws were then inserted in the plate to secure the construct. As the screw length was measured on the virtual pre-operative planning, sizing the screws intra-operatively was no longer required. The oste-otomy gap was then filled with an injectable phosphocalcic cement (Quickset, Graftys®, Aix-en-Provence, France).
Post‑operative clinical and radiological follow‑up
Postoperatively, the same rehabilitation protocol was applied for all patients. They were allowed free range of knee motion and weight-bearing as tolerated protected with the use of crutches. One month post-operatively patients underwent both clinical and radiological examination which included the same standardized CT-scan protocol used pre-oper-atively. Subsequently this was then used to evaluate the accuracy of the correction compared to the pre-operative planning. Further follow-up visits were scheduled at 3, 6, 9 and 12 months which included a clinical evaluation and standard radiographic analysis (A/P and lateral at 3, 6, 9 and 12 months and long-leg standing at 6 and 12 months). Patients were allowed to return to their recreational activi-ties at 6 months.
Outcome measures
1. Operating time Operating time was defined as the time from the surgical incision to final wound closure. 2. Surgeon anxiety levels The Spielberger State-Trait
Anxiety Inventory (STAI) questionnaire is a validated subjective assessment tool to quantify an individual’s stress levels with individual traits arising from the clini-cal environment [19]. The six-item questionnaire has a 4-point rating scale and total scores range from 6 to 24, with higher values indicating higher levels of stress. The STAI questionnaire was completed by each surgeon at the end of each intervention.
3. Number of fluoroscopic images taken intraoperatively at the end of each surgery.
4. Accuracy of post-operative alignment correction The accuracy of the postoperative alignment correction was defined by the difference between the targeted correc-tion defined preoperatively and the correccorrec-tion obtained postoperatively measured on the CT-scan (ΔHKA, ΔMPTA, ΔPPTA). For this evaluation the intra- and inter-observer intraclass correlation coefficient were, respectively, 0.86 and 0.81.
5. Functional outcomes To evaluate the functional out-comes, the Knee Osteoarthritis Outcome Score was used [24]. Patients were asked to complete this score before the surgery and post-operatively at 1 year. The KOOS is
a validated knee specific PROM. It holds 42 items in five separately scored subscales: KOOS Pain, KOOS Symp-toms, Function in daily living (KOOS ADL), Function in Sport and Recreation (KOOS Sport/Rec), and knee-related Quality of Life (KOOS QOL). The functional improvements were measured as the differences between the pre-operative values and values measured at 1 year postoperatively for each sub-category of the KOOS and defined as: ΔPain, ΔSymptoms, ΔADL, ΔSport/Rec and ΔQQL for each patient.
During the enrolment period, 71 patients were included (21 performed by “Combi”, 21 by “Reconstruction” and 29 by “Sport”). The mean patient age was 44.3 ± 6.8 No patient was lost to follow-up at 1 year. Pre-operatively the mean HKA angle was 171.6 ± 2.8; the mean MPTA was 79.8° ± 3.1°; the mean PPTA was 9.3° ± 2.9° (Table 1).
Local Ethical Committee approval was obtained prior to study’s initiation (Comité Informatique et Liberté (CIL)/ Assistance Publique des Hopitaux de Marseille (AP-HM)/ Registration Number: 2014-36).
Statistical analysis
Sample size calculation was performed using operative time as the primary outcome measure and published data on operative times with similar surgical techniques [2, 21]. The minimal clinical difference was set at 10 min and standard deviation at 10 min [2, 21]. This study required 20 patients in each arm to detect this minimum difference between sur-geons in terms of operative time using a tailed, two-sample t tests with a power of 80% and significance level of 5%. The CUSUM sequential analysis tool was used to assess learning curves for operative time, surgeon stress levels as assessed using the STAI questionnaire, Number of fluoroscopic images taken intraoperatively, and accuracy of lower-limb alignment correction and functional outcomes. Standardized target values for the CUSUM analyses were set using the overall mean values for these outcome measures. CUSUM values represent a running total of the differences between the value of each data point and the standardized target values for each outcome. Learning curves for accuracy of lower-limb alignment correction was assessed using the calculation of the root mean square error values for radio-logical outcomes. Categorical data were compared using the Chi square test and Fisher’s exact test where greater than 25% of cells had less than 5 cases. Normally distributed continuous variables were compared using independent t tests for unpaired variables, paired t test for paired (matched) variables, and one-way ANOVA for multiple variables, The Mann–Whitney test was used for non-parametric data. Sta-tistical significance was set at P < 0.05 for all staSta-tistical tests.
All statistical analyses were performed using SPSS software version 21 (SPSS Inc., Chicago, IL, USA).
Results
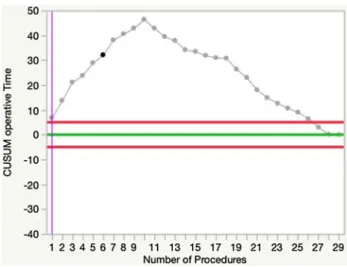
The mean operating time for all the patients was 26.3 min ± 8.8. No significant difference was observed between the three surgeons (Table 2). CUSUM analysis for operating time revealed a sharp inflexion point after the first 10 cases for every surgeon (10 cases for “Sport”, 7 cases for “Combi” and 9 cases for “Reconstruction”). This analysis helped to identify two distinct phases in the learning curve. Phase 1 represents the initial learning segment and phase 2 represents the proficiency stage (Fig. 2).
The mean surgeon’s anxiety level for all three surgeons was 8 ± 3. No significant difference was observed for this parameter between the three surgeons (Table 2). CUSUM analysis of preoperative stress levels as assessed using the STAI questionnaire revealed an inflexion point after 8 cases for every surgeon (5 cases for “Sport”, 7 cases for “Combi” and 10 cases for “Reconstruction”) (Fig. 3).
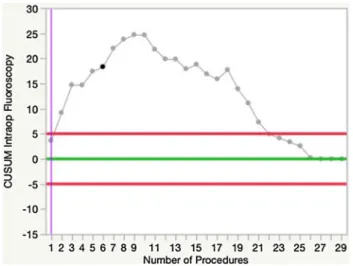
The mean number of fluoroscopic images for all the sur-gery was 4.3 ± 1.2. No significant difference was observed for this parameter between the three surgeons (Table 2). CUSUM analysis of number of fluoroscopic images revealed an inflexion point after 9 cases for every surgeon (10 cases for “Sport”, 9 cases for “Combi” and 8 cases for “Recon-struction”) (Fig. 4).
The mean ΔHKA was 1.0° ± 1.0°, the mean ΔMPTA 0.5° ± 0.6°, and the mean ΔPPTA was 0.4° ± 0.8°. No significant differences were observed between all three surgeons for these three parameters (Table 2) and the CUSUM analysis did not show any learning effect for
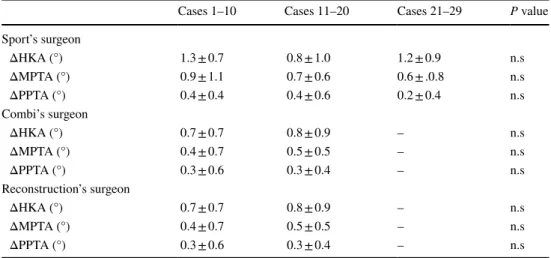
these parameters (Fig. 5). The subgroup analysis of the first 10 cases compared with the next 10 (as well as the following 9 for “Sports”) for each surgeon, the results did not show any significant difference in postoperative align-ment accuracy (Table 3).
No significant difference was observed between the three surgeons for all the items of the KOOS at 1 year post-operative (Table 2). Moreover, the CUSUM analy-sis did not show any learning effect for this parameter. An average improvement of 29 ± 24 for the KOOS Pain, 29 ± 26 for the KOOS Symptom, 29 ± 27 for the KOOS ADL, 27 ± 34 for the KOOS Sport/Reco and 29 ± 31 for the KOOS QQL was observed (all P < 0.001).
Table 2 Post-operative data in patients undergoing HTO with PSCGs/all the P value between the three surgeons were non-significant (n.s.)
STAI The Spielberger State-Trait Anxiety Inventory, Post-operative bleeding bleeding was defined by the
quantity of blood in the drain on day 2, ΔKOOS Pain, ΔKOOS Symptoms, ΔKOOS ADL, ΔKOOS Sport/
Reco and ΔKOOS QQL difference between the value obtained in the pre-operative questionnaire and that
obtained at 1 year postoperatively
Combi’s
sur-geon (n = 21) Sport’s sur-geon (n = 29) Reconstruction’s surgeon (n = 21) Total (n = 71) Operative time (min) 28.9 ± 9.7 25.2 ± 6.6 27.0 ± 10.1 26.3 ± 8.8 Number of fluoroscopy 4.7 ± 1.2 4.1 ± 1.1 4.6 ± 1.5 4.3 ± 1.2 Surgical surgeon anxiety’s level 7 ± 2.7 7 ± 2 9 ± 3.5 8 ± 3
ΔHKA 0.7 ± 0.8 1.2 ± 1.0 0.9 ± 1.0 1.0 ± 1.0 ΔMPTA 0.4 ± 0.5 0.7 ± 0.7 0.4 ± 0.5 0.5 ± 0.6 ΔPPTA 0.3 ± 0.5 0.4 ± 0.7 0.6 ± 0.9 0.4 ± 0.8 ΔKOOS Pain 33 ± 27 28 ± 22 27 ± 25 29 ± 24 ΔKOOS Symptoms 26 ± 28 29 ± 24 33 ± 23 29 ± 26 ΔKOOS ADL 28 ± 25 28 ± 27 30 ± 29 29 ± 27 ΔKOOS Sport/Reco 19 ± 31 32 ± 35 33 ± 29 27 ± 34 ΔKOOS QQL 33 ± 31 20 ± 36 32 ± 29 29 ± 31
Fig. 2 CUSUM analysis charts demonstrating the mean learning curve for operative time for the three surgeons; a sharp inflexion was observed after 10 cases separating the learning phase to the profi-ciency phase
Discussion
The main findings of this study were; using PSCGs during HTO was associated with a learning curve of 10 cases for a decrease in the operating time, 8 cases for an improvement in surgeon comfort levels and 9 cases for a reduction in the number of fluoroscopic images needed during HTO. There was no learning curve to achieve an accurate correction when compared to pre-operative planning and furthermore there was no learning curve to observe an improvement in functional outcome.
With the advance of new technologies in orthopaedic sur-gery aimed at improving surgical accuracy and improving the comfort of the operating surgeon, the learning curve and the impact on the outcome is often unknown. Currently there are no data on the learning curves associated with PSCG and HTO surgery. Recently some studies have explored the learning curve associated with robot-assisted surgery in knee arthroplasty [15, 16, 29]. This present study recognizes the use of PSCG in HTO surgery has a similar short learning phase akin to robot-assisted surgery in knee arthroplasty, and as a whole takes the advantage of exploiting the benefits without adversely affecting the accuracy of the outcome.
Therefore, a comparison of the different parameters within the surgeons learning curve with conventional tech-niques is necessary. Few studies have evaluated operating time with a conventional HTO technique. Shi et al. [28] in their comparative study of PSCGs versus conventional tech-nique, measured a mean operating time of 96.5 min for the conventional group and 77.7 min for the PSCGs group. In another comparative study of Pérez-Mañanes et al. [23] the mean tourniquet time for the conventional technique was 92 min versus 62 min for the PSCGs group. The analysis of the learning curves obtained in this study showed a benefit in terms of operating time even during the initial learning segment using PSCGs. During the second phase (proficiency stage), the comparison of the results of this study with those previously published showed that a potential short-ening of 70% of the operating time can be expected com-pared to conventional technique. The operating time learn-ing curves were also relatively similar between the three surgeons (10 cases for “Sport”, 7 cases for “Combi” and 9 cases for “Reconstruction”), although their experiences and their fields of activity were different. It shows that the relative ease of use of PSCGs is not related to the surgeon’s
Fig. 3 CUSUM analysis charts demonstrating the mean learning
curve time for the surgeon’s anxiety level for the three surgeons; a sharp inflexion was observed after 8 cases
Fig. 4 CUSUM analysis charts demonstrating the mean learning
curve for the number of fluoroscopic images for the three surgeons; a sharp inflexion was observed after 9 cases
Fig. 5 CUSUM analysis charts for the ΔHKA for the three surgeons. No learning curve effect was observed
background. In this study, improvements in the surgeon’s anxiety levels with PSCGs followed the same trend than the trend observed for the operating time with a baseline STAI scores reached after eight cases. Six-item State-Trait Anxiety Inventory is a short-form version of the state scale, consisting of six items chosen for reliability and validity. When compared with the full-form of the STAI, the six-item version offers a briefer and just as acceptable scale for subjects while maintaining results that are comparable to those obtained using the full-form of the STAI [19].
The use of fluoroscopy is necessary in the conventional technique as well as in the use of PSCGs. However, in a study by Pérez-Mañanes et al. [23] the mean number of fluoroscopic images required for each intervention was 55 for the conventional technique. In this present study, the mean number of images taken were 4 ± 1 with a learning curve of 9 cases. Therefore, the use of PSCGs drastically reduces radiographic exposure to the patients.
Another objective of this study was to analyse the reliabil-ity of this technique to reach the targeted correction. There was no learning curve for achieving the planned correction when compared to the post-operative surgical correction. Few studies have been published on the use of PSCGs for HTO. Victor et al. [30] reported accuracy of 1° in the frontal plane and 2° in the sagittal plane; however, the analysis was performed with radiographs only. Perez-Mananes et al. [23] ]had similar results in the frontal plane with an accuracy of 2°, but the tibial slope was not measured nor was a CT-scan performed. Munier et al. [21] in their pilot study observed an accuracy measured on a CT-scan of less than 2° in the fron-tal and sagitfron-tal plane. A recent study [14] demonstrated that incorrect positioning of patient-specific instruments within the possible degrees of freedom in HTO has no considerable
influence on mechanical leg axis correction which further reinforces the reproducibility of this procedure.
The use of navigation is another established technique that theoretically improves the accuracy of postoperative limb alignment correction. Saragaglia et al. [25] reported a 96% accuracy for a planned HKA angle of 184° ± 2° in their study with computer-assisted surgery. The results of this study compares favourably to those of Saragaglia. How-ever, navigation lengthens the operating time (average time of operative procedure: 82 ± 9.3 min for Hankemeier and 74.6 ± 11.4 min for Saragaglia) [11, 25]. Published radio-logical results often point to an under correction after HTO surgery with conventional techniques. The problem is par-ticularly apparent with opening-wedge procedures as the under correction is about 2° more than with closing wedge [6, 22]. Marti et al. [20] reported a 50% accuracy between the correction achieved and the one planned after opening-wedge HTO. This was vastly different from this study where the use of PSCGs led to a reliable correction that was similar to the planned correction.
Regarding the functional results at 1 year evaluated by the different items of KOOS, a significant improvement of these scores without a learning curve effect and without sig-nificant difference between the three surgeons was observed. The average gains observed in this study for each KOOS item seem superior to those using conventional osteotomy techniques [10, 18, 31]. However, the short decline and the absence of a control group do not currently allow this study to conclude on the superiority of PSCGs in terms of func-tional results. It will be necessary to continue to monitor these patients to determine whether an improved accurate correction affects the functional outcomes of patients in the future.
Table 3 Accuracy of post-operative limb alignment for the three surgeons, subgroup analysis of 10 patients
HKA hip–knee–ankle angle, MPTA medial proximal tibial angle, PPTA posterior plateau tibial angle/
the accuracy of the postoperative alignment was defined by the difference between the desired correc-tion defined preoperatively and the correccorrec-tion obtained postoperatively measured on CT-scan (ΔHKA, ΔMPTA, ΔPPTA)
Cases 1–10 Cases 11–20 Cases 21–29 P value
Sport’s surgeon ΔHKA (°) 1.3 ± 0.7 0.8 ± 1.0 1.2 ± 0.9 n.s ΔMPTA (°) 0.9 ± 1.1 0.7 ± 0.6 0.6 ± .0.8 n.s ΔPPTA (°) 0.4 ± 0.4 0.4 ± 0.6 0.2 ± 0.4 n.s Combi’s surgeon ΔHKA (°) 0.7 ± 0.7 0.8 ± 0.9 – n.s ΔMPTA (°) 0.4 ± 0.7 0.5 ± 0.5 – n.s ΔPPTA (°) 0.3 ± 0.6 0.3 ± 0.4 – n.s Reconstruction’s surgeon ΔHKA (°) 0.7 ± 0.7 0.8 ± 0.9 – n.s ΔMPTA (°) 0.4 ± 0.7 0.5 ± 0.5 – n.s ΔPPTA (°) 0.3 ± 0.6 0.3 ± 0.4 – n.s
There are several limitations of this study that must be considered when interpreting these findings. Firstly, the sur-geons who practised these procedures were familiar with HTO surgery fixation and had already used custom cutting guides in knee arthroplasty surgery. Their learning curve may not be directly transferrable to other less experienced surgeons. Secondly, follow-up time was limited to 1 year following surgery and so long-term data on functional out-comes and revision rates were not available. Thirdly, it is a non-comparative study and although data exist on the accuracy of correction, the operative time and the use of fluoroscopy during conventional surgery, it would have been valuable to be able to make a direct comparison using a control group. Despite these limitations, we believe that this project is original and fairly designed to analyse the learning curve in using PSCGs in HTO surgery and the accuracy of the correction obtained. Moreover, a significant number of patients (71) compared to studies using PSCGs in HTO were included (10 for Munier et al. [21] 8 for Perez-Mananes et al. [23] and 14 for Victor et al. [30]). The use of a CT-scan to measure the accuracy of the postoperative correction made it possible to limit the uncertainty of the measurement on standards radiographs [5]. The HTOs were performed by three different surgeons with different experiences of knee surgery, which schematically represents the different types of practitioners likely to use PSCGs in their daily practice.
The results of this study should reassure surgeons want-ing to start uswant-ing PSCGs durwant-ing HTO in their daily practice. Indeed, the use of PSCGs requires a short learning curve to increase the efficiency of operating time and reduction in the use of fluoroscopic imaging. But, there is no impact of cumulative experience on accuracy of limb alignment, which is important for the safe implementation of this procedure into routine surgical practice.
Conclusion
In conclusion, the use of PSCGs requires a short learning curve to increase the efficiency of operating time and reduc-tion in the use of fluoroscopic imaging. There is no learn-ing curve associated with improvlearn-ing the accuracy of post-surgical HTO correction and the functional results at 1 year.
Funding No funding was required for this study. Compliance with ethical standards
Conflict of interest Some of the authors disclosed potential conflict of interest.
Ethical approval Local ethic committee approval was obtained prior to study Initiation (N°2014-36).
References
1. Ahlbäck S, Rydberg J (1980) X-ray classification and examination technics in gonarthrosis. Lakartidningen 77(2091–2093):2096
2. Arnal-Burró J, Pérez-Mañanes R, Gallo-Del-Valle E, Igualada-Blazquez C, Cuervas-Mons M, Vaquero-Martín J (2017) Three dimensional-printed patient-specific cutting guides for femoral varization osteotomy: do it yourself. Knee 24:1359–1368 3. Asik M, Sen C, Kilic B, Goksan SB, Ciftci F, Taser OF (2006)
High tibial osteotomy with Puddu plate for the treatment of varus gonarthrosis. Knee Surg Sports Traumatol Arthrosc 14:948–954 4. Banerjee S, Faizan A, Nevelos J, Kreuzer S, Burgkart R, Har-win SF, Mont MA (2014) Innovations in hip arthroplasty three-dimensional modeling and analytical technology (SOMA). Surg Technol Int 24:288–294
5. Boonen B, Kerens B, Schotanus MGM, Emans P, Jong B, Kort NP (2016) Inter-observer reliability of measurements performed on digital long-leg standing radiographs and assessment of validity compared to 3D CT-scan. Knee 23:20–24
6. Brouwer RW, Bierma-Zeinstra SMA, van Raaij TM, Verhaar JaN (2006) Osteotomy for medial compartment arthritis of the knee using a closing wedge or an opening wedge controlled by a Puddu plate. A one-year randomised, controlled study. J Bone Joint Surg Br 88:1454–1459
7. Corona PS, Vicente M, Tetsworth K, Glatt V (2018) Prelimi-nary results using patient-specific 3d printed models to improve preoperative planning for correction of post-traumatic tibial deformities with circular frames. Injury 49(Suppl 2):S51–S59 8. Dessyn E, Sharma A, Donnez M, Chabrand P, Ehlinger M,
Argenson J-N, Parratte S, Ollivier M (2019) Adding a protec-tive K-wire during opening high tibial osteotomy increases lat-eral hinge resistance to fracture. Knee Surg Sports Traumatol Arthrosc. https ://doi.org/10.1007/s0016 7-019-05404 -7
9. Donnez M, Ollivier M, Munier M, Berton P, Podgorski J-P, Chabrand P, Parratte S (2018) Are three-dimensional patient-specific cutting guides for open wedge high tibial osteotomy accurate? An in vitro study. J Orthop Surg Res 13:171 10. Duivenvoorden T, Brouwer RW, Baan A, Bos PK, Reijman
M, Bierma-Zeinstra SMA, Verhaar JaN (2014) Comparison of closing-wedge and opening-wedge high tibial osteotomy for medial compartment osteoarthritis of the knee: a randomized controlled trial with a six-year follow-up. J Bone Joint Surg Am 96:1425–1432
11. Hankemeier S, Hufner T, Wang G, Kendoff D, Zeichen J, Zheng G, Krettek C (2006) Navigated open-wedge high tibial oste-otomy: advantages and disadvantages compared to the conven-tional technique in a cadaver study. Knee Surg Sports Traumatol Arthrosc 14:917–921
12. Hantes ME, Natsaridis P, Koutalos AA, Ono Y, Doxariotis N, Malizos KN (2018) Satisfactory functional and radiological outcomes can be expected in young patients under 45 years old after open wedge high tibial osteotomy in a long-term follow-up. Knee Surg Sports Traumatol Arthrosc 26:3199–3205 13. Jacquet C, Chan-Yu-Kin J, Sharma A, Argenson J-N, Parratte
S, Ollivier M (2018) More accurate correction using “patient-specific” cutting guides in opening wedge distal femur vari-zation osteotomies. Int Orthop. https ://doi.org/10.1007/s0026 4-018-4207-1
14. Jud L, Fürnstahl P, Vlachopoulos L, Götschi T, Leoty LC, Fucentese SF (2019) Malpositioning of patient-specific instru-ments within the possible degrees of freedom in high-tibial oste-otomy has no considerable influence on mechanical leg axis correction. Knee Surg Sports Traumatol Arthrosc. https ://doi. org/10.1007/s0016 7-019-05432 -3
15. Kayani B, Konan S, Huq SS, Tahmassebi J, Haddad FS (2018) Robotic-arm assisted total knee arthroplasty has a learning curve of seven cases for integration into the surgical workflow but no learning curve effect for accuracy of implant positioning. Knee Surg Sports Traumatol Arthrosc. https ://doi.org/10.1007/s0016 7-018-5138-5
16. Kayani B, Konan S, Pietrzak JRT, Huq SS, Tahmassebi J, Haddad FS (2018) The learning curve associated with robotic-arm assisted unicompartmental knee arthroplasty: a prospective cohort study. Bone Joint J 100-B:1033–1042
17. Kroes T, Valstar E, Eisemann E (2015) Numerical optimization of alignment reproducibility for customizable surgical guides. Int J Comput Assist Radiol Surg 10:1567–1578
18. Lind-Hansen TB, Lind MC, Nielsen PT, Laursen MB (2016) Open-wedge high tibial osteotomy: RCT 2 years RSA follow-up. J Knee Surg 29:664–672
19. Marteau TM, Bekker H (1992) The development of a six-item short-form of the state scale of the Spielberger State-Trait Anxiety Inventory (STAI). Br J Clin Psychol 31(Pt 3):301–306
20. Marti CB, Gautier E, Wachtl SW, Jakob RP (2004) Accuracy of frontal and sagittal plane correction in open-wedge high tibial osteotomy. Arthroscopy 20:366–372
21. Munier M, Donnez M, Ollivier M, Flecher X, Chabrand P, Argen-son J-N, Parratte S (2017) Can three-dimensional patient-specific cutting guides be used to achieve optimal correction for high tibial osteotomy? Pilot study. Orthop Traumatol Surg Res 103:245–250 22. Nerhus TK, Ekeland A, Solberg G, Sivertsen EA, Madsen JE, Heir
S (2017) Radiological outcomes in a randomized trial comparing opening wedge and closing wedge techniques of high tibial oste-otomy. Knee Surg Sports Traumatol Arthrosc 25:910–917 23. Pérez-Mañanes R, Burró JA, Manaute JR, Rodriguez FC, Martín
JV (2016) 3D surgical printing cutting guides for open-wedge high tibial osteotomy: do it yourself. J Knee Surg 29:690–695
24. Roos EM, Lohmander LS (2003) The Knee injury and Osteoar-thritis Outcome Score (KOOS): from joint injury to osteoarOsteoar-thritis. Health Qual Life Outcomes 1:64
25. Saragaglia D, Roberts J (2005) Navigated osteotomies around the knee in 170 patients with osteoarthritis secondary to genu varum. Orthopedics 28:s1269–s1274
26. Schallberger A, Jacobi M, Wahl P, Maestretti G, Jakob RP (2011) High tibial valgus osteotomy in unicompartmental medial osteoarthritis of the knee: a retrospective follow-up study over 13–21 years. Knee Surg Sports Traumatol Arthrosc 19:122–127 27. Schröter S, Ihle C, Elson DW, Döbele S, Stöckle U, Ateschrang A
(2016) Surgical accuracy in high tibial osteotomy: coronal equiva-lence of computer navigation and gap measurement. Knee Surg Sports Traumatol Arthrosc 24:3410–3417
28. Shi J, Lv W, Wang Y, Ma B, Cui W, Liu Z, Han K (2018) Three dimensional patient-specific printed cutting guides for closing-wedge distal femoral osteotomy. Int Orthop. https ://doi. org/10.1007/s0026 4-018-4043-3
29. Sodhi N, Khlopas A, Piuzzi NS, Sultan AA, Marchand RC, Mal-kani AL, Mont MA (2018) The learning curve associated with robotic total knee arthroplasty. J Knee Surg 31:17–21
30. Victor J, Premanathan A (2013) Virtual 3D planning and patient specific surgical guides for osteotomies around the knee: a feasi-bility and proof-of-concept study. Bone Joint J 95-B:153–158 31. W-Dahl A, Toksvig-Larsen S, Lindstrand A (2017) Ten-year
results of physical activity after high tibial osteotomy in patients with knee osteoarthritis. Knee Surg Sports Traumatol Arthrosc 25:902–909
Affiliations
Christophe Jacquet1,2 · Akash Sharma1,2 · Maxime Fabre1,2 · Matthieu Ehlinger3 · Jean‑Noël Argenson1 ·
Sebastien Parratte1,2,4 · Matthieu Ollivier1,2
1 Department of Orthopedics and Traumatology, Institute of Movement and Locomotion, St Marguerite Hospital, 270 Boulevard Sainte Marguerite, BP 29 13274 Marseille, France
2 Department of Orthopedics and Traumatology, Institute for Locomotion, APHM, CNRS, ISM, Sainte-Marguerite Hospital, Aix Marseille University, Marseille, France
3 Service de Chirurgie Orthopédique et de Traumatologie, CHU Hautepierre, Hôpital de Hautepierre, Hôpitaux Universitaires de Strasbourg, 1 Avenue Molière, 67098 Strasbourg Cedex, France