Publisher’s version / Version de l'éditeur:
Vous avez des questions? Nous pouvons vous aider. Pour communiquer directement avec un auteur, consultez la première page de la revue dans laquelle son article a été publié afin de trouver ses coordonnées. Si vous n’arrivez pas à les repérer, communiquez avec nous à PublicationsArchive-ArchivesPublications@nrc-cnrc.gc.ca.
Questions? Contact the NRC Publications Archive team at
PublicationsArchive-ArchivesPublications@nrc-cnrc.gc.ca. If you wish to email the authors directly, please see the first page of the publication for their contact information.
https://publications-cnrc.canada.ca/fra/droits
L’accès à ce site Web et l’utilisation de son contenu sont assujettis aux conditions présentées dans le site
LISEZ CES CONDITIONS ATTENTIVEMENT AVANT D’UTILISER CE SITE WEB.
ASHRAE Transactions, 88, 1, pp. 667-676, 1982
READ THESE TERMS AND CONDITIONS CAREFULLY BEFORE USING THIS WEBSITE. https://nrc-publications.canada.ca/eng/copyright
NRC Publications Archive Record / Notice des Archives des publications du CNRC :
https://nrc-publications.canada.ca/eng/view/object/?id=2e0b3632-44a6-49c4-9f31-bd4d6c684c1c
https://publications-cnrc.canada.ca/fra/voir/objet/?id=2e0b3632-44a6-49c4-9f31-bd4d6c684c1c
NRC Publications Archive
Archives des publications du CNRC
This publication could be one of several versions: author’s original, accepted manuscript or the publisher’s version. / La version de cette publication peut être l’une des suivantes : la version prépublication de l’auteur, la version acceptée du manuscrit ou la version de l’éditeur.
Access and use of this website and the material on it are subject to the Terms and Conditions set forth at
In situ measurements of frame wall thermal resistance
N21d
I
no.
1075
(*
National Research
Conseil national
C. 2
Council Canada
de recherches Canada
BLDO
I
I N SlTU MEASUREMENTS OF FRAME WALL THERMAL RESISTANCE
by W.C. Brown and G.D. Schuyler
Reprinted from
ASH RAE Transactions
Vol. 88, Part 1,1982
p. 667
-
676
DBR Paper No. 1075
Division of Building Research
Price:. $1 .OO
OTTAWA
I
N R C-
C I S T IB L M .
RES.
J
Rwh.
BW&
C N R C-
1 a 1 1 7 'On a u t i l i s e d e s a p p a r e i l s de mesure de l a t r a n s m i s s i o n de c h a l e u r e t d e s c a l o r i d t r e s pour rechercher l e s f a c t e u r s q u i i n f l u e n t s u r l e s mesures de l a r e s i s t a n c e thermique e n p l a c e d e s murs 3 o s s a t u r e de b o i s . Ces f a c t e u r s s o n t :
l ' o r i e n t a t i o n d e s mrs, l a d u r h d e s meeures, l e dephasage thermique, l e s e f f e t s de l a temperature moyenne e t l ' h e u r e d e s mesures. On a 6galement u t i l i s e c e s r s u r e s pour determiner l a r e s i s t a n c e thermique e n p l a c e de l ' i s o l a n t e t l ' e f f e t d e s O l h e n t s de l ' o s s a t u r e s u r la r e s i s t a n c e thermique g l o b a l e du mr.
Une bonne connaissance d e s e f f e t s dynamtques s u r un mr d ' e s s a i e s t i n d i s p e n s a b l e pour o b t e n i r d e s r e s u l t a t s p r e c i s . On a obtenu d e s mesures de r e s i s t a n c e thermique p r e c i s e s pour d e s mrs B o s s a t u r e en b o i s a p a r t i r des v a l e u r s des d i f f g r e n c e s de temperature e t de l a transmission de c h a l e u r s u r une pgriode continue de 24 heures (des c o r r e c t i o n s a p p r o p r i h s o n t S t € e f f e c t u h s pour t e n i r c o m t e du dephasage d e l a transmission de c h a l e u r e t pour l ' e f f e t de l a temperature moyenne). Toutes l e s a u t r e s d t h o d e s de mesure o n t conduit a d e s r e s u l t a t s moins p r e c i s (-is acceptables) ou t o u t a f a i t inacceptables.
In Situ Measurements
of Frame Wall
Thermal Resistance
W.C. Brown
G.D.
Schuyler
INTRODUCTION
In p r e d i c t i n g t h e thermal performance of a w a l l , one of t h e most important c h a r a c t e r i s t i c s t o be determined i s t h e s t e a d y - s t a t e thermal r e s i s t a n c e o f t h e w a l l . For t h i s r e a s o n , measurement of thermal r e s i s t a n c e was chosen a s t h e s t a r t i n g p o i n t f o r a f i e l d i n v e s t i g a t i o n of w a l l
thermal performance. The i n v e s t i g a t i o n was designed:
1. t o determine t h e e f f e c t s of v a r i o u s f a c t o r s on t h e accuracy of t h e measurement o f wall thermal r e s i s t a n c e ,
2. t o compare measured r e s i s t a n c e w i t h t h a t p r e d i c t e d from t h e thermal p r o p e r t i e s o f t h e wall components,
3 . t o determine t h e e f f e c t s of framing members on o v e r a l l wall thermal r e s i s t a n c e .
F a c t o r s s t u d i e d t o meet t h e f i r s t o b j e c t i v e included wall o r i e n t a t i o n , l e n g t h of measurement p e r i o d , thermal l a g , mean temperature, and time of measurement.
Heat Flow Meters (HFM, s e e Appendix A ) were i n s t a l l e d i n t h e w a l l s of a house t o measure h e a t flow, Q, through i n s u l a t i o n , and thermocouples were placed on t h e i n s i d e and o u t s i d e s u r f a c e s t o measure temperature d i f f e r e n c e , AT, a c r o s s i n s u l a t i o n . The r e s u l t s were used t o determine t h e r e s i s t a n c e of t h e i n s u l a t i o n and t h e e f f e c t s of v a r i o u s f a c t o r s on t h e accuracy of t h e measurement of r e s i s t a n c e . A c a l o r i m e t e r ( s e e Appendix B) and an IiFM were i i l s t a l l e d t o g e t h e r i n a second house t o measure h e a t flow Q i n a s i m i l a r wall s e c t i o n . ' These r e s u l t s were used t o determine t h e e f f e c t s of framing members on o v e r a l l h e a t flow and thermal r e s i s t a n c e through t h e w a l l .
The i n v e s t i g a t i o n was c a r r i e d out i n two of f o u r t e s t houses used by t h e D i v i s i o n of Building Research, National Research Council o f Canada (DBR/NRCC),in c o o p e r a t i o n with t h e Housing and Urban Development A s s o c i a t i o n of Canada f o r s t u d i e s of energy u s e i n s i n g l e - f a m i l y d w e l l i n g s . 2 B u i l t i n 1977, t h e houses a r e l o c a t e d i n t h e Ottawa a r e a (4674 O C d a y s ) . T'ne w a l l s
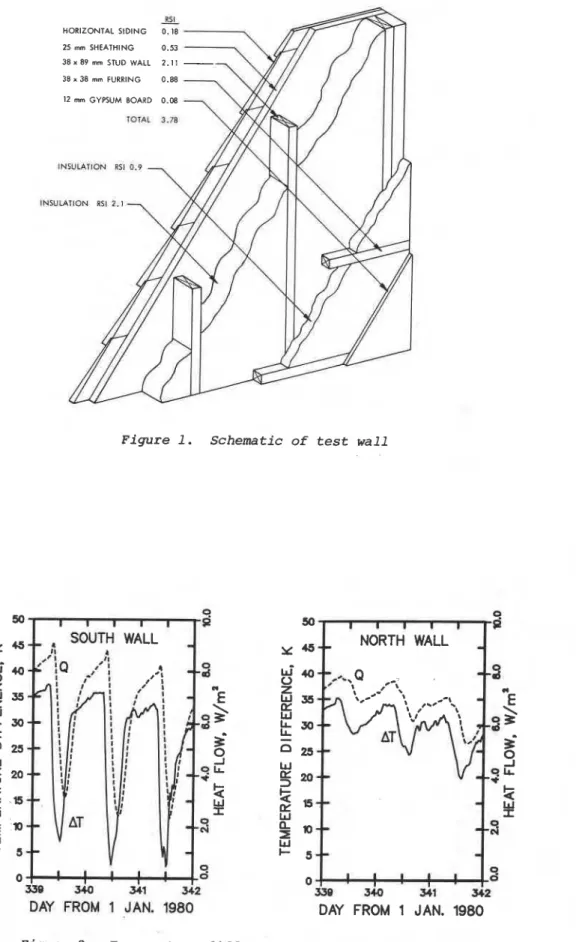
a r e wood frame 38 x 89 mm s t u d w a l l s a t 406 mm on c e n t e r (O.C.) (nominal 2 x 4 i n . , 16 i n . O.C.) and t h e s t u d space i s f i l l e d with mineral wool i n s u l a t i o n (RSI 2.1 [R 1 2 ] ) . * The o u t s i d e of t h e s t u d wall i s f i n i s h e d with 25 mm (1 i n . ) f i b e r b o a r d s h e a t h i n g , RSI 0.5 (R 3 ) , and
h o r i z o n t a l aluminum s i d i n g . The i n s i d e of t h e s t u d wall i s f i n i s h e d with 38 x 38 mm (nominal 2 x 2 i n . ) h o r i z o n t a l f u r r i n g and 12 mm ( 0 . 5 i n . ) gypsum board. The f u r r i n g i s a t 406 mrn
(16 i n . ) O . C . and i s f i l l e d with RSI 0 . 9 (R 5) mineral wool i n s u l a t i o n . The HFM's were b u i l t
2 2
*
Thermal r e s i s t a n c e , SI u n i t s , m K/:*:, and conventional u n i t s f t h°F/BtuW.C. Brown, Research O f f i c e r , D i v i s i o n of Building Research, National Research Council of Canada, Ottawa, Ontario,
G . D . Schuyler, P r o j e c t Engineer, Morrison, H e r s h f i e l d , Theakston and Rowan L t d . ,
Guelph, Ontario, Canada
around t h i s i n s u l a t i o n . A schematic drawing o f t h e w a l l i s shown i n F i g . 1. The thermal r e s i s t a n c e of t h e components through t h e i n s u l a t i o n i s RSI 3.78 a t 24OC (R 21.5 a t 75 F) mean t e m p e r a t u r e . Assuming p a r a l l e l h e a t flow and i g n o r i n g t h e e f f e c t s of f a s t e n e r s , t h e o v e r a l l thermal r e s i s t a n c e o f t h e w a l l i s c a l c u l a t e d t o be RSI 3.53 a t 24°C (R 20.0 a t 75 F ) mean t e m p e r a t u r e .
HEAT FLOW METER RESULTS
Thermal Lag and I n t e g r a t i n g P e r i o d
The s t e a d y - s t a t e thermal r e s i s t a n c e of a w a l l can be determined by i n t e g r a t i n g h e a t flow, Q, and s u r f a c e t e m p e r a t u r e d i f f e r e n c e , AT, measurements w i t h r e s p e c t t o time u n t i l t h e r a t i o of t h e i n t e g r a l s becomes c o n s t a n t . The v a l u e of t h e c o n s t a n t r a t i o i s t h e s t e a d y - s t a t e thermal r e s i s t a n c e . I f Q and AT were s i n u s o i d a l , t h e r a t i o of t h e i n t e g r a l s o f Q and AT o v e r one p e r i o d would g i v e t h e s t e a d y - s t a t e r e s i s t a n c e . In t h e f i e l d , however, AT i s n o t s i n u s o i d a l , and i s n o t , i n f a c t , s t a t i o n a r y ; The p e r i o d of i n t e g r a t i o n r e q u i r e d t o g i v e a c o n s t a n t r a t i o
i s t h e r e f o r e unknown. In a d d i t i o n , t h e s i g n a l i s n o t t r u l y p e r i o d i c and t h e wall i n t r o d u c e s a l a g between Q and AT, s o t h a t t h e i n t e g r a t i o n p e r i o d f o r Q should be lagged behind t h a t f o r AT by t h e d e l a y o f t h e w a l l i n o r d e r t o o b t a i n a c c u r a t e r e s u l t s .
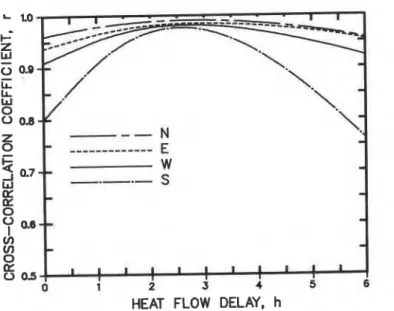
The t e m p e r a t u r e d i f f e r e n c e a c r o s s a w a l l and t h e h e a t flow through a w a l l change p r i m a r i l y because of changes i n e x t e r i o r s u r f a c e t e m p e r a t u r e ; t h e s e changes a r e caused by t h e d a i l y c y c l e of t h e ambient a i r t e m p e r a t u r e and s o l a r r a d i a t i o n . Although t h e d i u r n a l t e m p e r a t u r e c y c l e h a s an equal e f f e c t on a l l wall o r i e n t a t i o n s , s o l a r r a d i a t i o n a f f e c t s t h e s o u t h w a l l t o t h e
g r e a t e s t e x t e n t and, t o a l e s s e r e x t e n t , t h e e a s t and west w a l l s . A s a consequence, t h e s o u t h w a l l e x p e r i e n c e s t h e most r a p i d changes i n e x t e r i o r s u r f a c e t e m p e r a t u r e , w i t h a corresponding i n c r e a s e i n t h e magnitude of t h e h i g h e r frequency components o f t h e s u r f a c e t e m p e r a t u r e . I n a d d i t i o n , t h e e f f e c t s v a r y from day t o day because of cloud cover v a r i a t i o n s . The s o u t h w a l l , t h e r e f o r e , e x p e r i e n c e s g r e a t e r v a r i a t i o n i n AT and Q t h a n t h e n o r t h w a l l and t h e a p p a r e n t v a l u e of thermal r e s i s t a n c e i s c o r r e s p o n d i n g l y a f f e c t e d .
A sample o f AT and Q d a t a c o l l e c t e d from t h e w a l l s under t e s t (Fig. 2) shows t h a t t h e r e i s
one dominant d e l a y p e r i o d between t h e two s e t s of d a t a . T h i s can be determined by f i n d i n g t h e d e l a y t h a t produces t h e maximum c r o s s - c o r r e l a t i o n between t e m p e r a t u r e d i f f e r e n c e and h e a t flow
(Fig. 3 ) . The d e l a y w i t h t h e maximum c r o s s - c o r r e l a t i o n i s 2.5 h. T h i s a g r e e s w e l l w i t h t h e d e l a y t h a t i s e v i d e n t from a v i s u a l i n s p e c t i o n of Fig. 2. S i g n i f i c a n t l y reduced s c a t t e r should be expected i n t h e c a l c u l a t e d thermal r e s i s t a n c e v a l u e s i f t h e Q d a t a a r e lagged by 2.5 h behind t h e AT d a t a .
Fig. 4 shows how t h e i n t e g r a t e d thermal r e s i s t a n c e , c a l c u l a t e d w i t h 2.5 h l a g i n Q, approaches a c o n s t a n t v a l u e a s t h e i n t e g r a t i o n p e r i o d l e n g t h e n s . In f a c t , f o r t h e s i x p e r i o d s shown, both n o r t h and s o u t h o r i e n t a t i o n s s e t t l e d t o w i t h i n '5% of t h e seven-day v a l u e a f t e r 24 h. In a d d i t i o n , it shows t h a t a d e l a y i n Q r e d u c e s t h e magnitude of t h e v a r i a t i o n s i n c a l c u l a t e d r e s i s t a n c e . I n t e g r a t i o n p e r i o d s s h o r t e r t h a n 2 4 h may a l s o produce a c c e p t a b l e r e s u l t s (55%) and w i l l be d i s c u s s e d l a t e r .
Mean Temperature E f f e c t s
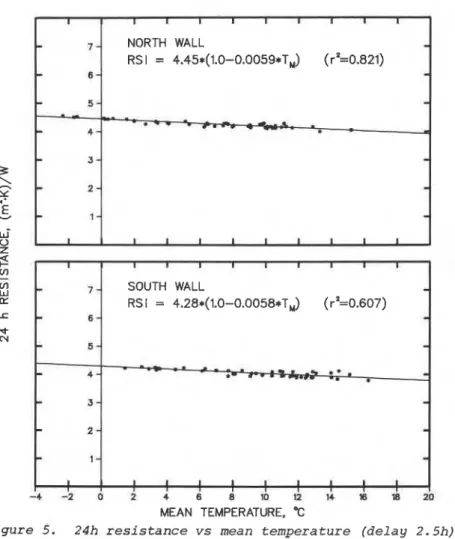
A s t h e thermal r e s i s t a n c e of i n s u l a t i n g m a t e r i a l s changes w i t h mean t e m p e r a t u r e , one should expect t o s e e v a r i a t i o n s i n t h e thermal r e s i s t a n c e caused by changes i n ambient temperature. The 24 h thermal r e s i s t a n c e s a r e p l o t t e d a s a f u n c t i o n of mean t e m p e r a t u r e
(Fig. 5 ) . These i n d i c a t e a l i n e a r r e l a t i o n between thermal r e s i s t a n c e and mean t e m p e r a t u r e .
A comparison of t h e mean t e m p e r a t u r e c o r r e c t e d and u n c o r r e c t e d r e s i s t a n c e s (Fig. 6) shows t h a t an a p p a r e n t s e a s o n a l v a r i a t i o n and s c a t t e r have been reduced by c o r r e c t i n g f o r mean
temperature.
One p o i n t t o n o t i c e i s t h e d i f f e r e n c e between t h e 0°C thermal r e s i s t a n c e s f o r n o r t h and s o u t h w a l l s (Fig. 5 ) . The n o r t h w a l l shows RSI 4.45 a t O'C (R 25.3 F a t 32 F) w h i l e t h e s o u t h w a l l shows RSI 4.28 (R 24.3), a 4% d i f f e r e n c e . I t i n c l u d e s t h e v a r i a b i l i t y of t h e i n s u l a t i o n a s manufactured, m o d i f i c a t i o n o f performance by exposure, and measurement e r r o r . The
normalized mean t e m p e r a t u r e c o e f f i c i e n t s f o r t h e n o r t h , 0.0059, and s o u t h , 0.0058, w a l l s a r e q u i t e c l o s e , i n d i c a t i n g t h a t t h e w a l l s have t h e same mean t e m p e r a t u r e dependence but s l i g h t l y d i f f e r e n t r e s i s t a n c e s .
Time o f Dav
f o r t h e s t a r t time of t h e i n t e g r a t i o n . Comparisons o f 24 h i n t e g r a t i o n s s t a r t i n g a t d i f f e r e n t t i m e s of t h e day showed t h a t s t a r t time had l i t t l e e f f e c t . I f one chooses t h e s t a r t t i m e c o r r e c t l y , however, a much s h o r t e r i n t e g r a t i o n p e r i o d may g i v e s a t i s f a c t o r y r e s u l t s (Fig. 4 ) ; w i t h a s t a r t time of midnight, an i n t e g r a t i o n p e r i o d of a few h o u r s i s adequate.
To i n v e s t i g a t e t h e s t a r t time of i n t e g r a t i o n , an i n t e g r a t i o n p e r i o d of 4 h was a p p l i e d t o t h e d a t a . Comparison of t h e means and o f t h e s t a n d a r d d e v i a t i o n s f o r 4 h r e s i s t a n c e c a l c u l a t e d from v a r i o u s s t a r t t i m e s (Tab. 1 ) shows t h a t unlagged d a t a g i v e g e n e r a l l y u n p r e d i c t a b l e r e s u l t s f o r both n o r t h and s o u t h o r i e n t a t i o n s and a l l s t a r t t i m e s . Lagged d a t a g i v e s a t i s f a c t o r y r e s u l t s f o r both o r i e n t a t i o n s i f i n t e g r a t i o n s t a r t s n e a r midnight, but t h e r e s u l t s become p r o g r e s s i v e l y worse, e s p e c i a l l y f o r t h e s o u t h w a l l , i f t h e s t a r t t i m e i s such t h a t t h e i n t e g r a t i o n p e r i o d approaches d a y l i g h t hours. I f d a y l i g h t hours a r e i n c l u d e d i n t h e i n t e g r a t i o n p e r i o d , t h e r e s u l t s a r e u n a c c e p t a b l e .
COMPARISON OF
0
FROM HFM AND CALORIMETERIn comparing t h e measurements o f Q made by t h e HFM w i t h t h o s e made by t h e c a l o r i m e t e r , t h e most obvious d i f f e r e n c e i s t h e q u a n t i t y being measured. The HFM measurement does n o t i n c l u d e h e a t flow through any framing members, while t h e c a l o r i m e t e r measurement i n c l u d e s h e a t flow through a l l but t h e t o p and bottom p l a t e s . A s t h e c a l o r i m e t e r measures h e a t flow a t t h e i n s i d e s u r f a c e of t h e gyproc and i n c l u d e s t h e l a g s of t h e framing members, i t should i n d i c a t e a l o n g e r l a g between Q and AT t h a n does t h e HFM, which measures h e a t flow a t a p l a n e w i t h i n t h e w a l l and does n o t i n c l u d e framing members. The c r o s s c o r r e l a t i o n of t h e measured h e a t flows (Fig. 7)
shows t h a t t h e c a l o r i m e t e r h e a t flow l a g s t h e HFM h e a t flow by approximately 0.5 h.
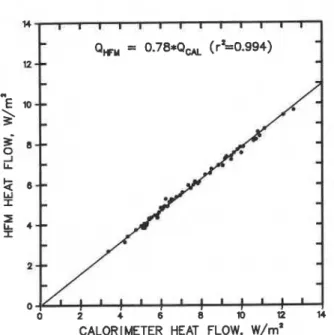
Fig. 8 shows t h a t t h e r a t i o of t h e whole w a l l h e a t flow, a s measured by t h e c a l o r i m e t e r , and h e a t flow through t h e p o r t i o n between t h e framing members, a s measured by t h e HEM, i s 0.78. That i s , t h e framing members and f a s t e n e r s reduce t h e o v e r a l l w a l l r e s i s t a n c e t o 0.78 of t h e i n s u l a t i o n r e s i s t a n c e . T h i s r a t i o i s lower t h a n t h e 0.93 r a t i o c a l c u l a t e d assuming p a r a l l e l h e a t flows and u s i n g e s t i m a t e s of t h e thermal r e s i s t a n c e of t h e components.3
Combining t h i s f a c t o r of 0.78 with t h e measured r e s i s t a n c e through t h e i n s u l a t e d p o r t i o n of t h e w a l l (Fig. 6 ) g i v e s an o v e r a l l wall r e s i s t a n c e of RSI 3.40 a t O°C (R 19.3 a t 32 F) mean t e m p e r a t u r e . T h i s compares w e l l with t h e measured r e s i s t a n c e of a s i m i l a r w a l l specimen
(2.4 x 2.4 m [8 x 8 f t ] ) t e s t e d i n t h e DBR/NRCC guarded h o t box f a c i l i t y . The r e s u l t from t h a t t e s t was RSI 3.61 a t - 7 O c (R 20.5 a t 19.4 F) mean t e m p e r a t u r e and 55 K (99 F ) t e m p e r a t u r e d i f f e r e n c e . The e s t i m a t e of t h e r e s i s t a n c e through t h e i n s u l a t i o n (RSI 3.78 a t 24OC mean t e m p e r a t u r e ) compares w e l l w i t h t h e measured r e s u l t from t h e HFM a t t h e same mean t e m p e r a t u r e
(RSI 3.68 s o u t h o r RSI 3.83 n o r t h ) .
A s t h e measured r e s i s t a n c e through t h e i n s u l a t i o n compares well w i t h t h a t p r e d i c t e d from t h e s e p a r a t e r e s i s t a n c e s of t h e components and t h e o v e r a l l r e s i s t a n c e v a l u e compares w e l l w i t h a l a b o r a t o r y measured v a l u e , t h e measured r a t i o of r e s i s t a n c e s ( h e a t f l o w s ) a p p e a r s t o be v a l i d . The d i f f e r e n c e between t h e measured (0.78) and p r e d i c t e d (0.93) r a t i o s i s probably due t o t h e f a s t e n e r s used t o hold t h e w a l l t o g e t h e r and t o n o n - p a r a l l e l h e a t flows i n t h e w a l l .
ERROR
Although 24 h d a t a with time l a g and mean t e m p e r a t u r e c o r r e c t i o n can produce good r e s u l t s ( + 5 % ) , t h e most a c c u r a t e way t o determine t h e r e q u i r e d c o r r e c t i o n s i s from d a t a c o l l e c t e d over an extended p e r i o d of time. A q u i c k e r and s t i l l a c c e p t a b l e way t o o b t a i n t h e a p p r o p r i a t e time l a g i s by v i s u a l i n s p e c t i o n of t h e AT and Q c u r v e s . In t h e example s t u d i e d , t h e time l a g from v i s u a l i n s p e c t i o n agreed w e l l w i t h t h a t o b t a i n e d from c r o s s c o r r e l a t i o n a n a l y s i s . There i s no q u i c k way t o o b t a i n t h e mean t e m p e r a t u r e c o r r e c t i o n . I t would be a p p r o p r i a t e , however, t o r e c o r d t h e mean t e m p e r a t u r e a t which each measurement was made.
I t may be advantageous i n some c a s e s t o i g n o r e one o r both o f t h e c o r r e c t i o n s and t o a c c e p t a l a r g e r s c a t t e r i n t h e r e s u l t s . Tab. 2 shows t h e mean, normalized by t h e 0°C mean t e m p e r a t u r e v a l u e of F i g . 5; t h e s t a n d a r d d e v i a t i o n ; and t h e 99% confidence i n t e r v a l f o r s e v e r a l c a s e s ranging from both c o r r e c t i o n s t o no corrections."he r e s u l t s f o r t h e s o u t h w a l l , which has l a r g e r v a r i a t i o n s i n Q and AT because of s o l a r r a d i a t i o n , a r e a s good a s t h o s e from t h e n o r t h w a l l . A s would be expected, l a r g e r e r r o r s e x i s t i f c o r r e c t i o n s a r e n o t made, but r e s u l t s can be expected w i t h i n 210% o f t h e c o r r e c t v a l u e , even i f no allowance i s made f o r time l a g and mean t e m p e r a t u r e e f f e c t s .
While a c c e p t a b l e r e s u l t s have been o b t a i n e d f o r t h e frame w a l l used i n t h i s s t u d y , o t h e r t y p e s of w a l l s may produce l e s s a c c u r a t e r e s u l t s . For example, b r i c k veneer w a l l s with a
vented a i r space would be l e s s amenable t o t h i s approach; e x t e r i o r t e m p e r a t u r e would have t o be measured a t t h e i n s i d e s u r f a c e o f t h e a i r space. S o l i d c o n c r e t e w a l l s , with l o n g e r dynamic e f f e c t s , might r e q u i r e longer i n t e g r a t i o n p e r i o d s t h a n t h o s e used f o r t h i s s t u d y . The r e s u l t s from such w a l l s should be a s s e s s e d v e r y c a r e f u l l y b e f o r e t h e y a r e a c c e p t e d .
CONCLUSIONS
Reasonably a c c u r a t e (210%) v a l u e s o f i n s i t u frame w a l l thermal r e s i s t a n c e can be o b t a i n e d from h e a t flow and t e m p e r a t u r e d i f f e r e n c e d a t a i n t e g r a t e d over a 24 h p e r i o d . Values a c c u r a t e t o
55% can be o b t a i n e d i f c o r r e c t i o n s a r e made f o r b o t h w a l l t i m e l a g and mean t e m p e r a t u r e dependence. These c o r r e c t i o n s can be determined from a n a l y s i s of s e v e r a l d a y s ' d a t a ; o r a r e a s o n a b l e c o r r e c t i o n f o r time l a g a l o n e can be determined from v i s u a l i n s p e c t i o n of 24 h h e a t flow and t e m p e r a t u r e d i f f e r e n c e c u r v e s . T r a d e o f f s between a c c u r a c y and t h e number of
c o r r e c t i o n s a p p l i e d a r e summarized i n Tab. 2.
There i s v i r t u a l l y no d i f f e r e n c e i n measurement accuracy f o r a n o r t h f a c i n g o r shaded w a l l and a s o u t h f a c i n g o r sunny w a l l f o r 24 h i n t e g r a t e d d a t a . S i m i l a r l y , t h e r e i s l i t t l e
d i f f e r e n c e i n accuracy between 24 h i n t e g r a t e d d a t a , c o r r e c t e d f o r l a g and mean t e m p e r a t u r e , and c o r r e c t e d 4 h i n t e g r a t e d d a t a a s long a s t h e 4 h i n t e g r a t i o n p e r i o d o c c u r s around midnight. The accuracy of 4 h d a t a becomes p r o g r e s s i v e l y worse a s t h e i n t e g r a t i o n p e r i o d approaches d a y l i g h t hours and becomes u n a c c e p t a b l e i f d a y l i g h t hours a r e i n c l u d e d .
Thermal r e s i s t a n c e measured through i n s u l a t i o n i n s t a l l e d i n t h e f i e l d a g r e e s v e r y well w i t h v a l u e s p r e d i c t e d from r e s i s t a n c e s of i n d i v i d u a l components. The r a t i o of r e s i s t a n c e f o r t h e w a l l t o t h a t of t h e i n s u l a t i o n between t h e framing members (0.78) i s l e s s t h a n t h a t p r e d i c t e d by a simple p a r a l l e l h e a t flow c a l c u l a t i o n ( 0 . 9 3 ) . T h i s may be p a r t i a l l y e x p l a i n e d by a r e d u c t i o n i n t h e thermal r e s i s t a n c e o f t h e wall components due t o n a i l s , e s p e c i a l l y t h e r e d u c t i o n i n t h e r e s i s t a n c e of t h e i n s u l a t i n g s h e a t h i n g board by t h e l a r g e number of aluminum n a i l s used t o f a s t e n t h e s i d i n g .
REFERENCES
1. Brown, W.C. and S c h u y l e r , G.D., "A C a l o r i m e t e r f o r Measuring Heat Flow Through Walls," Proceedings o f t h e ASHRAE/DOE Conference on Thermal Performance of t h e E x t e r i o r Envelopes of B u i l d i n g s , Kissimmee, FL, December 1979.
2. Q u i r o u e t t e , R . L . , "The Mark X I Energy Research P r o j e c t - Design and C o n s t r u c t i o n , " N a t i o n a l Research Council of Canada, D i v i s i o n of Building Research, Building Research Note 131, October 1978.
3. ASHRAE Handbook
-
1977 Fundamentals Volume, American S o c i e t y of Heating, R e f r i g e r a t i n g and A i r - c o n d i t i o n i n g E n g i n e e r s , New York, NY.4. Hays, W.L., S t a t i s t i c s , H o l t , R i n e h a r t and Winston, I n c . , 1963. ACKNOWLEDGMENTS
The a u t h o r s wish t o acknowledge t h e t e c h n i c a l a s s i s t a n c e of J.A. Richardson and D . L . Logan, of t h e D i v i s i o n of Building Research, i n conducting t h e s t u d y .
T h i s paper i s a c o n t r i b u t i o n from t h e D i v i s i o n o f Building Research, N a t i o n a l Research Council of Canada, and i s p u b l i s h e d w i t h t h e approval of t h e D i r e c t o r of t h e D i v i s i o n .
TABLE
1
4 Hour Resistances for Various Integration Start Times
South North
Start
h
Without Lag in Q
With Lag in Q
NOTE: All RSI values adjusted for Tm as per Fig. 5
KSI, mean 2 4 h resistance as per Fig. 5
u standard deviation
TABLE 2
Comparison of Measurement Precision for Various HFM Measurements
Computation Plan South North
NOTE: All integration periods start at midnight
P integration period
d 2.5 h delay in Q (Y
-
Q delayed, N-
Q not delayed)Tm mean temperature correction (Y
-
corrected, N-
not corrected)RS I mean resistance
RS I,, mean 2 4 h resistance with corrections for d and Tm
RSIms = 4.28 m2.~/w, RSImn = 4.45 m2.~/w
a standard deviation
99% CI 99% confidence interval
-
99 readings out of a 100 should fallAPPENDIX A
HEAT FLOW
METERThe meters used in the investigation were constructed from the same materials as make up the section of the wall they replace. Figure A-1 shows their construction and placement within the wall. The meters were made with a 12-junction thermopile across the insulation layer as well as a separate thermocouple on each surface for temperature measurement.
Measurements taken at each HFM location were:
Tao outside air temperature (150 mm from the surface) T a . inside air temperature (150 mm from the surface)
1
Tso outside surface temperature Tsi inside surface temperature
T. temperature of outer surface of
HFM
1
E thermopile output
The output from each meter was calibrated at one mean temperature, using an ASTM C518 HFM apparatus, at DBR/NRCC. In addition, the dependence of the output upon mean temperature was measured for one HFM and applied to all others.
APPENDIX B CALORIMETER
The calorimeter used in the investigation was constructed of two layers of foil-backed rigid glass fibre insu1ation.l The total wall thickness was 10 cm, with a thermal resistance of RSI 2.8 (R 16). It was 1.2 m wide by 2.1 m high (4 x 7 ft) and contained a 150
W
heating cable. The heater was controlled to maintain zero temperature difference across the calorimeter walls, and temperature difference was sensed by an 18-junction thermopile. The calorimeter was mounted on the inside surface of the wall for which heat flow was to be measured. Measurementsincluded :
To outside air temperature T. room air temperature
1
E energy supplied to the calorimeter
Figure 1. Schematic of test wall 50 I V l l t NORTH WALL
8
Y 45---
W I- 5 - - 0 l i l l l3
339 345 341 342 35P 540 1 ' 341 1 . 342DAY FROM 1 JAN. 1980 DAY FROM 1 JAN. 1980
W
0
0.0-
G
LLL
/
\
W 0 0 0.8- Z-
-
N 0-
---
E-
-
3
0.7-L
W We
0: 07
0.6-- V) V) 0e
- s
-
-
-
0 0 5 1 1 1 1 1 a 0 1 2 3 4 5 6HEAT FLOW DELAY, h
Figure 3. Cross-correlation coefficients for differect orientations
...--...--.
" NO DELAY INQ
DAY FROM 1 JAN. 1980
Figure 4. Cumulative HFM resistance
I I I I I 1 1 1 I I
,-
NORTH WALL-
RS I = 4.45*(1.0-0.0059*TM) (r2=0.821) 6-
-
5-
d-
4-
-
J-
-
-
2-
-
I-
1-
-
I I I I I I I I I I w- 0 zs
I I 1 I I 1 I I I 1'"
V) W 7 - SOUTH WALL-
K RS I = 4.28*(1.0-0.0058*TM) (r2=0.607) C 6-
-
*
N-
5-
-
-
4-
I =-
-
3-
-
-
2-
-
C 1-
-
-
-4 -2 0 2 4 6 B 10 12 14 1B 20 MEAN TEMPERATURE. "CFigure 5. 24h resistance vs mean temperature (delay 2.5h)
NORTH WALL AVERAGE RSI 4.45
W 0
0 0 9 - - 0
z *
8
o NOT ADJUSTED FOR T,2
-
-
V) ADJUSTED FOR T,k.2
0.a I I 1 I I I I I I I L SOUTH WALL AVERAGE RSI 4.28 - 0.
..
a..
-.
.
.
.
0-...:..:-.-.
.
.o .* O. 0 e 00 000 0 Onm-
0 0 0 0 oO 0 0 0 0-
-
0 NOT ADJUSTED FOR T,
-
ADJUSTED FOR T, DAY FROM 1 JAN. 1980
CALORIMETER HEAT FLOW DELAY, h
Figure 7. Cross-correlation coefficient for
calorimeter and HFM heat flow
12 mm GYPSUM BOARD RSI 0.9 INSULATION 3 mm PLYWOOD
CALOR I METER HEAT FLOW, w/m2
Figure 8. 24h HFM heat flow vs calorimeter heat flow (delay 0.5h)
+ THERMOPILE JUNCTION X THERMOCOUPLE STUDS FURRING
JY[{
1
L- 4M rnm [ FURRINGThis publication is being distributed by the Division of
Building R e s e a r c h of the National Research Council of Canada. I t should not be reproduced in whole o r in p a r t without permission of the original publisher. The Di- vision would be glad to be of a s s i s t a n c e in obtaining such permission.
Publications of the Division may be obtained by mail- ing the appropriate remittance (a Bank, Express, o r P o s t Office Money Order, o r a cheque, made payable to the Receiver General of Canada, c r e d i t NRC) to the National Research Council of Canada, Ottawa. KIA OR6. Stamps a r e not acceptable.
A lie t of a l l publications of the Division is available and may be obtained f r o m the Publications Section, Division of Building Research, National R e s e a r c h Council of Canada. Ottawa. KIA OR 6.