Publisher’s version / Version de l'éditeur: Building Practice Note, 1982-01-01
READ THESE TERMS AND CONDITIONS CAREFULLY BEFORE USING THIS WEBSITE.
https://nrc-publications.canada.ca/eng/copyright
Vous avez des questions? Nous pouvons vous aider. Pour communiquer directement avec un auteur, consultez la
première page de la revue dans laquelle son article a été publié afin de trouver ses coordonnées. Si vous n’arrivez pas à les repérer, communiquez avec nous à [email protected].
Questions? Contact the NRC Publications Archive team at
[email protected]. If you wish to email the authors directly, please see the first page of the publication for their contact information.
NRC Publications Archive
Archives des publications du CNRC
For the publisher’s version, please access the DOI link below./ Pour consulter la version de l’éditeur, utilisez le lien DOI ci-dessous.
https://doi.org/10.4224/20377906
Access and use of this website and the material on it are subject to the Terms and Conditions set forth at
Mark XI Energy Research Project: summary of results, 1978-1981
Scheuneman, E. C.
https://publications-cnrc.canada.ca/fra/droits
L’accès à ce site Web et l’utilisation de son contenu sont assujettis aux conditions présentées dans le site LISEZ CES CONDITIONS ATTENTIVEMENT AVANT D’UTILISER CE SITE WEB.
NRC Publications Record / Notice d'Archives des publications de CNRC: https://nrc-publications.canada.ca/eng/view/object/?id=ecb4035e-716a-4151-876e-1c75bad002a7 https://publications-cnrc.canada.ca/fra/voir/objet/?id=ecb4035e-716a-4151-876e-1c75bad002a7
BUILDING
PRACTICE
NOTE
MARK
XI
ENERGY RESEARCH PROJECTSUMMARY
OF
RESULTS, 1978-1981Division of Building, Research, National Research Council of Canada
Otzawa, January 1982
TABLZ OF CONTENTS
INTRODUCTION
DESCRIPTION OF THE MARK XI HOUSES
T£€F,EMAL PERFORMANCE
UP
STANDARDAMD
UPGRADED EIOUSESTHERPiAL PERE'O=~CE QF THE UPGRADED WALL SYSTEM
BASEMENT STUDIES
AIR-LEAKAGE ST7JDIES
AIR-SOURCE HEAT PUMP SYSTEMS SQLAR HEATING SYSTEM
PLELD P E R F O W C E OF A NATURAL GAS FURNACE MECHANICAL VENTILATIOPJ WITH HEllT RECOVERY
HUMIDITY AND AIR CHANGE
MOISTURE STUDIES
WITID AWD PBeSSURE EFFECTS PROJECT PARTICIPANTS
REFERENCES
MARK XI ENERGY RESEARCH PROJECT SUMMARY OF RESULTS, 1978-1981
by
E
.
C.
S cheunemanINTRODUCTION
The Housing and Urban Development Assoc5atiun of Canada (HUDAC) and the D i v i s i o n of Building Research (DBR) have been cooperatltt~ on a project to study energy use in four single-family detached houses b u i l t
in Orleans, Ontario, 5 kilometres e a s t of Ottawa in 1977. These houses were designated the: W A C Hark XI Project.
The objectives of tlhe project include the following:
(1) to demonstrate the energy savkng r e s u l t i n g from upgrading the
thermal resistance and air-tightness of the building
envelope;
(2) to s t u d y the potential problems associated with thermal
upgrading;
<3) to. d e t e w n e the t h e m . 1 performance of space-heating systems (gas furnace, a i r s o u r c e heat punp
,
and salar) ;( 4 ) t o determine the heat l o s s through different sections of the
houses;
(5) to determine the accuracy of mathematical models in
predicting energy consumption in houses;
( 6 ) to determine the effect of occupancy an the energy usage in
houses.
DESCRIPTION OF THE MARK
XI
HOUSESThe four detached two-storey, single-family test houses are located on adjacent l o t s in a housing development near Ottawa ( F i g u r e I ) , Each has 118 m2 (1249 f t2) of living area and a full
basement w i t h cast-in-place concrete foundatjton. The interior dilnensions and interior finishes are identical i n a l l four houses
(Figure 2) ; the exterior finishes are nearly i d e n t i c a l . References ( I )
and (2) give f u l l d e t a i l s .
House 1 (81) was b u i l t according to t h e insulation requirements of the 1975 Ontario Building Code. Houses 2, 3 and 4
(a,
H3 and tI4) wereconstructed with increased levels of insulation, t r i p l e - g l a z e d windows and special features to Fncrease air-tightness. The nominal thermal characteristics of the main components of the houses are given in T a b l e 1 , and a more complete d e s c r i p t i o n is available in Reference (1); the R-values glven refer to the i n s u l a t i o n i n s t a l l e d i n t h e houses.
F O R T U N E D R I V E
Orleans, Ontario
F I G U R E
1
BASEMENT PLAN
*
- GROUND FLOOR PLAN rwr
SECOND FL0,DR PLAN
z c a u
F I G U R E 2
paper backing on glass-fibre batts
:
In a d d i t i o n , there are two nonstandard construction features in
s o w of these houses; namely, continuous-span floor j o i s t s with glued subfloors and e i g h t d i f f e r e n t panel materials used as roof sheathing.
Table 1
Thermal Properties of the Mark XI Houses*
H1
-
82, H 3 , H4 Ceiling R = 3.5 (20) R = 5.6 (32) Walls R = 2 . 1 ( 1 2 ) R = 3.5 (20) Basement walls R = 1.2 ( 7 ) R = 1 . 3 (7.5) i n s u l a t i o n to 0.9 m i n s u l a t i o n to fullbelow grade an height on exterior
interior of wall of wall
Windows s e a l e d , double- sealed, triple-
g l a z e d , wood-frame, glazed, wood-frame, sliding and casement and awning
double-hung
Exterior doors i n s u l a t e d steel i n s u l a t e d steel
doors doors with storm
doors
Air-vapour barrier 0
.lo
am ( 4 d l )polyethylene sheet
throughout
*R-values in t h i s table and paper are given in SI u n i t s with I m p e r i a l
u n i t s in brackets.
The Eastern Forest Products Laboratory of Forintek Canada Corp. has been monitoring these features. One energy-related conclusion obtained from
its floor study is that insulation should be on t h e outside of the floor j o i s t headers t o avoid condensation; farther information on t h i s aspect is g i v e n in k f e r e n c e (3). Results of the f i r s t roof-sheathing
inspection done in 1980 a r e r e p o r t e d in Reference ( 4 ) .
A l l four houses have central forced-air electric furnaces. The
furnace in H3 was t h e back-up heater for an a i r h e a t i n g solar system. The electric furnace in H4 w a s t h e back-up heater for an air-source h e a t
Pump-
The folIowiag seven s t u d i e s w e r e conducted and documented by the
contain a d d i t i o n a l information on these s t u d i e s . Data f r m d e t a i l e d
monitoring are also available from the Division.
THERMAL, PERFORMANCE OF STANDARD AND UPGRADED HOUSES
The measured energy losses and gains are given in T a b l e 2 for the
1978-79 heating season (4754 degree-days).
Table 2
Energy Comparison of B1 and H2*
-(1978-79)
Total purchased heating energy Gains from appliances, lights, sun
and p e o p l e
T o t a l b u i l d i n g energy loss
'Taken from Reference ( 2 )
The results can be summarized as follows:
-
the upgraded houseHZ
required 31% less purchased heating energythan the standard house H1;
-
the occupancy and solar gain f o r each of the houses t o t a l l e d7 . 5 PIWoh for the heating season; t h i s is equivalent to 32% and 40% of the t o t a l beat requirement for H1 and
HZ,
respectively;-
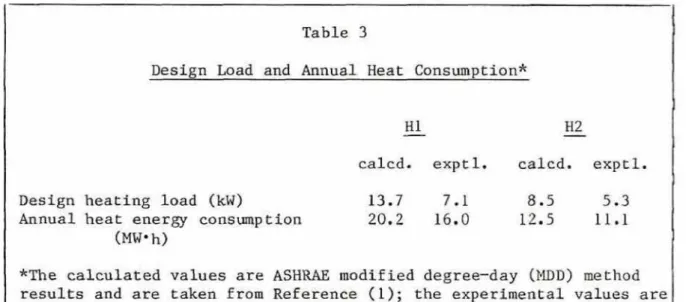
H2 had 21% less heat loss than H 1 .Table 3 compares the calculated and experimental' results for t h e
T a b l e 3
Design Load and Annual Heat Consumption*
HI
-
-
H2c a l c d . exptl. calcd. exprl.
Desfgn heating load (kW) 13-7 7.1 8 -5 5.3
Annual heat energy consumption 20.2 16.0 12.5 11.1
(Em-
h)*The calculated values are AS= modified degree-day (MDD) method results and are taken £ram Reference (1); t h e experimental values are
derived from Reference (2).
The design heating load is used t o size heating systems. Table 3
i n d i c a t e s t h a t the usual MDD method of calculation gives results for H1
and E2 that exceed the experimental values by 93X and 60%. The values
for t h e annual heat consumption using t h e MIlD methsd are higher than the experimental values by 261 and 33%.
Table 4 shows the heat loss distribution f o r H1 and HZ.
Table 4
Campartson of Heat Loss Distribution f o r H1 and H2*
Above-grade envelope Below-grade envelope Air leakage
*The calculated values are taken from Reference (1) using trhe MDD method; the experimental values are derived from References (2) and
(5)
calcd. exptl. calcd. exptl.
It is interesting t o note in Table 4 that although there is close agreement between the calculated and experimental above-grade envelope
losses, there are large discrepancies f o r the below-grade envelope and
air-leakage l o s s e s . This may explain t h e large disagreement in Table 3
between the experimental and MDD results, and s u g g e s t s the need to
THERMAL PERFORMANCE OF TFIE UPGRADED WALL SYSTEM
Houses H Z , HJ and $14 have an upgraded wall system ( i l l u s t r a t e d in Figure 3 ) . The thermal performance of the upgraded wall systems in li2
and li4 was monitored durlng the heating season of 198.13-81 to:
-
compare measured U-values with calculated R-values;- determine the effect o f framing members on the R-value of the wall system.
Measurement and equipment d e t a i l s are given in Reference ( 6 ) . Table 5 gives a summary of both measured R-values and R-values
calculated using standard ASHRAE procedures. The mean temperature, TM,
is the average of t h e i n s i d e and outside surface temperatures. A TM of
24-C is the reference temperature for laboratory measurements and f a r tables of R-values. A TM of 9OC corresponds to the average winter a i r temperature of -2°C for O t t a w a f r a m October through A p r i l . The
reference point of T p l = 9OC is given s i n c e i t represents the average f i e l d performance, whereas TM = 24'C is the laboratory reference point,
Generally, the R-value of insulations increases a# the TM decreases.
Table 5
Upgraded Wall System R-values
R-valueat R - v a l u e a t
Tfi = 24°C TM = 9OC
Insulation (through cavity)
- calculated 3.78 (21.5)
---
-
measured (average of northand smth wall) 3.76 (21.3) 4 . 1 4 (23.5)
Wall System (through cavity and studs)
-
calculated (thermal bridgingthrough framing members) 3.53 ( 2 0 . 0 )
--
-
measured (average o f northRS I
-
SIDING 0.18 SHEATH I NG 0.53 89 rnrn INSULATION 2.11 3 B m m INSUlATION 0.88 GYPSUM BOARD 0.08 TOTAL 3.78 HORIZONTAL ALUMINUM SIDING25 rnrn FIBRE BOARD SHEATHING 38 x 89 rnm (2 x 4) STUDS
FRICTION FIT GIASS FIBRE BAIT 0.10 mm (4 mil) POLYETHYLENE AIR-VAPOUR BARRIER
FRICTION FIT Gl
38 x 38 rnrn {2 x 21 HORIZONTAL STRAPP ING
(406 mm o. c. 1
ELECTRICAL WIRING I N THE 38 x 38 mm CAVITY TO AVOID PENETRATING A I R-VAPOUR BARR l ER
F I G U R E 3
The results shown in Table 5 indicate that:
-
the R-values calculated and measured through the Insulation f o r TN = 24OC agree;-
the measured R-value of the insulation for the average winter temperature {TM = g ° C ) is 4.14 which isIOX
more than thestandard calculation (TM = 2446);
-
the measured R-value through the wall system forTM
=24°C
is 17% less than the calculated R-value; thfs difference isprobably due to the nails in the wall/siding and to nonparallel
heat flows in the wall;
- the measured R-value of the wall system f o r the average- winter temperature ( T ~ = 9°C) i s 3.23; hence, the thermal perf ormanae
o-f the w a l l in winter is 8% less than that p r e d i c t e d by the standard calculation.
BASEMENT $'INDIES
The thermal performance of the basement: walls and floors of H1 and
H4 were monitored f r o m January t o A p r i l 1979. The results can be summarized as f o l l o w s ;
-
the heat loss rates of the below-grade walls and floors appeart o be independent of the outdoor temperature;
-
the total bklow-grade heat loss rate for the 1978-79 heating season was estimated to be 1.02 kW f a r H1 and 0.94 kW for €34( 8 % less);
-
the full-height insulation in H4 reduced the heat loss of the basement walls by 11% compared to HL;-
the west wall in the H4 basement, which i s adjacent to anotherheated basement, had a heat l o s s 30% lower than that of the
north wall facing the street.
More information is given in Reference (2).
In the summer of 1980 several sections of the basement w a l l of 8 1
w e r e r e i n s u l a ~ e d full hetght on the interior t o R 3.5 ( 2 0 ) by using a v a r i e t y of insulation materials and techniques. Thermal and moisture measurements are being carried out to evaluate the performance of the
wall,
Two cracks I n one basement w a l l of H2 are being monitored f o r variation in width. The- p a t t e r n of the cra&s suggests t h a t the w a l l
The water flow in the drainage tile around H4 was oecasianally monitgred since water flow around the baseaent can affect basement heat
loss.
AIR-LEAKAGE STUDIES
The standard house ( H I ) w a s b u i l t using paper-backed glass-fibre b a t t s . The upgraded houses (H2, H3, H4) contained a d d i t i o n a l insulation and a specially applied 0.10
m
( 4 m i l ) polyethylene a i r barrier toimprove air-tightness of the house envelope. A comparison of the air leakage rates of the two air-barrier systems shows their r e l a t i v e
effectiveness. During the 1978-79 studies, all four houses were heated
by e l e c t r i c furnaces. H3 had, in addition, an air-based solar heating
system and H4, a heat: pump system. None of the houses, therefore, had a chimney.
Air-Tightness
Air-tightness is represented by the a i r leakage into a house resulting from a pressure difference across the building envelope
induced by mechanical means. In 1978 and 1979, air-tightness t e s t s were
performed o n a l l four Mark XI houses (Hl, H2,
#,
H4) using the fanpressurization method. (Full results are given in Reference (5).) The
air-leakage rate w a s measured over a range of induced pressure
differences f r o m 8 to 80 Pascals (Pa).
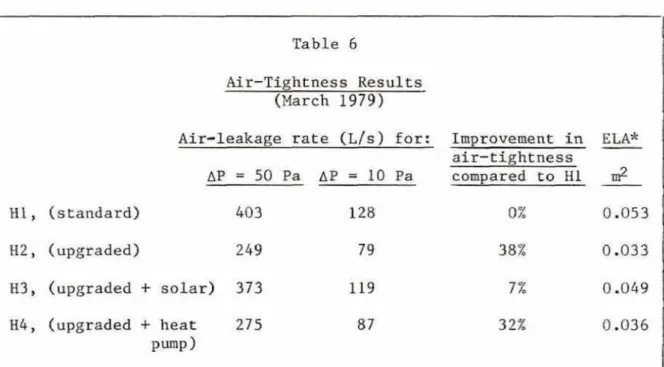
Table 6 shows some of the results from tests conducted in March 1979.
Table 6
Air-Tightness Results
(March
1979)Air-leakage rate ( ~ f s ) for: Impravemeat in
-
E M *air-tightness AP = 50 Pa AP = 10 Fa compared to H1
-
I$ H I , (standard) 403 128 0% 0 -053 8 2 , (upgraded) 249 79 38% 0 .a33 H 3 , (upgraded+
solar) 373 119 7% 0 -049 H4, (upgraded+
heat 275 87 3 2% 0.036 pump1*ELh is the equivalent leakage area calculated according to the Draft
The results shcw that the upgraded houses.
'H2
and H4 are s i g n i f i c a n t l y tighter thanHI,
whereas the solar house ?L3 I s only s l i g h t l y tighter thanHI.
The air-leakage rates were, on average,
101
higher than the valuesobtained a year earlier. This increase is attributed to t h e increase i n
leakage openings caused by the dryfng and shrinkage of building materials.
On comparing t h e air-tfghtness measurements carried out In 1978 o n 6 3 houses built in O t t a w a (Reference (7)), w i t h those on the four
Mark XI houses for 1978-1979, it can be seen that both 81 and H3 exceed
the lower l i m i t of these 63 houses, while H2 and H4 f a l l below it. The average a%r-leakage rate for H2 arnd
H4
is 473 of the average for the 63 houses.Air Inf iltraef en
Air infiltration is t h e uncontrolled leakage a£ air i n t o a house
resulting from pressure d i f f e r e n c e s across its envelope induced by wind
and inside-to-outside temperature differences. Air infiltration rates (natural a i r change rates) were measured simultaneously in both H1 and H4 between January and April 1939 using the trace.r-gas decay method with
carbon dioxfde (CO2) as the tracer gas. (Reference ( 5 ) gives complete
i n f o r m t i o n on these teats.) The average results for winter weather
condttions
CAP
20aC and wind velocity 3.5 mls) were 0.3 and 0.2 a i rchanges per hour (AC/h) for H1 and H4, respectively.
The Mark X I houses provided a unique opportunity to investigate
t h e correlation between air infiltration and air-tightness for chimneyless houses with identical location and surroundings.
Reference (8) shows a d i r e c t correlation, thus showing that the air
change rates for the %rk XI houses can be derived from their air-
tightness measurements. This knowledge fs valuable since it means that fan pressurization measurements, which are easier, quicker and cheaper
t o carry o u t than those using tracergas methods, can replace the
latter.
During the 1980-81 heating season a study w a s carried out on H3 to determine the effect of a gas furnace and chimney on the house a i r
leakage (Reference 9 )
.
Some of the results for H3 are as follows:
-
the air-tightness. value w i t h the chininey uncapped w a s a b u t 9% greater than with the chimney capped;-
switching from e l e c t t i c furnace to gas furnace operationresulted in a 50% increase in the a i r infiltration rate (wind
speeds ~ 3 . 5 d s ) ;
-
about 60X of the inside air exhausted to the outside through the chimney, and the remaining40%
exfiltrated through the upperThe interactton between mechanical ventilation systems and air
leakage is s t i l l being studied,
AIR-SOURCE HEAT P W SYSTEMS
One of the upgraded houses, H4, was used from 1978 to 1981 to study the thermal performance of airsource heat pump systems a s heating
systems. It was heated during the f i r s t two heating seasons by a heat pump of nominal 23-ton (9 kW) capacity w i t h three
4.5
kW stages ofelectric resistance heaters and demand defrost. During the t h i r d
heating season, a heat pump sf nominal I*-ton ( 5 . 4 kW) capacity with two
4.6 kW s t a g e s of e l e c t r i c resistance heaters and demand defrost was
used. The latter heat pump s i z e was t h e closest match to the house l o a d
according t o conventional sizing practice.
The seasanal performance factor (SPF) for the heat pump and
electric heaters equals the t o t a l heat they supply divZded by the t o t a l
energy they use. The SPF is calculated f o r the heatlng season and is always greater than 1.0 s i n c e the heat pump supplies more energy than it uses while extracting heat from the w t s i d c air.
Table 7 compares the heat pump performance for t h e three heating
seasons. Reference (10) gives further infortmtion.
Table 7
Heat Pump Results
2f -ton 14-ton
1978-79 1979-80 1980-81
(Dec.-May) (Sept.-May) (Sept.-Hay)
Degree-days ( % of average f o r period) 99%
96%
1Q
2ZSeasonal performance factor (SPF) 1.5 1.7 1.6
Energy supplied by heat pump
81L
88% 7 6% Energy supplied by resistance heaters 192 12% 24% Energy savings due to heat pump 32% 4 1% 392These energy savings, which average about 40% for 1979-81, are
indicative of the performance of any air-source heat pump in the O t t a w a region. The savings should be higher in warmer regions and lower in colder regions. Since the I*-ton heat pump showed energy savings as high as or higher than the 2*-ton heat pump (for equivalent degree-
days), the c o s t o f the larger size may not be j u s t i f i e d f o r this
particular haus e.
Some other aspects being s t u d i e d include:
-
variations of the SPF with different sizes of heat pumps used- the development of a method to calculate the SPF so that energy
savings can be predicted;
-
a comparison of demand..defroet; with rimed defrost;.In 1981-82 a new 2f-ton heat pmp with two parallel-running
compressors w i l l be used as the heating system. Other features include t w o 5 kW stages of electric resistance heaters and t i m e d d e f r o s t . With
the original 2*-ton heat pump, assistance was requtred from the electric
heaters below -15°C; in this two-compressor model the second compressor comes on at -lS°C to a s s i s t the f i r s t compressor. This m e a n s that the
electric heaters w i l l not: be needed u n t i l a much lower temperature.
SOUR HEATING SYSTEM
The solar heating system installation in HJ was completed in December 1977. Some of the characteristics of the system are as follows
(see Reference (11) for full d e t a i l s ) :
-
a pre-engineered system made available in 197.6;- an active system which runs in series with a 10 kW e l e c t r i c
furnace;
- 35 m2 air-heating flat-plate c o l l e c t o r s ;
-
5 m3 pebble-bed heat storage;-
an air-to-water heat exchanger for preheating hot water.During the 1978-79 heating season the system performed poorly. An examlnation of the system in the spring of 1979 shcwed two serious
faults: a malfunctioning damper and substantial air leaks throughout the system. Most problems were corrected where f e a s i b l e .
During the 1979-80 heating season, several problems p e r s i s t e d :
-
there was significant overheating of t h e indoor space on sunnyspring, summer and f a l l days;
- there w a s candensation on the inner glazing of a l l collector
pane 1s;
-
air leakage problems continued.The solar system was disconnected in the f a l l of 1980 so that H 3 could be u s e d for other experiments.
Table 8 shows the results of a i r infiltration measurements performed on
H 3 in March 1980. The average asr change rate for t h e heating season was estimated from these data to be 0.26 AC/h.
Table 8
Air Change Rates for H3 (March 1980)
Alr change rate Time spent: in mode Operating mode
AC/h
0.23 8 8% solar collection fan "off"
0.49 1 OX solar c o l l e c t i o n fan "on"
in storing-heat mode
2% solar collection fan "on" in
heating-from-collector mode
The average solar c o l l e c t i o n efficiency was 32% for the 1979-80 heating
season; 61% of the energy put into storage was later recovered as usable heat. The over-all energy results are given in Table 9.
T a b l e
9
Energy Supplied to H3 During 1979-80 Heating Season
Space-heating energy Hot-water energy Total energy
MW- h MWh MW' h
Electric 7.9 (54%;) 2.8 (57X) 10.7 (55%)
S o l a r 6.7 ( 4 6 2 ) 2.1 (43%) 8.8 (45%)
From Table 9 we see that the solar heating system s u p p l i e d 45% of the space-heat ing and hot-water energy demand for H3.
Even though a comparable installed solar heating system today would c o s t about 1/3 of the 1977 prfce, conventional energy conserving
options would be more attractive as energy-saving investments.
FIELD PERFORMANCE OF A NATURAL GAS FURNACe
The solar heating system of H3 was disconnected in the fall of
1980 and a gas furnace and gas vent (chimney) were i n s t a l l e d . The
objective was to study the field performance of a gas furnace in an unoccupied house during t h e winter of 1980-81.
The furnace and system characteristics were as follows:
- nominal 40,000 Btulh i n p u t and 32,000 ~ t u / h autpuK;
- no special energy-conserving features; - cambusticla air d r a m from the basement;
-
a chimney cqnsisting of a class B vent 12.7 cm ( 5 in.) ind f ametet which extended through the roof.
The gas furnace was connected in p a r a l l e l wlth a 10 kW forced-air
electric furnace; each furnace was used alternately for two-week
periods. The gas vent was capped when the electric furnace w a s in operation. ( ~ u r t h e r information is given in Ref ereuce (12) .)
The steady-state efficiency in percentage is the useful heat: supplied by t h e furnace divided by the heat content of the natural gas
input to the furnace (multiplied by 100). This is measured with the burner ruining continuously at optinurn operating conditions. For H3 the steady-state efficiency at the start of the h e a t h g season was 74% as
measured by the Canadian Combustion Research Laboratory of Energy, M3nes
and Resources Canada. At the end of the heating season, it was
discovered that the furnace was underfiring; hence, all the percentage
results reported for t h i s period m u l d have been slightly higher f o r t h e
properly adjusted furnace.
The gas-furnace-system efficiency at a given indoor-outdoor temperature difference (given as a percentage) i s t h e ratio of the
house-heating load to the energy content of the gas input e l t i p l i e d
by 100. It should be noted t h a t the increase in heat loss due to t h e a i r flow through the gas vent is not: considered as part of the house- heating load. The system efficiency was 502 for a 10°C temperature difference (low-load situation) and rose to 65% f o r a 50°C temperature
difference (high-load situation). The furnace w a s s l i g h t l y oversized for t h e house-heating load for R3 since it ran 84% of the t i m e ( i n s t e a d
o f 100Z) a t the Ottawa design temperature difference of 47'C.
The seasonal efficiency as a percentage i s the heat energy required to maintain the house at the t h e m s t a t set point: divided by
the energy content of the gas input for the heating season m u l t i p l i e d by 100. The seasonal efficiency for the gas furnace w a s calculated to
be 60%.
A steady-state efficiency result of
741
is t h e highest possiblepercentage s i n c e the only heat energy last by the furnace is the sensible and latent heat in the flue gases going up the chimney. A maximum (high-load) system e f f i c i e n c y of 65% is a lower percentage since
the hause has lost additional heat due to extra air leakage caused by t h e operation 0% the furnace and the chhmey. A seasonal efficiency of
60% is lower s t i l l since it is the average of the s y s t e m efficiencies
during the heating season.
S i m i l a r studies will be carried out durfng the 1981-82 heating season on two gas furnaces with higher efficiency; that is, an Fnduced-
MECHANICAL VENTILATION WITJJ HEAT RECOVERY
Ontario Hydro i n s t a l l e d and operated a mechanical ventilation system with a rotary heat exchanger in H2 from December 1978 t o
April 1979, which was used with a forced-air e l e c t r i c heating system
with no chimney. (See Reference ( 2 3 ) f o r f u l l d e t a i l s . ) During m o s t of
this period the house was occupied by two adults and two c h i l d r e n . The
o b j e c t i v e s of this experiment were to assess the economic viability of heat recovery and t o assess the capability of mechanical ventilation in
controlling indoor humidity.
Savings of 5020 kwh per heating season were p r o j e c t e d f o r the 85%
e f f i c i e n t heat exchanger. The occupants produced an average of
11.8 kglday of moisture. T a b l e LO shows the effects of ventilation r a t e s on air change rate and i n d o o r relative humidity.
T a b l e 10
Ventilation Rates and Indoor Humidity
Mechanical ventilation rate Air change rate Maximum relative (m3 l a i n ) ( AC/h) humidity reached
0 0.15 5 5%
1.7 0.40 3 9%
2.3 0.49 3 7 2
Both of the non-zero mechanical ventilation r a t e s i n T a b l e 10 produced aFr change r a t e s high enough to control indoor air contaminants and keep
t h e indoor relative humidity below 40%.
The following pages describe some Mark XI s t u d i e s for which no project reports have y e t been issued.
JJUMIIIITY ANI) AIR CHANGE
An experiment was conducted to investigate indoor moisture loss as an indicator of air leakage. The amount of water used by a humidifier to maintain a relative humidity of 40% w a s measured for several months. A l l f o u r houses were t e s t e d while unoccupied froln March t o May 1978;
only H3 and H4 underwent addittonal t e s t s from January to A p r i l 1979.
The results are being analyzed.
MOISTURE STUDIES
Moisture p i n s to m o n i t o r moisture levels were installed during
canstruction in 1977 on t h e warm s i d e of the polyethylene air-vapour barrier throughout the b u i l d z n g envelope of a l l four houses. There are
no condensatian problems for the areas of the building assemblies contafning at l e a s t two thirds of their K-value on the outside (cold s i d e ) of the a i r v a p o u r barrier. This concurs with the dew point
predictions. However, in t h e first- and second-floor joist headers of
H2, H3, and H4, all the insulation is located on the inside of the a i r vapour barrier; as a result, the moisture gins have shown high moisture
levels in winter which return t o n o r m 1 by summer. The first-floor
j o i s t headers, which are accessible from the basement, were retrofitted
with papepbacked glass-f ibre batts which lowered the mi sture content
to acceptable l e v e l s . Ifpfortunately, t h e second-floor j o i s t headers could not be modified since the construction d e t a i l used for t h e s e
headers made them inaccessible. To avoid similar s i t u a t i o n s in the
future, a d i f f e r e n t construction detail should be used.
The standard house, H1, has been occupied since April 1979 by a
family of two adults, two children, and two pets. It: has experienced interior condensatfon problems as evidenced by water streaming down windows and staining walls. T h i s house has an electric furnace force&
air heating s y s t e m and no chZmey. The 24-hour average indoor r e l a t i v e humidity during cold weather (e.g. -14°C) was 35%. One or more f o r ~ e d
ventilation systems will be u s e d during the 1981-82 heating season to
alleviate the problem sf condensation. H1 is the only house presently
~ccupied and the only one to have been occupied for more than a f e w
months.
W I N D AND PRESSURE EFFECTS
has been Zrlstrumented since the fall of 1980 to measure t h e effects of wind on pressure dffferences throughout t h e building assemblies, This continuing project w i l l help researchers t o advise
designers and b u f l d e r s by providing information on:
( 1 ) what kind of pressure dfffercncee develop across walls, windows and c e l l i n g s in small buildings;
(2) which building components are providing air resistance ia w a l l s and ceilings;
(3) how the pressure load IE transferred through the building
assemblies.
PROJECT PARTICIPANTS
Division of Building Research (NRC) HUaAC Task Force on Mark XI
Ontario Hydro
Consumers Gas
Forintek Canada Corp.
Canadian Combustion Research Laboratory (EMR) Talback Canstruction
Quirouette, R.L. The Mark XI Research Project: Design and
Coast ruction. Mat b n a l Research Council of Canada, Division of Bufldlng Research, Buildgag Research Note 131, Ottawa,
October 1978.
Brown, W.C. Mark XI Energy Research Project: Comparison of Standard and Upgraded Houses. National Research Council of
Canada, Division of Building Research, Building Research Note 160, Ottawa, June 1980.
Onysko, D.M., Demers, R. and Garant, J.C. Performance Testing of Floors at the HUDAC Mark XI Project. Forintelc Canada Corp. CFS
Contract 1980-81, C F S ~ D S S Project 9, Ottawa, March 1981.
Onysko, D.M. and Garant, J.C. Inspection of Roof SheaLhing at the HUDAC Mark XI Project. Forintek Canada Carp. CFS Contract:
1980-81, CFS/DSS Project 9, Ottawa, March 1981.
Shaw, C.Y. and Tamura, G.T. Hark XI Energy Research Project:
Air-Tightness and P i i r I n f ilt ration Measurements, National
Research Council of Canada, Divtsion of Building Research,
Building Research Note 162, O t t a w a , June 19.80.
Brown, W.C. and Schuyler, G.D. In-Situ Measurements of Frame Wall
Thermal Resistance. Prepared for submission to A S H W Winter Meeting, Houston, Texas, January 1982.
Beach, R.X. Relative Tightness of New Housing In the Ottawa Area.
National Research Council of Canada, Ilivision of Building Research, Building Research Note 149, Ottawa, June 1979.
Shaw, C.Y. A Correlatton Between Air Infiltration and Air
Tightness f o r Houses in a Developed Residential Area. ASHRAE
Transactions 1981, V a l . 8 7 , pt. 2.
Shaw, C.Y. and Brown, W.C. To be published.
Cane, R.E.D, F i e l d Performance a£ an Air-Source %at %mp in thk
HUDAC Mark XI Energy Research Project. National Research Council of Canada, Division of Building Research, Building Research
N o t e
174,
O t t a w a , May 1981.Sibbitt, B.E. and Carscallen, W.E. To be published. B r o n , W.C. To be published,
DtSilva, M.S. Operation Experience with a R e s i d e n t i a l Hechanical
Ventilation System with Heat Recovery. Mechanical Research Department, Ontario Hydro Research Division., k p p r t No. 81-51-K, Toronto, March 1981..