HAL Id: hal-01345472
https://hal.archives-ouvertes.fr/hal-01345472
Submitted on 13 Jul 2016
HAL is a multi-disciplinary open access
archive for the deposit and dissemination of
sci-entific research documents, whether they are
pub-lished or not. The documents may come from
teaching and research institutions in France or
abroad, or from public or private research centers.
L’archive ouverte pluridisciplinaire HAL, est
destinée au dépôt et à la diffusion de documents
scientifiques de niveau recherche, publiés ou non,
émanant des établissements d’enseignement et de
recherche français ou étrangers, des laboratoires
publics ou privés.
Experimental assessment of timing verification
techniques for AFDX
Marc Boyer, Nicolas Navet, Marc Fumey
To cite this version:
Marc Boyer, Nicolas Navet, Marc Fumey. Experimental assessment of timing verification techniques
for AFDX. ERTS 2012 - 6th European Congress on Embedded Real Time Software and Systems, Feb
2012, Toulouse, France. �hal-01345472�
Experimental assessment of timing
verification techniques for AFDX
1Marc BOYER – ONERA, The French Aerospace Lab – F31055 Toulouse Nicolas NAVET – INRIA/RealTime-at-Work – F54600 Villers-lès-Nancy
Marc FUMEY – Thales Avionics – F31100 Toulouse
Keywords : Timing verification, certification, communication networks, AFDX, Network Calculus, experimentations.
Abstract: Avionics systems distributed on AFDX networks are subject to stringent real-time constraints that require the system designer to employ techniques and tools to guarantee the worst case traversal time of the network (WCTT) and thus ensure a correct global real-time behavior of the distributed functions. The Network Calculus (NC) is an active research area based on the (min,+) algebra, that has been developed to compute such guaranteed bounds, and has been for instance successfully used to certify the Airbus A380 AFDX backbone. Over the years, a number of traffic models and verification algorithms have been developed and integrated into the NC theory, and there are now many possibilities to choose from in the NC framework, each offering a specific trade-off with regard to accuracy (tightness of the bounds), computation time (e.g., linear or exponential complexity) and complexity of the code. Different techniques are often best suited at the different phases of the development cycle: research on NC theory, preliminary feasibility assessment, design space exploration, certification, etc. The objective of the paper is to provide an experimental assessment of the performances of different verification techniques on hundreds of realistic networks randomly generated, where in previous studies comparisons were done only on few examples. The software toolset used in this study is the freely available AFDX benchmark generator NETAIRBENCH and the RTaW-Pegase timing verification software.
1 I n t r o d u c t i o n
1 .1 The Pegase project
The French PEGASE project [1], partially funded by the Agence Nationale de la Recherche (ANR), gathers academics (ENS, INRIA, ONERA) and industrial partners (Thales R&T, Thales Avionics, Thales Aliena Space, RealTime-at-Work) from the aerospace field. It has been undertaken to improve some key aspects of the Network Calculus and its implementation, in order to meet increasing requirements in terms of accuracy of the temporal evaluation and size of the systems that are to be studied. Ultimately, the objective is to come up with techniques and tools that enable the OEM to dimension an on-board system in the tightest manner (i.e. no over-dimensioning) while providing the necessary safety guarantees. To assess the gains achieved and the practicality of the software tool in an industrial context, three case-studies have been undertaken respectively on AFDX, SpaceWire and a NoC. This paper presents experimental results obtained with RTaW-Pegase [2] [3], the software tool developed in the project, on realistic AFDX case-studies.
1
1 .2 Worst-Case Traversal Time (WCTT) evaluation: an industrial requirement
With the increasing amount of critical data exchanged with real-time constraints in on-board aerospace systems, the computation of tight upper bounds on network traversal times is becoming a real industrial need. The reason is twofold. First, a tight and safe dimensioning of the hardware and software architecture is necessary. Second, it is required in the certification process to convince the certification authorities that the real-time and safety constraints are met. Network Calculus [4] has been used for almost the last 10 years for WCTT evaluation, for instance, to dimension and certify the AFDX network of the A380. Network Calculus (NC) is well suited to analyze large scale systems such as avionics systems where thousands of data streams are exchanged by hundreds of nodes, it may sometimes lead to pessimistic results. However, advances are being made, in particular in the PEGASE project (see for instance [5]), and as it will be shown in the avionic context tight bounds can now be derived with NC, reducing thus the over-provisioning of resources.
1 .3 Accuracy evaluation of WCTT techniques
There are different methods available to compute WCTT: Network-Calculus [4] as discussed before, but also the trajectorial approach [7], event-stream based formalism [9] and others based on discrete-event formalisms [10]. To the best of our knowledge, all performance evaluation studies in the literature suffer from the same shortcoming: methods are evaluated either on small hand-made examples, or on a single or few industrial configurations that are not fully described.
This raises several questions: would the good performances obtained with some method on some specific configuration also hold on configurations possessing other characteristics? Does the method scale so that it can be considered for use in an industrial context? How do I compare the results with what can be achieved with other approaches?
This paper intends to address some of these issues. Our contribution is twofold. First, we present a freely available AFDX benchmark generator called NETAIRBENCH that has been developed to allow fair comparison of methods on large sets of network configurations. Second, using the technique described in [8] that consists in identifying a lower-bound on the WCTT, we evaluate the pessimism of the main WCTT algorithms that are available today in the framework of Network-Calculus. These algorithms have been implemented in the RTaW-Pegase tool and their performance evaluation has been performed on hundreds of realistic configurations. This allows us to get some precise insight in the accuracy what can expect from each method, and bound the possible gain that can be achieved with any other possible methods.
2 R T a W - P e g a s e t e m p o r a l e v a l u a t i o n t o o l
2 .1 Architecture and development
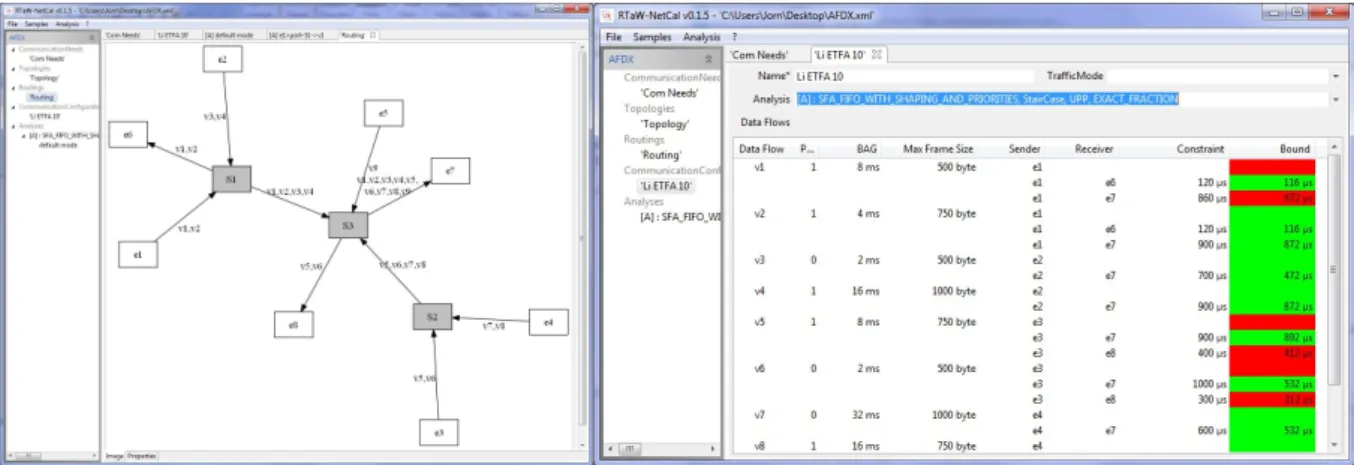
RTaW-Pegase has been conceived as a modular framework made of six main components including the MinPlus interpreter2, the Network-Calculus library and the Network Editor (see
screenshot on figure 1).
2
Figure 1: Screenshots of RTaW-Pegase. The left-hand panel shows the topology of an AFDX network. The gray boxes are the switches while the end systems are the white boxes. The names of the virtual links are shown as labels of the physical links. On the right-hand, the results panel shows the computed Worst-Case Traversal Times, where red means that the time constraint cannot be guaranteed for a given virtual link.
Java has been chosen as programming language for its lower risk of programming errors. Besides, the code of the GUI is mainly not hand-written but generated from a high-level specification in UML with RTaW-Generator which has been validated on several large projects. Given the safety requirements of the application domain, a particular effort is put on the validation of the code: numerous unit tests of the different components of the tools with the mandatory objective of 100% of source code coverage, static analysis of the source code with the tool SONAR and the objective to remove all identified warnings, extensive automated comparison tests with the Network Calculus tool NC-maude [6]. A more complete description of RTaW-Pegase (e.g., lines of code, complexity measure) can be found in [1] and [2].
2 .2 Different trade-offs between bound accuracy and computing time
The requirements of industrial users and researchers are sometimes conflicting. For instance, for an academic use, the software should implement models that are as general as possible - even if it is to the detriment of raw performance. The tool should also be extensible to enable exploratory work with new models and algorithms, as done with RTaW-Pegase in [5]. On the other hand, industrial users will want the tool to possess other characteristics such as contained computation-time, domain specific support in order to help avoiding modeling errors, ease of understanding and visualization of the analysis and optimization results, etc.
Over the years, a number of traffic models and verification algorithms have been developed and integrated into the NC theory, and there are now many possibilities to choose from in the NC framework, each offering a specific trade-off with regard to accuracy (tightness of the bounds), computation time (e.g., linear or exponential complexity), complexity of the code and generality of the underlying models. RTaW-Pegase has been conceived so as to enable the user to select the techniques that are best suited at each phase of the development cycle: research on NC theory, preliminary feasibility assessment, design space exploration, certification, etc.
The experiments in this paper are performed using several traffic and verification algorithms available within the framework of Network-Calculus that are described in Section 4.
3 N E T A I R B E N C H :
a
b e n c h m a r k
g e n e r a t o r
f o r
a v i o n i c
c o m m u n i c a t i o n s y s t e m s
3 .1 The need for freely available domain-specific benchmarks
One of the issues one has to deal with when working on design techniques for avionic embedded systems is the lack of publicly available benchmarks. From an industrial point of view, the confidentiality of design choices is of course justified but this makes the evaluation of performance and comparison of techniques/algorithms more difficult to undertake and necessarily less comprehensive. Indeed, in the WCTT literature, most of the experiments are made on the basis of a single case-study whose characteristics are often not fully disclosed, preventing anyone to reproduce the experiments.
We believe that a good solution to overcome the confidentially issue and be able to perform experiments on more than one or a few configurations, is to develop “realistic” benchmark generators and make them freely available. This has already been done for automotive systems with NETCARBENCH (see http://www.netcarbench.org).
Here we introduce NETAIRBENCH that is aimed to improve the assessment, the understanding and the comparability of techniques and tools used in the design of avionics communication systems. NETAIRBENCH is free for all uses and available from http://www.netairbench.org. NETAIRBENCH generates avionics message sets according to a set of user-defined parameters. If the parameters provided to NETAIRBENCH are realistic (i.e., they accurately capture the characteristics of the system under study), then the system description files that are generated will be realistic too. For the time being, NETAIRBENCH is only able to generate AFDX message sets but it will be extended to other communication protocols, as well as system level description (e.g., task scheduling, gateways between networks, etc), in the future depending on the users’ needs.
3 .2 A typical AFDX config uration
The following table summarizes the main characteristics of a typical AFDX configuration provided by Thales Avionics. Entities Number End Systems 104 Routers 8 Virtual Links 974 Latency constraints 6501
As can be seen in the following table, each Virtual Link (VL) has on average 6 destination end systems. This explains the 6501 latency constraints shown in the first table, which means also that 6501 WCTT bounds need to be computed.
# Virtual Link destinations BAG (minimum interarrival time) Maximal Packet Size # Traversed Routers Latency Constraints minimum 1.0 2 ms 100 bytes 1 1000 µs average 6.6 60 ms 380 bytes 1.3 10040 µs maximum 84.0 128 ms 1500 bytes 4 30000 µs
From this configuration, we are able to identify the main parameters of the communication system that will be the inputs of NETAIRBENCH.
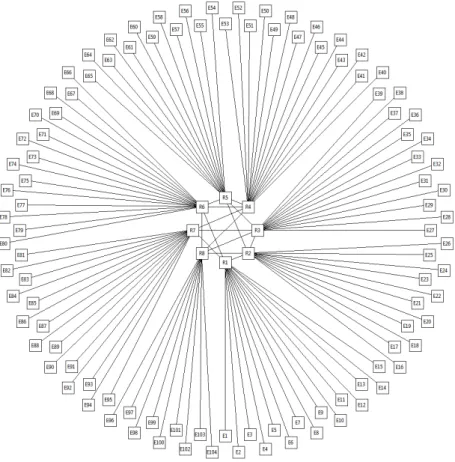
Figure 2: Typical topology of an AFDX network generated with NETAIRBENCH. The topology is realistic in terms of the overall structure and size of the system, number of end-systems per switch and the links between switches. The length of the links and exact location of the end-systems (i.e., AFDX nodes) are arbitrary chosen in this figure.
3 .3 NETAIRBENCH system description parameters and their values in the
e xpe r ime n ts
The characteristics of the systems to be generated by NETAIRBENCH are specified in an input configuration file (text format). A subset of parameters might be set to the same value for all generated configurations while others will take a value within a certain range of variation that corresponds to the expected variability of the parameter values. In the following, we list the parameters as well as the values chosen for the experiments of Section 4.
3.3.1 System dimensioning
The parameters that dimension the system are:
o Number of end-systems (experiments: [90,110] uniform distribution),
o Number of virtual links per end-system (experiments: [1,15] uniform distribution),
o Number of end-systems receiving the same virtual link (experiments: [1,15] uniform distribution),
o Number of end-systems connected to the same AFDX switch (experiments: [8,16] uniform distribution).
3.3.2 Stream characteristics
The user can define distinct subsets of minimal frame interarrival times (also called BAG) and for each subset, a specific range of variation can be enforced for the size of the frames. For instance, this allows to model that more frequent frames tend to be smaller in size. In the experiments, 3 subsets of BAGs are defined:
o {2ms, 4ms, 8ms} with a size uniformly distributed in [100 bytes, 400 bytes], o {16ms, 32ms} with a size uniformly distributed in [100 bytes, 800 bytes], o {64ms, 128ms} with a size uniformly distributed in [100 bytes, 1400 bytes].
3.3.3 Topology / Routing
The topology of the network is partly implied by previous parameters of the end-systems and the virtual links (e.g., number of virtual links per end-system). An additional user-defined parameter completes the topology description, which is the number of switches connected to the same switches. In the experiments, this quantity is chosen in [2,4] with an uniform distribution.
Regarding the routing of the virtual links, in the current version of NETAIRBENCH, it is done according to the « shorted path » policy (minimum number of switches between source and destination) knowing that unfeasible configurations are discarded (for instance, configurations where certain links are overloaded). Future versions of NETAIRBENCH will allow to specify alternative routing strategy that aim for instance to balance the load between routers and links.
4 E x p e r i m e n t a l a s s e s s m e n t o f t h e p e r f o r m a n c e s o f W o r s t - C a s e
T r a v e r s a l T i m e ( W C T T ) e v a l u a t i o n a l g o r i t h m s
4 .1 WCTT evaluation techniques in Network Calcu lus
An evaluation technique, and the set of corresponding algorithms, is characterized by 1) how numbers are represented internally (floating point or fraction), 2) by the class of mathematical functions on which the computations are done and 3) by the way input streams are modeled (e.g., stair-case work arrival functions). Table 1 summarizes the main WCTT evaluation techniques available today within the framework of Network-Calculus. The reader is referred to [1, 3] and [5] for more details about the algorithms, their algorithmic complexity and implementation issues.
Advantages Disadvantages Number represen tation Floating point
Faster execution of min-plus
operations.
Rounding errors and incompatibility with UPP function class.
Fraction No rounding errors and compatibility
with all function classes.
Slower execution of min-plus
operations. Function class ICC (Increasing Convex or Concave)
Implementation of min-plus operations are less complex and thus their execution is faster
Tighter stair case arrival functions cannot be represented and thus bounds on WCTTs are larger.
UPP (Ultimately
Pseudo Periodic)
Tighter stair case arrival functions can be represented and thus bounds on WCTTs are tighter.
Implementation of min-plus operation much more complex and thus their execution is slower.
ShSt (Shaped Staircase)
Intermediate complexity structure than can be handled efficiently with all function classes
Tighter arrival function which leads to tighter bounds on WCTT.
Input stream
Token bucket
Simple structure which is compatible with all function classes.
Looser arrival function which leads to larger bounds on WCTT.
modeling Stair case Complex structure that is not compatible with all function classes. Can only be handled with UPP functions.
Tighter arrival function which leads to tighter bounds on WCTT.
Table 1: Different modeling and computing possibilities in Network Calculus.
In the rest of this section, we will assess the relative performances of 3 techniques, corresponding to 3 meaningful trade-offs between computing time and accuracy:
1. Function class ICC / number representation: floating point / tocket bucket stream model (called later the ICC approach),
2. Function class Shaped-Staircase /number representation: fraction / stair-case stream model (called later the ShSt approach),
3. Function class UPP / number representation: fraction / stair-case stream model (called later the UPP approach).
It should be stressed that all 3 techniques provide upper-bounds on the WCTT, and thus they are safe to use. However, as it will be shown in the experiments, they are more or less conservative. Each experiment is made on 100 AFDX networks randomly generated by NETAIRBENCH with the parameters listed in Section 3. The case-study is performed in the non-prioritized case, which means that the virtual links all belong to the same class of traffic. The pessimism is evaluated by comparing the computed WCTT bound with a lower-bound (corresponding to a possible trajectory of the system) obtained with an algorithm similar to the one first proposed in [8].
4 .2 Methods comparison on a single configuration
Figure 3 presents WCTT upper bounds computed for a single configuration with three different methods (ICC, ShST and UPP) and one lower bound. There are thus four values shown for each VL. As expected, ShSt leads to more precise bound than ICC, and UPP provides the best one. The real worst case is unknown, but one knows that it lies between the UPP upper bound and the lower bound. It is worth pointing out that the differences (i.e., the absolute value) between the results of the methods are becoming more important for the VLs having the largest WCTTs. For the VLs with smaller WCTTs, all methods are quite close to the lower bound.
Figure 3: Upper bounds on the worst-case traversal times (WCTT in us) with the 3 methods under study (ICC/ShST/UPP) shown together with a lower bound on the WCTT. Virtual Links are sorted by increasing delay computed with UPP3
.
4 .3 Methods comparison on multiple configurations
Table 2 indicates the mean computation time for each method as implemented in RTaW-Pegase. The mean computing time per configuration with ICC is 1s, which is very fast for several thousands of virtual-links. This approach is thus well suited for design space exploration where numerous design choices are considered. The mean computing time per configuration with ShSt is 1.5s, which is still very fast given the size of the systems. With UPP, the order of magnitude of the computing time per configuration is 10s. This is still good given the better accuracy of the approach. However, it should be noted that when virtual links may have different priorities, for systems having the same size, the computing time become important (typically 20-30mn).
ICC ShSt UPP
1s 1.4s 10s
Table 2: Mean computing time per configuration.
Table 3 reports the gain of the UPP method versus ICC and ShSt. Table 4 gives a bound on the pessimism of each method. The statistics have been made on the 637362 virtual links of the 100 randomly generated configurations. As shown in Figure 3, the computing method makes a
3
The choice of UPP as the sorting parameter explains the regularity of the UPP curve and the irregular plotting of the others, but it is just a plotting effect, not related to the techniques themselves.
significant difference for VLs with large WCTT, this is why in the rest we make a special focus on the 20% of the VLs having the largest WCTTs.
All VLs 20% of VLs with highest WCTT
ICC vs UPP ShSt vs UPP ICC vs UPP ShSt vs UPP
Min +3.43% +0.25% +8.89% +1.16%
Average +18.08% +4.35% +22.37% +3.61
Max +44.34% +19.49% +38.06% +7.63%
Table 3: Method accuracy comparison.
All Virtual Links 20% of VLs with highest WCTT
ICC ShSt UPP ICC ShSt UPP
Min 3.74% 2.38% 0% 15.2% 12.41% 3.55%
Average 31.02% 27.86% 16.44% 42.08% 39.87% 25.37%
Max 82.4% 82.22% 76.09% 81.53% 81.6% 76.09%
Table 4: Upper bound on the pessimism of the methods.
To summarize the results, ICC approach is very fast but the less accurate, the ShSt is still fast but more accurate while the UPP is the slower but the most accurate. As shown in Table 3, the average accuracy difference between the methods is not hugely different for virtual links having large WCTTs. However, as it can be seen in Table 4, their pessimism increases significantly for the largest WCTTs. The average pessimism over all VLs of the 3 methods lies between 16% and 31% depending on the method, knowing that the real pessimism is certainly less than that because the lower-bound on the WCTT is probably most often lower than the actual WCTT.
5 C o n c l u s i o n
For the last 10 years, Network Calculus has proven to be a powerful formalism that is well suited to provide guarantees on the worst-case performances of large critical embedded systems, such as airplanes. Thanks to recent theoretical and algorithmic improvements, such as the ones that are being obtained in the Pegase project, it becomes possible to achieve significant gains in accuracy, reducing thus the over-provisioning of resources, and provide better support for design space exploration techniques. In this paper, we have compared on realistic case-studies the different verification techniques available within the framework of Network Calculus in terms of running times and accuracy of the results. This result should provide guidelines to the system designer regarding the choice of the best technique at each stage of the design cycle.
6 R e f e r e n c e s
[1] M. Boyer, N. Navet, X. Olive, E. Thierry, “The PEGASE project: precise and scalable temporal analysis for aerospace communication systems with Network Calculus, 4th International Symposium on Leveraging Applications of Formal Methods – Verification and Validation (ISOLA 2010), Amirandes, Heraclion, Crete, 18-20, October 2010.
[2] M. Boyer, J. Migge, M. Fumey, “PEGASE – a robust and efficient tool for worst-case network traversal time evaluation on AFDX”, SAE Aerotech, Toulouse, October 18-21, 2011.
[3] J. Migge, M. Boyer, M. Fumey, “Trade-Offs between Bound Accuracy and Computation Time in Switched Ethernet Networks with RTaW-Pegase”, Open Demo Session of Real-Time Techniques and Technologies of the 32nd IEEE Real-Time Systems Symposium (RTSS 2011), Best Demo
Award, Vienna, November 2011. More info at url
http://www.realtimeatwork.com/software/rtaw-pegase/.
[4] J.-Y. Le Boudec and P. Thiran, “Network Calculus”, ser. LNCS, vol. 2050, Springer Verlag, 2001.
[5] M. Boyer, J. Migge, and N. Navet, “A simple and efficient class of functions to model arrival curve of packetised flows,” in 1st International Workshop on Worst-case Traversal Time, in conj. with the 32nd IEEE Real-Time Systems Symposium (RTSS 2011), Vienna, November 2011. [6] Marc Boyer, “NC-maude: a rewriting tool to play with network calculus”, In T. Margaria and B. Stepen, editors, Proceedings of the 4th International Symposium On Leveraging Applications of Formal Methods, Verication and Validation (ISoLA 2010) , LNCS. Springer, 2010.
[7] S. Martin, P. Minet, "Schedulability analysis of flows scheduled with FIFO: application to the expedited forwarding class," 20th International Parallel and Distributed Processing Symposium (IPDPS 2006), 25-29 April, 2006.
[8] H. Bauer, J.-L. Scharbarg, C. Fraboul, “Improving the Worst-Case Delay Analysis of an AFDX Network Using an Optimized Trajectory Approach“, IEEE Transactions on Industrial informatics, vol 6, No. 4, November 2010.
[9] J. Rox, R. Ernst, “Formal Timing Analysis of Full Duplex Switched Based Ethernet Network Architectures”, Proc. of the SAE 2010 AeroTech Congress & Exhibition, 2010.
[10] S. Perathoner, E. Wandeler, L. Thiele, A. Hamann, S. Schliecker, R. Henia, R. Racu, R. Ernst, M. González Harbour, “Influence of different system abstractions on the performance analysis of distributed real-time systems”. In Proc. of the 7th ACM & IEEE international conference on Embedded software (EMSOFT'07), Salzburg, Austria, September 2007.