HAL Id: tel-01069303
https://tel.archives-ouvertes.fr/tel-01069303
Submitted on 29 Sep 2014
HAL is a multi-disciplinary open access archive for the deposit and dissemination of sci-entific research documents, whether they are pub-lished or not. The documents may come from teaching and research institutions in France or abroad, or from public or private research centers.
L’archive ouverte pluridisciplinaire HAL, est destinée au dépôt et à la diffusion de documents scientifiques de niveau recherche, publiés ou non, émanant des établissements d’enseignement et de recherche français ou étrangers, des laboratoires publics ou privés.
regimens on the evolution of soluble markers of
inflammation and immune activation in HIV-infected
patients
Suhaib Hattab
To cite this version:
Suhaib Hattab. Impact of different antiretroviral therapy (ART) regimens on the evolution of soluble markers of inflammation and immune activation in HIV-infected patients. Immunology. Université Pierre et Marie Curie - Paris VI, 2014. English. �NNT : 2014PA066126�. �tel-01069303�
THESE DE DOCTORAT DE L’UNIVERSITE PIERRE ET MARIE CURIE
Spécialité
Epidémiologie
Ecole doctorale Pierre Louis de santé publique
Epidémiologie et Sciences de l'Information Biomédicale
Présenté par
M. Suhaib HATTAB
Pour obtenir le grade de
DOCTEUR DE L’UNIVERSITÉ PIERRE ET MARIE CURIE
Sujet de thèse
Impact de différents traitements antirétroviraux (ARV) sur l'évolution
des marqueurs d'inflammation et d'activation immunitaire
plasmatiques chez les patients infectés par le VIH
Le 29 juillet 2014 devant le jury composé de:
Pr. Jacqueline CAPEAU Examinateur
Pr. Laurence WEISS Rapporteur
Mme. Carole DUFOUIL Rapporteur
I dedicate this work to my
parents, brothers, sisters and to my
lovely wife.
ACKNOWLEDGMENTS
This PhD work could not have been realized without the permanent and kind support of different people around me. Hereby, I would like to express my deepest thanks to them.
My thanks to,
Madam Dominique Costagliola for accepting my integration in her research team. Her
immense knowledge and experience in epidemiology and in statistics offered me a new field of cognition. Her guidance helped me in all the time of PhD study. It was my honor to work with her.
Pr. Christine Katlama who agreed to direct my thesis despite the huge responsibilities she
has. Her experience in the clinical research widened my angle of thinking concerning the research problem, the establishment of research hypothesis and study design.
Madam Marguerite Guiget, the co-director of my thesis for enlightening me the first glance of
research, who guided me in the first step of my thesis, who learned me the principals of statistics, who helped me realize all the necessary analyses. Her remarks and our discussions were always pertinent and helped me better do my job. Her encouragement and optimism relieved my desperation in the tough moments.
Pr. Laurence Weiss and madam Carole Dufouil, who accepted to participate in my thesis jury
and to review my manuscript. My thanks for their insightful comments.
Pr. Jacqueline Capeau not only for accepting to be examiner member in the jury, but also for
accepting my integration in her team to perform my Master training in 2009-2010 and then to orient me to join the research team of Pr. Christine Katlama and Madam Dominique Costagliola to perform my PhD. My experience in her team was the overture of the research field.
Pr. Rose Katz, for all the efforts she has made since 10 years to create and follow the
cooperation program between the UPMC and the Palestinian faculty of medicine. My sincere gratitude for all the logistical and human support and for the time she spent to accompany us during our stay in France.
My thanks to,
My colleges in the clinical research unit at the infectious diseases department of the Pitié Salpêtrière hospital, all the physicians, the assistants of clinical research and the nurses. My colleges in the INSERM U_1136 unit, PhD and master students, statisticians and assistants of clinical research.
My colleges in the immunology and virology laboratories. The collaboration with them was indispensable to realize this work.
Rachid Agher, the informatics specialist in our service, his kind help, patience, smile and
jokes made us laugh in the difficult moments.
An-Najah University, the university to which I am going, and the French consulate at Jerusalem for offering me the opportunity to get my PhD in one of the developed countries; France. Special thanks to our former dean Dr. Anwar Dudin.
The Palestinian community and my friends in France with whom I spent the wonderful moments.
My sincere thanks to my father, my mother, my wife, my brothers and sisters and all the members of my grand family. Their logistic, spiritual and psychological support alleviated the difficulties of being far from them during my stay in France.
Above all, I owe it all to ALLAH for granting me the health, the ability and the strength to undertake this research task and enabling me to its completion.
TABLE OF CONTENTS
I. RESUME DES TRAVAUX DE THESE ... 7
II. SCIENTIFIC PRODUCTION ... 19
III. ABBREVIATIONS LIST ... 20
IV. INTRODUCTION ... 23
V. STATE OF THE ART ... 25
A. Human immunodeficiency virus (HIV) ... 25
1. Epidemiology of HIV infection ... 25
2. HIV replication cycle ... 28
3. Immune response against HIV infection ... 30
4. The natural course of HIV-1 infection ... 34
5. Predictive biomarkers in the natural course of HIV infection ... 37
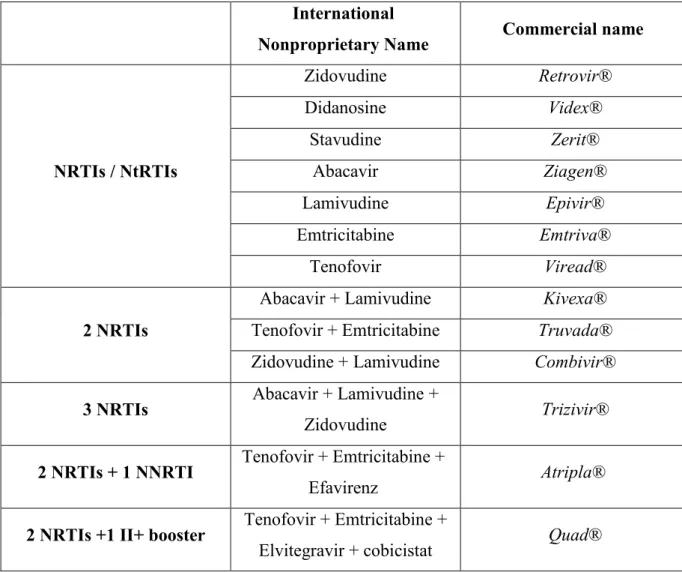
B. Highly active antiretroviral therapy: the revolution ... 41
1. Classes of antiretroviral therapy ... 41
2. Recommendations for first-line cART initiation ... 47
3. Benefits of antiretroviral therapy (ART) ... 50
4. Complications of cART ... 52
C. Beyond cART: failure of eradication, residual viremia and persistent immune activation and inflammation ... 55
1. HIV reservoirs and failure of eradication ... 56
2. Residual viremia ... 58
3. Persistent immune activation and inflammation among HIV-infected patients ... 58
VI. MATERIALS AND METHODS ... 70
A. Hypothesis and objectives of the study ... 70
1. Hypothesis ... 70
2. Objectives ... 70
B. Study design ... 70
1. Inclusion criteria of patients ... 70
2. Non-inclusion criteria ... 71
3. Controls ... 71
4. Ethical aspects ... 71
C. Database resources ... 72
1. Department of infectious diseases/ Pitié-Salpétrière hospital ... 72
2. NADIS® ... 72
D. Patients selection, clinical data collection and exportation ... 73
F. Biomarkers selection and measurement ... 74
1. Enzyme-Linked ImmunoSorbent Assay (ELISA) ... 76
2. Cytometric Bead Array (CBA) ... 77
G. Statistical analyses ... 78
1. Relationships between biomarker levels and patients characteristics at cART initiation ... 79
2. Changes in biomarker levels after two years of effective cART ... 79
3. Factors associated with persistent elevated marker levels after 2 years of cART ... 79
4. Comparative impact of different ART components on the evolution of biomarkers ... 79
5. Sensitivity analyses ... 80
VII. RESULTS ... 81
A. Impact of two years of effective first-line cART on soluble biomarkers of immune activation and inflammation ... 81
1. Summary of the study ... 81
2. Submitted article 1 ... 82
3. Supplementary data ... 106
B. Comparative impact of different ART components on the evolution of immune activation and inflammation markers ... 107
1. Summary of the study ... 107
2. Published article 2 ... 107
3. Supplementary data ... 117
VIII. DISCUSSION ... 119
IX. CONCLUSIONS AND PERSPECTIVES ... 130
X. BIBLIOGRAPHY ... 132
I.
RESUME DES TRAVAUX DE THESE
Introduction
Les traitements antirétroviraux combinés contrôlent la charge virale plasmatique du VIH chez la plupart des patients qui y ont accès. Cependant, il ne permet pas de restaurer complètement la santé et les patients sont encore plus à risque de comorbidités par rapport à la population générale (Shiels MS et al, 2009; Lang S et al, 2010). En outre, des niveaux élevés de l'activation immunitaire et de l'inflammation persistent malgré le contrôle de la virémie VIH par rapport à la population non infectée par le VIH (Reingold J et al, 2008; Neuhaus J et
al, 2010; Alcaide ML et al, 2013).
L'activation immunitaire et l'inflammation a retenu l'attention dans les dernières années après l'observation de l'association entre les marqueurs de l'inflammation et de la coagulation et la mortalité dans l'étude SMART; une étude qui a modifié les concepts sur la pathogenèse du VIH (Kuller LH et al, 2008). Suite à cette observation, plusieurs études ont montré une association entre les niveaux élevés des marqueurs inflammatoires et un risque accru de mortalité (Tien PC et al, 2010; Sandler NG et al, 2011) ainsi que des morbidités non-classant SIDA, notamment les maladies cardio-vasculaires et les cancers non-non-classant SIDA (Duprez DA et al, 2012; Borges AH et al, 2013; Tenorio AR et al, 2014). En outre, des études ont montré que les patients qui ont des niveaux élevés de l'activation immunitaire sont moins capables de restaurer les taux de cellules CD4+ (Lederman MM et al, 2011; Zhang X et al, 2013). Dans ce contexte, l‘activation immunitaire persistante peut être liée à la virémie résiduelle entraînée par les réservoirs cellulaires du VIH ou à la faible réplication (Mavigner M et al, 2009), la réactivation d’autres infections virales chroniques telles que le cytomégalovirus et le virus d'Epstein-Barr (Petrara M et al, 2012; Wittkop L et al, 2013). En outre, la profonde déplétion des lymphocytes T CD4+ au cours de la primo-infection à VIH peut conduire à une perte progressive de la fonction de la barrière intestinale, ce qui permet la translocation de la flore intestinale dans la circulation systémique (Brenchley JM et al, 2006).
Peu d’études ont été menées sur l'impact du traitement antirétroviral sur l’évolution des marqueurs d'activation immunitaire et d'inflammation avec des résultats variables (Smith KY et al, 2009 ; Funderburg N et al, 2010 ; McComsey GA et al, 2012). Ces études ont inclus des personnes ayant des niveaux et des durées variables du contrôle virologique, ce qui explique en partie leurs résultats discordants. Ces différences pourraient être aussi liées à des
différences du statut de maladie, et les différents régimes de traitement. Dans ce travail de thèse, j’ai étudié l'évolution des marqueurs d'activation immunitaire et d'inflammation solubles, chez les patients infectés par le VIH, initiant une première ligne de traitement antirétroviral avec un succès virologique rapide et persistant au cours de deux ans.
Objectifs
1. Identifier les relations entre les caractéristiques des patients et les niveaux des marqueurs de l'activation immunitaire et de l'inflammation avant l’initiation de traitement antirétroviral.
2. Evaluer l'évolution des marqueurs de l'activation immunitaire et de l'inflammation au cours de 2 ans de traitement antirétroviral efficace, en comparant les niveaux des marqueurs avant et après traitements avec les niveaux observés chez les témoins non-infectées.
3. Identifier les facteurs associés à des niveaux anormaux de ces marqueurs après 2 ans de traitement efficace.
4. Évaluer l'impact des différents traitements antirétroviraux sur ces marqueurs dans un groupe des patients qui ont conservé leur traitement initial sur les deux ans.
Méthodes
Population de l’étude
Dans cette étude observationnelle, nous avons évalué l’éligibilité de tous les patients infectés par le VIH–1 qui ont commencé une première ligne de traitement antirétroviral combinée entre Janvier 2006 et Décembre 2009, en utilisant la base de données NADIS. NADIS est un dossier médical informatisé conçu par des professionnels de santé pour améliorer le suivi des patients infectés par le VIH ou les virus de l’hépatite B et C. Les patients étaient éligibles s'ils avaient reçu un des deux ‘backbones’ (ténofovir-emtricitabine (TDF-FTC) ou abacavir-lamivudine (ABC-3TC), combiné avec un troisième agent (efavirenz ou un inhibiteur de protéase boosté par le ritonavir (atazanavir (ATV/r), lopinavir (LPV/r) ou fosamprénavir (FPV/r)). Ce sont les combinaisons de première ligne recommandés par les recommandations françaises à l’époque. Pour contrôler l'effet possible de la réplication virale
résiduelle sur l'activation immunitaire et l'inflammation, l'analyse a été limitée aux patients qui ont eu une réponse virologique rapide et persistante, définie par une charge virale VIH-1 plasmatique inférieur à 400 copies/mL à 6 mois (M6) et inférieure à 50 copies/mL à 24 mois (M24), sans valeurs supérieures à 1000 copies/mL entre M6 et M24. Les patients éligibles ont été inclus si les échantillons de plasma congelés obtenus au moment de l’initiation du traitement antirétroviral (J0) et à M24 étaient disponibles. Dans l'analyse de comparaison de l'impact des différents traitements antirétroviraux sur l'évolution des marqueurs, seuls les patients qui ont conservé le même régime sur les deux ans de l’étude ont été analysés pour contrôler l'impact de changement de traitement sur l'interprétation des résultats. La population témoin était représentée par 20 donneurs de sang VIH-séronégatifs. Les niveaux des marqueurs chez les témoins ont été évalués dans le cadre de l'étude ACTIVIR qui a été réalisée au laboratoire d'immunologie (INSERM, UMR_S 1135, CIMI, F-75013, Paris, France) en 2010. L'étude a été approuvée par les comités de protection des personnes et les patients ont signé un consentement concernant l'utilisation de leurs plasmas et le recueil de leurs données médicales tel que requis par la loi française.
Recueil des données cliniques
Apres avoir sélectionné la population d'étude,les données des patients ont été extraites de la base NADIS. En plus de NADIS, les dossiers médicaux papiers ont été utilisés pour compléter les informations manquantes ainsi que valider les informations extraites de NADIS. Les variables collectées comprenaient les caractéristiques, l'état clinique, biologique et thérapeutique des patients: sexe, âge, indice de masse corporelle (IMC), tabagisme, co-infections par l'hépatite B (AgHBs) et C (AcVHC), groupe de transmission, événements classant SIDA, taux de cellules CD4+ et de CD8+ thérapeutique, charge virale VIH-1 pré-thérapeutique, combinaison antirétrovirale initiale et toutes les modifications de traitement antirétroviral pendant les deux années. Ces données ont été recueillies dans un questionnaire papier (voir annexes) et ont ensuite été saisies sur Epi-info.
La préparation de plasma et les mesures des marqueurs
La sélection des marqueurs était basée sur deux critères :
1. la fiabilité de la mesure de ces marqueurs sur du plasma congelé. 2. la valeur prédictive de ces marqueurs.
Nous avons évalué l'IL-6 et la CRP-us en tant que marqueurs d'inflammation, IP-10 et MIG comme marqueurs d’activation des lymphocytes T, des monocytes et des macrophages, et CD14 soluble (sCD14) en tant que marqueur d'activation monocytaire. La méthode ELISA a été utilisée pour quantifier l'IL-6, la CRP-us et le sCD14, selon les instructions du fabricant. La cytométrie en flux a été utilisé pour déterminer les niveaux d’IP-10 et MIG sur un dispositif BD FACS Canto I. Ces techniques ont été choisies en tenant compte leur sensibilité pour mesurer les niveaux des marqueurs (la capacité de détecter le marqueur à un seuil bas). Les échantillons de J0 et M24 ont été testés dans la même série. Les mêmes marqueurs biologiques ont été mesurés avec les mêmes kits chez les témoins dans l'étude ACTIVIR.
Les analyses statistiques:
Pour étudier les relations entre les niveaux des marqueurs et les caractéristiques des patients avant l’initiation de traitement, les niveaux des marqueurs ont été comparés chez les patients infectés par le VIH en fonction de leur sexe, âge, IMC, le tabagisme, l'hépatite B, les événements classant SIDA, le taux de CD4+, le rapport CD4/CD8 et la charge virale, en utilisant des tests de Wilcoxon. Lorsqu'en univarié plus d'un facteur avait un p<0,15, des modèles de régression pas-à-pas descendante ont été utilisés pour déterminer les facteurs associés avec des taux élevés. L’évolution des marqueurs après 2 ans de traitement antirétroviral (la différence entre les valeurs des marqueurs à J0 et M24) a été testée utilisant le test de Wilcoxon apparié.
Pour identifier les facteurs associés aux niveaux élevés des marqueurs après 2 ans de traitement, les modèles de régression logistique ont été utilisés. Le niveau d’un marqueur a été considéré comme "élevé" si sa valeur était supérieure à la valeur moyenne plus deux écarts-types dans le groupe de témoin. Ces facteurs sont les suivants: sexe, âge, IMC, le tabagisme, l'hépatite B, les événements classant SIDA, le taux de CD4+ et la charge virale pré-thérapeutique, les blips virals entre M6 et M24 (charge virale >50 copies/mL et <1000 copies/mL entre M6 et M24), le changement de taux de CD4, et le rapport CD4/CD8 à M24. Les facteurs associés à des valeurs élevées de marqueur dans l'analyse univariée (p <0,15) ont été inclus dans l'analyse multivariée.
Pour comparer l'impact des différentes composantes de traitement antirétroviral (TDF-FTC vs. ABC-3TC et ATV/r, LPV/r vs. EFV) sur l'évolution des marqueurs, des modèles de régression linéaire ont été utilisés. Les groupes de traitement ont été comparés en utilisant un
plan factoriel. Le groupe des patients sous FPV/r n’a pas été inclus dans cette analyse en raison de sa petite taille (n=12) Les résultats sont exprimés comme la différence en pourcentage entre le rapport moyen observé entre M24 et J0 avec un traitement donné et le rapport moyen observé avec TDF/FTC et EFV, pris comme référence pour les comparaisons. Les relations entre les variables à J0 et les changements dans chaque marqueur ont été examinées dans des modèles de régression linéaires univariées. Ces variables étaient le sexe, l’âge, l’IMC, le tabagisme, la co-infection avec l’hépatite B ou C, les événements classant SIDA, et le taux de CD4 et la charge virale pré-thérapeutique. Les variables associées aux changements pour au moins un des marqueurs (p<0,10) et les blips viraux entre M6 et M24 ont été retenus dans les modèles de régression linéaire multivariée afin de contrôler les facteurs qui pourraient avoir influencé le choix du traitement ou affecté les changements des marqueurs. L'âge et le tabagisme ont été inclus dans les modèles multivariés car ces variables sont connus pour influencer les niveaux des marqueurs (Deeks SG et al, 2013 ; Pine SR et al, 2011). Les termes d'interaction entre ‘backbones’ et troisième agent ont été testés pour tous les marqueurs.
Résultats
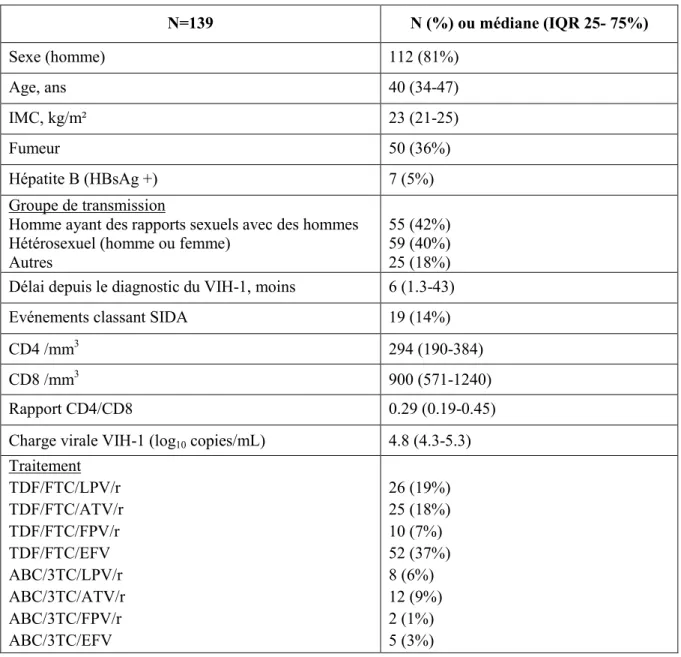
Les caractéristiques des patients et les niveaux des marqueurs à l'initiation du traitement (Tableau 1)
Entre janvier 2006 et décembre 2009, un total de 539 patients ont commencé un traitement antirétroviral et ont continué à être suivi à la Pitié-Salpètrière pendant au moins deux ans. Parmi eux, 370 patients ont eu une réponse virologique rapide et persistante au cours des deux ans et 280 patients ont reçu l'un des traitements retenus pour l'étude. Les 90 autres patients avaient reçu un traitement antirétroviral qui n'est plus recommandé ou avaient été inclus dans un essai clinique évaluant de nouveaux antirétroviraux comme le darunavir ou la rilpivirine. Des échantillons de plasma congelés à J0 et à M24 étaient disponibles pour 147 patients. Les caractéristiques des patients évaluables n'étaient pas différents de ceux pour lesquels il n'y avait pas de plasmas congelés en termes d'âge, de taux de CD4, de charge virale, d'évènements classant SIDA ni pour le traitement antirétroviral prescrit. Six patients co-infectés par le VHC et 2 patients ayant refusé de participer à l'étude ont été exclus. Au total, 139 patients sont donc inclus dans l'étude. Soixante-quatre patients (46%) ont eu des
modifications de traitement au cours de la période de l’étude, tous pour des raisons autres que l'échec virologique.
Tableau 1. Caractéristiques des patients à l'initiation du traitement antirétroviral
N=139 N (%) ou médiane (IQR 25- 75%) Sexe (homme) 112 (81%) Age, ans 40 (34-47) IMC, kg/m² 23 (21-25) Fumeur 50 (36%) Hépatite B (HBsAg +) 7 (5%) Groupe de transmission
Homme ayant des rapports sexuels avec des hommes Hétérosexuel (homme ou femme)
Autres
55 (42%) 59 (40%) 25 (18%) Délai depuis le diagnostic du VIH-1, moins 6 (1.3-43)
Evénements classant SIDA 19 (14%)
CD4 /mm3 294 (190-384)
CD8 /mm3 900 (571-1240)
Rapport CD4/CD8 0.29 (0.19-0.45)
Charge virale VIH-1 (log10 copies/mL) 4.8 (4.3-5.3) Traitement TDF/FTC/LPV/r TDF/FTC/ATV/r TDF/FTC/FPV/r TDF/FTC/EFV ABC/3TC/LPV/r ABC/3TC/ATV/r ABC/3TC/FPV/r ABC/3TC/EFV 26 (19%) 25 (18%) 10 (7%) 52 (37%) 8 (6%) 12 (9%) 2 (1%) 5 (3%)
A l’initiation du traitement antirétroviral, les niveaux médians d'IL-6, IP-10, MIG et sCD14 étaient significativement plus élevés chez les patients que chez les témoins (Tableau 2). Dans les analyses de régression pas à pas, les niveaux élevés d'IL-6 ont été associées aux événements classant SIDA (p<0,001). Les niveaux élevés d’IP-10 ont été associés à un rapport CD4/CD8 faible (p=0,007) et à une charge virale élevée (p=0,001), tandis que les niveaux plus élevés de MIG ont été associés à une charge virale élevée (p=0,024). Les niveaux élevés de sCD14 ont été associées aux événements classant SIDA (p=0,01).
Evolution immune-virologiques et changements des marqueurs de l'activation immunitaire et l'inflammation
Selon les critères d'inclusion, la charge virale du VIH était inférieure à 400 copies/mL à M6 et inférieure à 50 copies/mL à M24 chez tous les patients. Le délai médian jusqu'à la suppression virologique (<400 copies/mL) était de 2 mois. Entre M6 et M24, 29 patients ont eu un blip viral (médiane 77 copies/mL; range 51 à 804). Le taux de CD4+ a augmenté en médiane de 224/mm3 entre J0 et M24, et la valeur médiane à M24 était 523/mm3 (IQR
357-676). Le rapport médian CD4/CD8 est passé de 0,29 à l’initiation de traitement à 0,76 (IQR de 0,48 à 1,05) à M24. Soixante-onze patients (51%) avaient un taux de CD4 au-dessus de 500/mm3 à M24, et 52 patients (37%) avaient un rapport de CD4/CD8 supérieur à 0,9.
Comme le montre le tableau 2, après deux ans de traitement efficace, les niveaux d'IL-6, IP-10 et MIG ont baissés significativement, tandis que les niveaux de sCD14 n'ont pas changé de façon significative. Aucune différence dans les niveaux d'IL-6, IP-10 et MIG n’a été observée entre les patients et les témoins à M24, tandis que les niveaux de sCD14 sont restés plus élevés chez les patients, même après l'exclusion de ceux avec des blips de réplication virale.
Les facteurs associés aux niveaux élevés des marqueurs après 2 ans de traitement
Seuls 4 patients (3%) avaient des niveaux élevés d'IL-6 à M24, comparativement à 11% à J0 (p=0,008), de sorte que nous n'avons pas pu étudier les facteurs associés à la persistance de ce marqueur. Vingt-neuf patients (21%) avaient des niveaux élevés d’IP-10 à M24 par rapport à 86% à J0 (p<0,001). L'âge était associé à une élévation persistante des niveaux d’IP-10 (OR, 1,60 pour 10 ans; p=0.047). Vingt-deux patients (16%) avaient des niveaux élevés de MIG à M24, comparé à 81% à J0 (p<0,001), et l'âge était encore le seul facteur associé à la persistance des niveaux élevés de ce marqueur (OR, 1,92 pour 10 ans; p=0.007). Les niveaux de sCD14 sont restés stables au cours des deux ans du traitement: 24% des patients avaient des niveaux élevés à M24, comparativement à 32% à J0 (p=0,109). Dans une analyse supplémentaire, aucun facteur étudié n’était associé aux niveaux élevés de sCD14 à M24. Dans une analyse de sensibilité excluant les patients avec les blips virals, les proportions des patients qui avaient des niveaux élevés des marqueurs à M24 étaient similaires: 4 % pour l'IL-6, 18 % pour IP-10, 13 % pour MIG, et 25 % pour sCD14.
L’impact des différents traitements antirétroviraux sur l’évolution des marqueurs
Au cours des 2 ans, 78 patients ont conservé leur traitement initial. Si la nature des antirétroviraux prescrits n'est pas associée significativement à l’évolution d’IL-6, de CRP-us ou de sCD14, le type d'antirétroviraux a influencé l'évolution d’IP-10 et de MIG ; la baisse d’IP-10 et MIG était significativement plus faible avec ATV/r qu'avec EFV, alors qu'aucune différence significative n'a été trouvée entre le LPV/r et EFV ou entre ABC-3TC et TDF-FTC.
Tableau 2 : Niveaux des marqueurs chez les témoins (VIH-) et chez les patients infectés par le VIH à J0 et à M24; comparaisons avec les
témoins et changements des marqueurs au cours de traitement.
*, Calculé chez les témoins VIH séronégatifs (moyenne +2 SD) ; **, Wilcoxon signed rank. Valeurs présentés comme médiane (IQR 25-75%).
VIH- (N= 20) VIH+ J0 (N= 139) HIV+ J0 vs. VIH- VIH+ M24 (N= 139) VIH+ M24 vs. VIH- Changement entre M24 et J0 (N= 139) IL-6 (pg/mL) Valeur élevée* ≥ 5.7 pg/mL P-value** 0.45 (0.04-2.62) 1.64 (1.06-2.80) 11% p=0.005 1.14 (0.68-1.82) 3% p=0.074 -0.54 (-1.63 to 0.14) < 0.001 IP-10 (pg/mL) Valeur élevée ≥378 pg/mL P-value 246 (185-258) 717 (471-1065) 86% p<.0001 263 (187-346) 21% p=0.152 -420 (-723 to -212) < 0.001 MIG (pg/mL) Valeur élevée ≥955 pg/mL P-value 447 (353-525) 1660 (1091-2831) 81% p<.0001 473 (332-664) 16% p=0.385 -1107 (-2167 to -594) < 0.001 sCD14 (106pg/mL) Valeur élevée ≥2.98*106 pg/mL P-value 1.34 (0.56-1.87) 2.60 (2.09-3.10) 32% p<.0001 2.35 (1.97-2.95) 24% p<.0001 -0.18 (-0.75 to 0.55) 0.102
16
Discussion et perspectives
Mon travail de thèse a permis d’évaluer l'évolution des marqueurs d'activation immunitaire et d'inflammation solubles, chez les patients infectés par le VIH, initiant une première ligne de traitement antirétroviral avec un succès virologique rapide et persistant au cours de deux ans, afin de contrôler l’impact de la réplication virale résiduelle sur les changements des marqueurs. J'ai aussi évalué l'impact de différents régimes de traitement antirétroviral chez les patients ayant continué leur traitement initial au cours des 2 ans, contrôlant l’impact éventuel de changement thérapeutique. Dans cette étude, j’ai montré que : 1- Avant l’initiation du traitement antirétroviral, les niveaux des marqueurs d’activation et d’inflammation solubles sont plus élevés chez les patients que chez les témoins VIH-séronégatifs. Cette observation est concordante avec des études précédentes comme l’étude SMART qui a montré une corrélation entre la virémie VIH et les niveaux élevés des marqueurs d’inflammation en comparant avec un group témoin négatif pour le VIH (Neuhaus J et al, 2010). En outre, les niveaux élevés de sCD14 et d'IL-6 ont été associés à des événements classant SIDA. Cette association pourrait refléter le rôle de l'inflammation dans la pathogenèse de l'infection à VIH. Une étude cas-témoin a montré que les niveaux élevés de l'inflammation (CRP, IL-6), la coagulation (D-dimère), et la fibrose tissulaire (acide hyaluronique) mesurée chez les patients avant l'initiation du traitement antirétroviral étaient associés à un risque élevé des événements classant SIDA et à des décès (Boulware DR et al, 2011). Le fait que la réplication de VIH induit des fortes augmentations de l'IFN-γ (Stacey AR et al, 2009) explique l'association entre la charge virale élevée et les niveaux élevés d’IP-10 et MIG, des chimiokines induites par l'IFN-γ.
2- Après deux ans de traitement efficace, IL-6, IP-10 et MIG ont baissé de façon significative alors qu’aucun changement des niveaux de CRP-us et de sCD14 n’a été observé. Alors que les niveaux d'IL-6 sont resté élevé dans seulement 3% des patients, les niveaux d’IP-10 et MIG sont restés élevés chez un cinquième des patients après 2 ans de traitement. La différence dans la proportion des patients présentant un taux élevé d'IL-6, et la proportion des patients présentant un taux élevé d’IP-10 et MIG peut s'expliquer de différentes manières. Premièrement, la majorité des patients avaint eu un niveau dans les limites hautes de la normale d’IL-6 à l’initiation de traitement. En second lieu, la variabilité d'IL-6 dans le groupe témoin était plus importante que la variabilité d’IP-10 et MIG. La stabilité du taux de sCD14 peut s'expliquer par plusieurs façons. Tout d'abord, des facteurs autres que la virémie VIH
17
peuvent être responsables de l'élévation persistante de sCD14. Ainsi, deux ans de suppression virologique peuvent ne pas suffire à restaurer la fonction de la barrière intestinale permettant que la translocation bactérienne persiste (Cassol E et al, 2010). Deuxièmement, les régimes de traitement utilisé dans notre étude peuvent ne pas être efficaces pour atténuer l'activation monocytaire, alors que les régimes comportant du raltégravir ont été montré capable de réduire les niveaux de sCD14 (Taiwo B et al, 2013; Pallikkuth S et al, 2013). Dans notre étude, nous n'avons pas pu tester cette hypothèse car le nombre des patients qui ont changé leur régime vers raltégravir était très petit. La stabilité de CRP-us malgré la baisse de l'IL-6, l'une des cytokines qui déclenchent sa production par le foie, peut être induite par autres cytokines pro-inflammatoires telles que l'IL-1 (Pepys MB et al, 2003). De plus, la variabilité interindividuelle de ce marqueur observée dans cette étude pourrait expliquer en partie sa stabilité.
3- Même si l’âge n’a pas été associé aux niveaux élevés d'IP-10 et de MIG à l'initiation de traitement, une fois que la virémie VIH a été contrôlée, les patients plus âgés étaient plus susceptibles de conserver des niveaux élevés de ces marqueurs après 2 ans de traitement. Chaque augmentation de l'âge de 10 ans étaient associée à une augmentation d'au moins 60% du risque de maintenir des niveaux élevés des marqueurs d'activation immunitaire après traitement. Ces résultats sont compatibles avec le lien proposé entre l'activation immunitaire et le vieillissement prématuré chez les patients infectés par le VIH (Appay V et al, 2011) et peuvent expliquer en partie l’augmentation plus lente de cellules CD4+ chez les patients âgés observés dans un travail précédent de notre équipe (Grabar S et al, 2004). De la même façon, une étude a évalué les niveaux des marqueurs de l'activation immunitaire, la translocation microbienne et des biomarqueurs des maladies cardiovasculaires chez les femmes en post-ménopause, infectées par le VIH sous traitement antirétroviral avec une suppression virologique. Les niveaux de tous les marqueurs étaient significativement plus élevés chez les femmes infectées par le VIH suggérant que les femmes âgées sous traitement antirétroviral efficace sont dans un état d'activation immunitaire (Alcaide ML et al, 2013). Si l'âge était la seule variable associée à des niveaux d'activation immunitaire élevées post traitement, il est possible que le petit nombre des patients avec des niveaux d'activation immunitaire élevée ait empêché la détection d'une association avec d'autres variables telles que le taux des cellules CD4+ ou les blips de réplication virale. Enfin, du fait que l'échantillon a été sélectionné de manière rétrospective, le rôle d'autres co-infections comme le cytomégalovirus et les maladies sexuellement transmissibles, ou de comportements tel que l'usage de drogues ou une
18
consommation élevée d'alcool ou d'autres états inflammatoires non infectieux n'a pas pu être évalué.
4- Si les changements des marqueurs n'étaient pas différents entre les INTIs (TDF-FTC et
ABC-3TC), le type de troisième agent a été associé aux changements des marqueurs d'activation immunitaires IP-10 et MIG. La baisse d'IP-10 et de MIG était plus faible chez les patients qui ont reçu l’ATV/r par rapport aux patients qui ont reçus l’EFV alors qu'aucune différence n'a été observée entre les patients qui ont reçu le LPV/r par rapport aux patients qui ont reçu l’EFV. Ces résultats suggèrent que l’évaluation des marqueurs d'activation immunitaire pourrait être un critère utile lors de l'évaluation des nouvelles molécules antirétrovirales à cote de la mesure de charge virale et le taux des cellules CD4+.
A la fin de ce travail de thèse, plusieurs perspectives de recherche semblent pertinentes. Tout d'abord, si deux années de traitement antirétroviral virologiquement efficace n'est pas suffisante pour entraîner l'activation immunitaire à des niveaux normaux, il serait approprié d’évaluer cet impact après une plus longue période de suppression virologique (5 ans par exemple). Deuxièmement, notre population comportait des patients naïfs ayant initié un traitement antirétroviral avec une immunodéficience modérée, mais il reste à évaluer si l'initiation de traitement antirétroviral à un taux de CD4+ plus élevé (> 500/mm3), comme c’est désormais recommandé, pourrait diminuer la persistance de l'activation immunitaire post traitement. Troisièmement, l'impact des nouvelles molécules antirétrovirales sur l'activation immunitaire et l'inflammation doit être évalué. Parmi ceux-ci, dolutégravir qui a montré une efficacité supérieure à l'éfavirenz dans l'étude SIMPLE, mérite d’être évalué. Enfin, il serait intéressant d'évaluer l'impact du traitement antirétroviral sur l'activation et l'inflammation chez les patients qui restaurent un niveau de CD4 > 500/mm3.
19
II. SCIENTIFIC PRODUCTION
A. Published original article
HATTAB S, GUIHOT A, GUIGUET M, FOURATI S, CARCELAIN G, CABY F, MARCELIN A-G, AUTRAN B, COSTAGLIOLA D, KATLAMA C. Comparative impact
of antiretroviral drugs on markers of inflammation and immune activation during the first two years of effective therapy for HIV-1 infection: an observational study. BMC Infectious Diseases 2014 14:122.
B. Submitted article for publication
HATTAB S, GUIGUET M, CARCELAIN G, FOURATI S, GUIHOT A, AUTRAN B, CABY F, MARCELIN A-G, COSTAGLIOLA D, KATLAMA C. Soluble biomarkers of
immune activation and inflammation: impact of two years of effective first-line cART.
C. Oral communication
HATTAB S, GUIGUET M, CARCELAIN G, FOURATI S, GUIHOT A, AUTRAN B, CABY F, MARCELIN A-G, COSTAGLIOLA D, KATLAMA C. Impact de différents
traitements antirétroviraux (ARV) sur l'évolution des marqueurs d'inflammation et d'activation immunitaire plasmatiques chez les patients infectés par le VIH. 7eme
Conférence Internationale Francophone VIH/HEPATITES. AFRAVIH 2014, Montpellier,
20
III. ABBREVIATIONS LIST
ABC/3TC: Abacavir/Lamivudine ACTG: AIDS Clinical Trials Group
AIDS: Acquired Iimmunodeficiency syndrome
ALLRT: AIDS Clinical Trials Group Longitudinal Linked Randomized Trials APC: Antigen presenting cells.
ARV: Antiretroviral ATV: Atazanavir
AZT/3TC: Zidovudine/ lamivudine B2-microglobulin: Beta2-microglobulin
BMD: Bone mineral density BMI: Body mass index
cART: Combination antiretroviral therapy CBA: Cytometric Bead Array
CCR5: C-C chemokine receptor type 5 CMV: Cytomegalovirus
COREVIH : COordination REgionale de lutte contre le VIH COX-2: Cyclooxygenase type-2
CROI: Conference on Retroviruses and Opportunistic Infections CRP: C-reactive protein
CTL: Cytotoxic lymphocytes
CXCR4: C-X-C chemokine receptor type 4 CyA: Cyclosporine A
CYP3A4: Cytochrome P450 3A4
DEXA scan: Dual-Energy X-ray Absorptiometry EACS: European AIDS Clinical Society EBV: Epstein-Barr virus
EFV: Efavirenz
ELISA: Enzyme-Linked ImmunoSorbent Assay
ESPRIT: Evaluation of Subcutaneous Proleukin in a Randomized International Trial
FDA: Food and Drug Administration FHDH: French Hospital Database on HIV
21
FPV: Fosamprenavir
GALT: Gut-associated lymphoid tissue G-CSF: Granulocyte colony-stimulating factor
GM-CSF: Granulocyte-macrophage colony-stimulating factor gp 41: Glycoprotein 41
gp120: Glycoprotein 120
HAART: Highly active antiretroviral therapy HAND: HIV-associated neurocognitive disorders HBV: Hepatitis B virus
HCV: Hepatitis C virus HDAC: Histone deacetylases
HEAT study: HIV Study with Epzicom And Truvada HIV: Human Immunodeficiency Virus HLA B*5701: Human leukocyte antigen B*5701 HPTN study: HIV Prevention Trials Networks HR: Hazard Ratio
Hs-CRP: Highly sensitive C-reactive protein IFN-γ: Interferon-gamma
IL: Interleukin
INSIGHT: International Network for Strategic Initiatives in Global HIV Trials IP-10: Interferon gamma-induced protein 10
IQR 25-75%: Inter-quartile 25-75% LPS: Lipopolysaccharides LPV: Lopinavir
MACS: Multicenter AIDS Cohort Study MCP-1: Chemotactic protein 1
MHC: Major histocompatibility complex MI: Myocardial infarction
MIG: Monokine induced by interferon-γ
MIP-1 α/β: Macrophage Inflammatory Proteins-1 alpha/beta MSM: Men who have sex with men
MVC: Maraviroc
NF-κB: Nuclear factor kappa B
22
NNRTIs: Non-nucleoside reverse transcriptase inhibitors NRTI: Nucleoside analogue reverse transcriptase inhibitor NtRTI: Nucleotide reverse transcriptase inhibitor
OR (95% CI): Odds ratio (95% confidence interval) PBMCs: Peripheral blood mononuclear cells PD1: Programmed death 1
pDCs: Plasmacytoid dendritic cells PI: Protease inhibitor
PYFU: Person-years follow-up RAL: Rraltegravir
RANTES: Regulated on activation normal T cell expressed and secreted RNA: Ribonucleic acid
SATURN-HIV: Stopping Atherosclerosis and Treating Unhealthy Bone with Rosuvastatin in HIV
sCD14: Soluble cluster of differentiation 14 SDF-1: Stromal cell-derived factor 1
sICAM: Soluble intercellular adhesion molecule-1 sIL-2R: Soluble interleukin-2 receptor
SMART study: Strategies for Management of Antiretroviral Therapy SMR: Standardized mortality rate
SPIRAL study: Switching From PI to RALtegravir in HIV Stable Patients sTNFR-75: Soluble tumor necrosis factor receptor-75
sTNF-RI, II: Soluble tumor necrosis factor receptor-1 and II sVCAM-1: Soluble Vascular cell adhesion protein 1
TDF/FTC: Tenofovir/Eemtricitabine Th1, Th2: T-helper cells
Th17: IL-17-secreting T-helper cells TNF-α: Tumor necrosis factor-alpha
US DHHS: United States Department of Health and Human Services WHO: World Health Organization
23
IV. INTRODUCTION
The use of combination antiretroviral therapy (cART) controls HIV replication in the vast majority of compliant HIV-infected patients. However, it does not fully restore health and patients are still at higher risk of co-morbidities compared to the general population (Shiels MS et al, 2009; Lang S et al, 2010). In addition, higher levels of immune activation and inflammation markers persist despite the control of HIV viremia when compared to the HIV uninfected population (Reingold J et al, 2008; Neuhaus J et al, 2010; Alcaide ML et al, 2013).
Immune activation and inflammation has received attention in the last years after the observation of the association between inflammation and coagulation markers and all-cause mortality in the SMART study; a finding that modified the concepts about HIV pathogenesis (Kuller LH et al, 2008). In this study, patients who had IL-6 and D-dimer levels in the upper quartile at study entry were at 3 to 4 times increased risk of mortality compared to patients who had levels in the lower quartile. Following this observation, several studies have shown an association between elevated levels of inflammatory markers and increased risk of mortality (Tien PC et al, 2010; Sandler NG et al, 2011) as well as non-AIDS defining morbidities, notably cardiovascular disease and non-AIDS defining cancers (Duprez DA et al, 2012; Borges AH et al, 2013; Tenorio AR et al, 2014). In addition, studies have shown an association between high levels of immune activation and lesser increases in CD4+ T-cell count under cART (Lederman MM et al, 2011; Zhang X et al, 2013).
Several mechanisms have been proposed as potential causes for the persistence of immune activation and inflammation. Of these, HIV reservoirs and residual viremia have been shown to induce immune activation through HIV-antigenic stimulation of the immune system (Ostrowski SR et al, 2008; Mavigner M et al, 2009). Secondly, mucosal immune dysfunction characterized by profound depletion of CD4+ T-cells during the early acute phase of HIV infection can lead to a gradual loss of the intestinal barrier function, allowing translocation of the intestinal flora into the systemic circulation leading to immune activation (Brenchley JM et al, 2006; Sandler NG et al, 2012). In addition, the reactivation of other chronic viral infections such as cytomegalovirus and Epstein-Barr virus induces immune activation through non-HIV antigenic stimulation of the immune system (Petrara MR et al, 2012; Wittkop L et al, 2013).
24
The impact of antiretroviral therapy on soluble markers of immune activation and inflammation has not been well documented. Few studies have examined this impact in naïve HIV-infected patients with variable results. While IL-6 levels were found to decrease in the HEAT, MERIT and the ACTG A5224 studies (Smith KY et al, 2009; Funderburg N et al, 2010; McComsey GA et al, 2012), the evolution of other markers such as IP-10 and sCD14 varied between studies. While one study showed that IP-10 levels fell and sCD14 remained elevated (Cassol E et al, 2010), another found that both markers fell following therapy (Taiwo B et al, 2013). While these discrepancies might reflect differences in baseline HIV disease status, different ART regimens and treatment durations, we think that the major methodological problem in these studies is the inclusion of patients with different levels of virological response.
Given this research problem, my work was devoted to unravel the impact of ART on the dynamics of immune activation and inflammation markers in HIV-infected patients who initiate cART with rapid and persistent viral control over two years, to control the potential impact of viral replication on these markers. First, I evaluated marker levels in HIV-infected patients in comparison with uninfected controls and identified factors associated with high levels of markers before ART initiation. Then, I evaluated changes of markers over two years of cART and identified factors associated with the persistence of elevated levels. Finally, I compared the impact of different ART components on changes of markers among a group of patients who remained on the initial regimen over the 2 years.
25
V. STATE OF THE ART
A. Human immunodeficiency virus (HIV)
HIV infection, emerged through its devastating face of AIDS in early 1980s has led to an unprecedented epidemic in the modern era. Indeed, in 1981 the first cases of AIDS were identified in New York and California among young previously healthy homosexual men presenting an unusual clustering of rare diseases, notably pneumocystis carinii pneumonia, Kaposi’s sarcoma as well as cases of persistent lymphadenopathy (Gottlieb MS et al, 1981; Rolston KV et al, 1986). The observations regarding the immunopathogenesis of this disease and the pattern of occurrence indicated an infectious agent as the likely cause. Further research led to the isolation of the causing virus in the year 1983, and it was named Lymphadenopathy Associated Virus (LAV) in Europe and Human T cell Lymphotrophic Virus III (HTLV III) in the USA (Barre-Sinoussi F et al, 1983; Freedman D et al, 1989). It is now known as human immunodeficiency virus (HIV) that belongs to the lentivirus retroviruses family. In 2008, the Nobel Prize was attributed to Françoise Barré Sinoussi for the discovery of HIV.
1.
Epidemiology of HIV infection
Since the last decade of last century, HIV/AIDS epidemic has become the greatest challenge in global health. Overall the number of HIV infected individuals has regularly increased. In 2012, it is estimated that 35.3 (range 32.2-38.8) million persons are living with HIV worldwide. It is estimated that 2.3 (range 1.9-2.7) million have became newly infected with HIV and 1.6 (range 1.4-1.9) million died in the year 2012 (Unaids, 2013) compared to 5.6 million new infections and 2.6 million deaths in the year 1999 (Cock KM et al, 2000). Nowadays, the global prevalence of HIV infection has decreased and stabilized at 0.8 % (range 0.7% - 0.9%) (Dorrucci M, 2010).
The global statistics on HIV infection mask some important local and regional epidemiologic differences. The sub-Saharan Africa remains the most heavily affected region, with two-thirds of the global burden. In addition, regional differences in the trends and mode of transmission exist: epidemics of HIV in men who have sex with men (MSM) continue to expand in most countries notably in the developed countries while heterosexual transmission remains the main mode of transmission in sub-Saharan Africa (Beyrer C et al, 2012). Worldwide HIV/AIDS prevalence is shown in figure 1.
26
In France, according to the French National Institute for Public Health Surveillance, it is estimated that 6400 individuals were newly diagnosed in the year 2012, a stable number since 2007. The number of newly diagnosed cases of HIV infection was stable in all groups except among MSM where the number increased and attributed to 42% of new diagnosed cases in 2012. The increasing number of newly diagnosed cases seems to be the result of a greater use of screening in this population including the use of rapid diagnostic tests (http://www.invs.sante.fr). The incidence of HIV infection was estimated at about 17 per 100 000 person-years. Even the incidence of HIV infection has decreased between 2003 and 2008, it remained high and stable in MSM with an incidence of 1006/100 000 person-years in MSM compared to 86/100 000 years in intravenous drug users and 9/100 000 person-years among heterosexuals (Le Vu S et al, 2010).
In 2010, it was estimated that 149900 (95% CI; 134700-164900) HIV-infected persons were living in France. Of those, 81% were diagnosed while the remaining 19% ignored their seropositivity. While 74% of HIV-infected patients were receiving care, only 56% of them achieved controlled viral load. In addition, the proportions of diagnosed patients, those under care and those with a perfect response to antiretroviral therapy defined as achieving control of viral replication (controlled viral load) varied according the transmission mode. While the highest proportions were found among drug abusers, the lowest proportions were among non-French heterosexuals (Supervie V et al, CROI 2013, Abs. 1030).
27
28
2.
HIV replication cycle
Understanding the major steps of HIV replication cycle has been key to investigate molecules that could block its replication and permitted the manufacturing of antivirals directed against important steps of this cycle.
- Step 1 Fusion and entry:
After penetration in the body through mucosa in case of sexual transmission or directly in blood, HIV begins its replication cycle when it binds to different cell types including T-helper lymphocytes, macrophages and dendritic cells. In the mid-nineties, it has been demonstrated that this binding occurs through the reaction of the viral glycoprotein 120 (gp120) to CD4 receptor and one of two co-receptors, CXCR4 or CCR5 (referred to as X4 and R5 respectively) found on the surface of these cells (Deng H et al, 1996; Feng Y et al,
1996). This binding allows the fusion peptide (gp 41) to penetrate the cell membrane which permits the virus to release the RNA, its genetic material in the cytoplasm of the host cell (Azevedo JM et al, 2008).
-Step 2 Reverse transcription:
Once the RNA is released in the cytoplasm of the host cell, an enzyme called reverse transcriptase(RT), specific of retroviruses, copies RNA into a complementary DNA (cDNA) molecule. This major step is error-prone, and the resulting mutations may cause drug resistance or allow the virus to evade the immune system (Sarafianos SG et al, 2009). The RT also has DNA polymerase activity that creates a sense DNA from the antisense cDNA. Together, the cDNA and its complement form a double-stranded viral DNA that migrate toward the nucleus of the host cell and penetrate it.
-Step 3: HIV integrates the cell genome:
After penetrating the nucleus of the host cell, the integration of viral DNA in the cellular DNA takes place with the aid of viral integrase which catalyzes insertion of the both 3’ viral DNA ends into target DNA (Cherepanov P et al, 2011, Krishnan L et al, 2012). This integrated viral DNA may then lie dormant, in the latent stage of HIV infection (Taube R, 2013). To actively produce the virus, certain cellular transcription factors need to be present, the most important of these is NF-κB (NF kappa B), which is up regulated when T-cells become activated (Hiscott J et al, 2001; Colin L et al, 2009). Latent infected cells could
29
remain inactive for several years. When an infected cell with integrated DNA duplicates, this leads to the production of two cells carrying viral DNA. After being integrated in the host genome, the provirus uses host RNA polymerase to generate messenger RNA (mRNA). This mRNA is then exported from the nucleus to the cytoplasm where it is translated into immature viral proteins.
-Step 4: Protein cleavage and assembly:
The viral protease then cleaves the long chains of HIV proteins into smaller individual proteins (Kohl NE et al, 1988) which assemble with HIV RNA genetic material creating a new virus particle. During budding the virus steals part of the cell outer envelope. This envelope, which acts as a covering is studded with HIV glycoproteins (gp120 and gp41) necessary for the virus to bind CD4 receptor and co-receptors to infect other cells.
The final step of the viral life cycle is called budding. With its genetic material tucked away and a new outer coat made from the host CD4 cell's membrane, the newly formed HIV pinches off and enters into circulation, ready to start the whole process again. Different steps of HIV replication are shown in figure 2. Using a mathematical model, Perelson AS et al estimated that the minimum duration of the HIV-1 life cycle in vivo is 1.2 days on average, and that the average HIV-1 generation time, defined as the time from release of a virion until it infects another cell and causes the release of a new generation of viral particles, is 2.6 days (Perelson AS et al, 1996).
30 Figure 2: HIV replication cycle (Adapted from Volberding P et al, 2010).
3.
Immune response against HIV infection
The first response against the HIV infection takes place at the site of infection in order to prevent viral entry. Mucosal epithelium mediates innate defenses through signaling system with Toll-like receptors and provides an array of inhibitory molecules such as SDF-1, MIP-1 α/β and RANTES (SDF-1 blocks CXCR4 while MIP-1 α/β and RANTES block CCR5). The vaginal inoculation of virus leads to the expression of chemokines (MIP-3α) that recruit interferon (IFN)-α/β producing plasmacytoid dendritic cells (pDCs) and to the production of pro-inflammatory cytokines (GM-CSF, IL-1, IL-6 and IL-8) that recruit neutrophils, macrophages and lymphocytes to the endocervix (Haase AT et al, 2010). The response of
31
pDCs results in the induction of inflammatory cytokines, which are involved in directly setting up an antiviral state, and indirectly activating other antiviral cells of the innate immune system (Carrington M et al, 2012). Natural killer cells mediate antiviral control, through the recognition of virally infected cells through a network of receptors called the killer immunoglobulin-like receptors (Alter G et al, 2011).
Figure 3: Early immune response upon HIV transmission (Adapted from Haase AT et al,
2010).
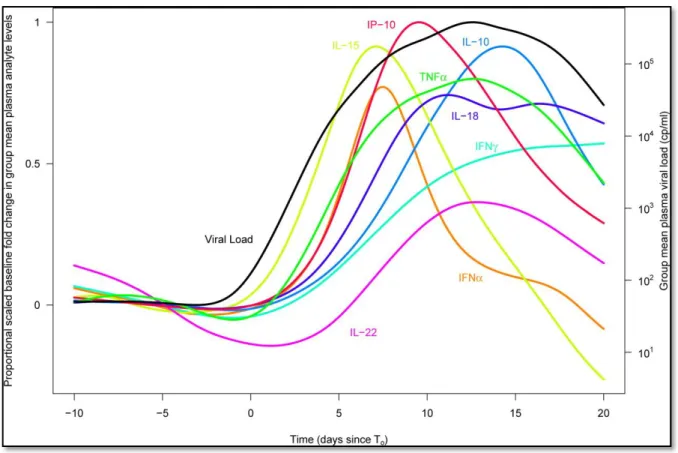
Paradoxically, these innate antiviral and inflammatory defense mechanisms may facilitate virus transmission, by increasing target cell availability, and by creating conditions for highly efficient cell-to-cell spread of infection. The innate immune response, the inflammatory response and the large increases in IFN-γ expression brings in large numbers of target cells to create a generally favorable environment to fuel expansion of HIV (Figure 3). The virus migrates to the gut-associated lymphoid tissue (GALT) and viral replication takes place and reaches its peak that can exceed 10 million copies/mL. This peak is associated with a cascade of elevations in cytokine and chemokine levels (cytokine storm). Stacey AR et al quantified levels of 30 cytokines and chemokines using sequential plasma samples collected during the eclipse and exponential viral expansion phases from subjects acquiring HIV-1. The increase in plasma viremia in acute HIV-1 infection was found to be associated with
32
elevations in plasma levels of multiple cytokines and chemokines (Figure 4), including rapid and transient elevations in IFN-α and IL-15 levels; a large increase in IP-10 levels; rapid and more-sustained increases in TNF-α and MCP-1 levels; more slowly initiated elevations in levels of additional pro-inflammatory factors including IL-6, IL-8, IL-18, and IFN-γ; and a late-peaking increase in levels of the immune-regulatory cytokine IL-10 (Stacey AR et al, 2009).
Figure 4: The cytokine storm associated with HIV replication (Adapted from Stacey AR et al, 2009).
Although the cytokines/chemokines produced in acute HIV infection contribute to the control of viral replication, their role is not sufficient. The cellular immune responses appear at the end of the second week of infection following antigen expansion and peak replication. These responses are considered late because they cannot clear the virus locally or prevent systemic spread.
Cellular immune responses consist of both helper and cytotoxic T-lymphocytes. Helper T-lymphocytes differentiation into Th1 or Th2 cells is induced by antigen presenting cells (APC). Th1 lymphocytes produce IL-2, IL-12, IFN-γ, and TNF-α which help in the development of cytotoxic lymphocytes (CTL) against HIV. Th2 lymphocytes produce specific
33
interleukins (IL-4, IL-5 and IL-10) and induce the differentiation of B lymphocytes into plasma cells which produce different antibodies against HIV proteins.
Cytotoxic T lymphocytes play a key role in the immune response against HIV infection particularly before antibodies production. They mediate dual antiviral suppression function by both cytolytic and non-cytolytic mechanisms. The predominant cytolytic mechanism requires direct contact of these lymphocytes with HIV-infected major histocompatibility complex (MHC) class I matched target cells presenting the antigen on their surfaces. This contact leads to the lyses of infected cells mediated by the secretion of granzymes and perforin (Bots M et al, 2006; Voskoboinik I et al, 2006). The second mechanism is mediated by soluble inhibitory factors produced upon T-cells activation (RANTES, MIP-1 α/β). These three factors contribute to an inflammatory response by recruiting leukocytes to the site of infection and inhibit HIV replication by binding its receptor (CCR5) (Demers KR et al, 2013). Figure 5 illustrates the cellular immune response against HIV infection.
Figure 5: The cellular immune response against HIV infection (Available at:
34
Humoral immune response against HIV infection consists of antibodies against the virus envelope and capsid (p24, p18, RT and nef) proteins. These antibodies appear 3 to 12 weeks after the contamination with the virus and persist till the progression of the disease where they start to decrease. Only neutralizing antibodies could have protecting role but they appear 2-6 months after the contamination (Alter G et al, 2010). The initial group of antibodies defined some of the sites of HIV-1 vulnerability on the envelope spike which consists of three g120/gp41 heterodimers. These sites included the CD4 binding site (CD4bs); the N160 glycan-dependent site associated with the V1/V2 loops; the N332 glycan dependent site at the base of the V3 loop; and the membrane-proximal external region (MPER) on gp41 (Mascola JR et al, 2010). Recently, additional sites of vulnerability are being identified as exemplified by 8ANC195 and 3BC176 that recognize yet to be defined epitopes (Klein F et
al, 2013). In addition to the late appearance of these antibodies, the gene encoding the HIV
envelope displays an enormous amount of diversity allowing the virus to escape these antibodies.
4.
The natural course of HIV-1 infection
HIV infection initiates a process that leads to progressive destruction of CD4+ lymphocytes, the preferred target cell for HIV-1 infection. The course of HIV-1 infection varies from person to person but a typical pattern is characterized by three phases that occur over a period of years:
Primary infection
Corresponds to a cascade of biological events that follow the penetration of HIV and lasts 2 to 8 weeks. Following the local innate immune response and the production of inflammatory cytokines, the virus rapidly migrates, probably via draining lymph nodes to the gut-associated lymphoid tissue (GALT) where the establishment of productive infection is dictated by the availability of target CD4+ T cells that express the chemokine receptor CCR5 (Moir S et al, 2011). HIV replicates aggressively reaching levels of plasma viremia as high as 10 million copies/mL inducing a cascade of elevations in cytokine and chemokine levels (cytokine storm). This phase is accompanied by a dramatic depletion of CD4+ T cells in the peripheral blood as well as a massive depletion of CCR5+ memory CD4+ T cells in the GALT, a determinant factor of disease progression. Specific losses in mucosal immune function have been associated with the preferential depletion of IL-17-secreting (Th17) CD4+ T cells, which are a subset of T helper cells that are involved in mucosal host defense against
35
extracellular bacteria (Brenchley JM et al, 2008). This depletion leads to the translocation of microbial products into the systemic circulation and the induction of immune activation. Another important event that occurs in this phase is the establishment of the resting CD4+ T cell reservoirs and the dissemination of HIV in other lymphoid organs (discussed later). Early events associated with HIV infection are shown in figure 6.
Clinically, patients usually present signs and symptoms of viral infections including fever, lymphadenopathy, pharyngitis and cough during this phase (Touloumi G et al, 2000). However, primary infection remains asymptomatic in some patients. Patients with symptomatic primary infection may progress to have AIDS more rapidly than people with low-grade symptoms or asymptomatic primary infection (Henrard DR et al, 1995). Viral replication is massive with over million viruses found in blood and the contagiosity of the newly infected subject is very high. Recognition of this brief syndrome is of major importance to prevent further viral dissemination. Then, with the emergence of immune responses in particular HIV-specific CD8+ T cell responses, HIV viral loads starts to decline precipitously (Touloumi G et al, 2000).
Figure 6: Early events associated with acute HIV infection (Adapted from: Moir S et al,
36
The asymptomatic phase of HIV infection
Is a dynamic process of virus production and clearance by the immune responses which maintain HIV-RNA stabilized around a set point (Pantaleo G et al, 1995). As the immune response is not sufficient to control the virus, the replication continues in the presence of the activated immune system (clinical latency) and leads to slow and gradual depletion of CD4+ T lymphocytes count and this decline varies among individuals. Depending on a rate of CD4 decline between 50-100 cells/mm3 per year, the asymptomatic phase may last 10 years in some individuals. Without any symptoms, HIV-infected individual are however a source of contamination for their sexual partners.
The symptomatic phase:
Prior to the development of AIDS, the homeostasis between the viral replication and the immune responses breaks and leads to rapid depletion of the total T cells and eventually in immune collapse. The reason behind this break may be due to the exhaustion of the proliferative capacity of lymphocytes and progressive deterioration of lymphoid organs as well as the HIV-induced immune activation. It is in this phase where AIDS defining diseases such pneumocystis jirovecii pneumonia, Kaposi’s sarcoma and tuberculosis appear mainly when CD4 counts drop below 200 cells/mm3. Figure 7 illustrates the natural course of HIV
37 Figure 7: The natural course of HIV infection (Adapted from Fausi AS et al, 1996)
5.
Predictive biomarkers in the natural course of HIV infection
From the beginning of the epidemics, before being able to directly quantify virus production in blood, different biomarkers have been investigated as surrogate markers to predict HIV disease progression namely occurrence of AIDS, or death in the different attempts to identify drug targets for clinical interventions. These biomarkers could reflect the intensity of viral replication, the degree of immune system activation and the degree of immune deficiency. Beside the predictive value of CD4+ cell count and percentage, neopterin, B2-microglobulin (immune activation markers) and p24 antigen were identified as predictive
biomarkers of HIV disease progression and all-cause mortality before the availability of viral load measurement. Later in 1995, the HIV-1 RNA revealed as strong predictor of HIV progression to AIDS and death independently of CD4+ lymphocyte count (Mellors JW et al, 1995; Mellors JW et al, 1997). Since then, CD4+ cell count and HIV-1 RNA are the most accurate predictive biomarkers in HIV infection and the standard investigation in HIV infected patients. In addition to markers of immune activation, different markers of inflammation (sICAM-1, E-selectin and IL-6) were predictive of all-cause mortality. In a
38
cohort of 606 ART-naïve HIV-infected women, CRP was predictive of maternal progression to AIDS, maternal mortality and child mortality. Table 1 summarizes studies that investigated predictive biomarkers in the natural course of HIV infection in untreated HIV-infected patients.
39 Table 1: Predictive biomarkers of HIV disease in the natural course of infection in untreated patients
Author N Study population Outcome Predicvtive markers
Fahey JL et al,
1990 395 Homosexual men initially free of AIDS Progression to AIDS -neopterin (HR: 6.1, CI:3.4 to 11.0) -B2-microglobulin (HR: 3.2, CI: 1.7 to 6.1) Hofmann B et al,
1990 50 HIV seroconverters CD4 cell count fall -B2-microglobulin increased levels correlated inversely with the CD4 cell count (p<0.001)
Zangerle R et al,
1998 47 Treated or non-treated with AZT monotherpy enrolled in 1991 CD4 cell count fall -neopterin -B2-microglobulin -sTNFR-75
increased levels correlated inversely with the CD4 cell count (r=-0.51, r=-0.41, r=-0.42 respectively; p< 0.01)
Ledergerber B et
al, 2000 169 Chronically infected patients enrolled between 1993-1994 Progression to AIDS -p24 antigen: increased p24 levels predicted progression to AIDS (p=0.043) Sipsas NV et al,
2003 64 HAART-naive patients enrolled between 1990-1993 AIDS-related death -sIL-2R -sICAM-1
increased levels associated with time to death (p=0.008 and 0.003, respectively)
Feldman JG et al,
2003 209 HIV-1-infected women enrolled between 1994-1995 All-cause mortality -CRP: predicted mortality (p< .01) after adjusting for age, BMI, serum albumin, CD4 cell count and HIV-1 RNA.
Mildvan D et al,
2005 152 Subsample of ACTG 116B/117, a randomized trial that compared clinical benefit of didanosine and zidovudine monotherapy
Progression to AIDS - neopterin
-endogenous interferon
elevated values were associated with disease progression (p=.0002, p=.0053 respectively) after adjustment for CD4+ cell count and HIV-1 RNA level
40
Drain PK et al,
2007 606 HAART-naïve HIV-infected women - Maternal progression to AIDS or mortality - Child mortality
-CRP
high maternal CRP was associated with progression to stage 4 or death (HR:2.26, CI:1.64 to 3.12) and greater risk of child mortality (HR: 3.03, CI: 1.85-4.96) Erikstrup C et al,
2008 198 ARV-naive HIV-1-infected individuals from the Mupfure Schistosomiasis and HIV Cohort in Zimbabwe
- Progression to AIDS
- All-cause mortality -p24 antigen 10-fold higher was associated with mortality (HR: 2.3, CI: 1.6 to 3.0) and progression to AIDS (HR: 2.0, CI: 1.3 to 3.3)