Deployment of an Algorithm for
Large-Scale Topology Discovery
Benoit Donnet, Philippe Raoult, Timur Friedman, Mark Crovella
Abstract— Topology discovery systems are starting to be in-troduced in the form of easily and widely deployed software. Unfortunately, the research community has not examined the problem of how to perform such measurements efficiently and in a network-friendly manner. This paper describes several contributions towards that end. These were first presented in the proceedings of ACM SIGMETRICS2005. We show that standard topology discovery methods (e.g., skitter) are quite inefficient, repeatedly probing the same interfaces. This is a concern, because when scaled up, such methods will generate so much traffic that they will begin to resemble DDoS attacks. We propose two metrics focusing on redundancy in probing and show that both are important. We also propose and evaluate Doubletree, an algorithm that strongly reduces redundancy while maintaining nearly the same level of node and link coverage. The key ideas are to exploit the tree-like structure of routes to and from a single point in order to guide when to stop probing, and to probe each path by starting near its midpoint. Following the SIGMETRICS
work, we implemented Doubletree, and deployed it in a real network environment. This paper describes that implementation, as well as preliminary favorable results.
Index Terms— network topology, traceroute, cooperative algo-rithms.
I. INTRODUCTION
Systems for active measurements in the internet are un-dergoing a radical shift. Whereas the present generation of systems operates on largely dedicated hosts, numbering be-tween 20 and 200, a new generation of easily downloadable measurement software means that infrastructures based on thousands of hosts could spring up literally overnight. Unless carefully controlled, these new systems have the potential to impose a heavy load on parts of the network that are being measured. They also have the potential to raise alarms, as their traffic can easily resemble a distributed denial of service (DDoS) attack. This paper examines the problem, and proposes and evaluates, through simulations and prototype deployment, an algorithm for controlling one of the most common forms of active measurement: traceroute [1].
There are a number of systems active today that aim to elicit the internet topology at the IP interface level. The most extensive tracing system, CAIDA’s skitter [2], uses 24 moni-tors, each targeting on the order of one million destinations. In the fashion of skitter, scamper [3] uses several monitors to traceroute IPv6 addresses. Some other well known systems, such as the RIPE NCC’s TTM service [4] and the NLANR
AMP [5], have larger numbers of monitors (between one- and
Messrs. Donnet and Friedman are with the Universit´e Pierre & Marie Curie, LiP6–CNRS Laboratory. Mr. Raoult is with N2NSoft. Mr. Crovella is with the Boston University Computer Science Department
two-hundred), and conduct traces in a full mesh, but avoid tracing to outside destinations. Scriptroute [6] is a system that allows an ordinary internet user to perform network measurements from several distributed vantage points. It pro-poses remote measurement execution on PlanetLab nodes [7], through a daemon that implements ping, traceroute, hop-by-hop bandwidth measurement, and a number of other utilities. Recent studies have shown that reliance upon a relatively small number of monitors to generate a graph of the internet can introduce unwanted biases. There is reason to question well known results, such as Faloutsos et al.’s finding [8] that the distribution of router degrees follows a power law. That work was based upon an internet topology collected from just twelve traceroute hosts by Pansiot and Grad [9]. Lakhina et al. [10] showed that, in simulations of a network in which the degree distribution does not at all follow a power law, traceroutes conducted from a small number of monitors can tend to induce a subgraph in which the node degree distribution does follow a power law. Clauset and Moore [11] have since demonstrated analytically that such a phenomenon is to be expected for the specific case of Erd¨os-R´enyi random graphs [12].
Removing spatial bias is not the only reason to employ measurement systems that use a larger number of monitors. With more monitors to probe the same space, each one can take a smaller portion and probe it more frequently. Network dynamics that might be missed by smaller systems can more readily be captured by the larger ones while keeping the workload per monitor constant.
The idea of releasing easily deployable measurement soft-ware is not new. To the best of our knowledge, the idea of incorporating a traceroute monitor into a screen saver was first discussed in a paper by Cheswick et al. [13] from the year 2000 (they attribute the suggestion to J¨org Nonnenmacher). Since that time, a number of measurement tools have been released to the public in the form of screen savers or daemons, such as Grenouille [14] or NETI@home [15]. In the summer of 2004, the first tracerouting tool of this type was made available: DIMES [16] conducts traceroutes and pings from, at the time of writing this paper, 8,700 agents distributed over five continents.
Given that large scale network mapping is emerging, con-templating such a measurement system demands attention to efficiency, in order to avoid generating undesirable network load. Save for our work, described here, and first presented at ACM SIGMETRICS 2005 [17], this issue has not been systematically tackled by the research community.
classic topology discovery systems involve duplicated effort. By classic topology discovery, we mean those systems, such as skitter, tracing from a small number of monitors to a large set of common destinations. We define two metrics to gauge duplicated effort in such systems: the quantity of measurements made by an individual monitor that replicate its own work (intra-monitor redundancy) and, the quantity of measurements made by multiple monitors that replicate each other’s work (inter-monitor redundancy).
Using skitter data from August 2004, we quantify both kinds of redundancy. We show that intra-monitor redundancy is high close to each monitor. This fact is not surprising given the tree-like structure (or cone, as Broido and claffy describe it [18]) of routes emanating from a single monitor. Further, with respect to inter-monitor redundancy, we find that most interfaces are visited by all monitors, especially when those interfaces are close to destinations. This latter form of redundancy is also potentially quite large, since it would be expected to grow linearly with the number of monitors in future large-scale measurement systems.
Our analysis of the nature of redundant probing suggests more efficient algorithms for topology discovery. In partic-ular, our second contribution is to propose and evaluate an algorithm called Doubletree. Doubletree takes advantage of the tree-like structure of routes, either emanating from a single source towards multiple destinations or converging from mul-tiple sources towards a single destination, to avoid duplication of effort. Unfortunately, general strategies for reducing these two kinds of redundancy are in conflict. On the one hand, intra-monitor redundancy is reduced by starting probing far from the monitor, and working backwards along the tree-like structure that is rooted at that monitor. Once an interface is encountered that has already been discovered by the monitor, probing stops. On the other hand, inter-monitor redundancy is reduced by probing forwards towards a destination until encountering a previously-seen interface. The inter-monitor redundancy reduction implies that monitors share information about what they have already discovered.
We show a means of balancing these conflicting strategies in Doubletree. In Doubletree, probing starts at a distance that is intermediate between monitor and destination. We demonstrate methods for choosing this distance, and we then evaluate the resulting performance of Doubletree. Despite the challenge inherent in reducing both forms of redundancy simultaneously, we show in simulations that probing via Doubletree can reduce measurement load by approximately 76% while maintaining interface and link coverage above 90%.
Based on our prior work, we have now deployed Doubletree in the internet. We describe its deployment on the Planet-Lab [7] testbed and evaluate the initial results. This evaluation is achieved by comparing results with a standard tracerouting system. We show that the simulations results are confirmed by the deployed prototype.
The remainder of this paper is organized as follows: Sec. II introduces the simulation setup and the data set we use; Sec. III describes the two metrics we consider and applies them on the skitter data; Sec. IV describes and evaluates the Doubletree algorithm based on the simulations; Sec. V
presents our implementation of Doubletree and evaluates it in a real environment; Sec. VI discusses related work; finally, Sec. VII concludes this paper and introduces directions for future work.
II. GENERALMETHODOLOGY
Our study in Sec. III and IV is based on skitter data from August 1st through 3rd, 2004. This data set was generated by 24 monitors located in the United States, Canada, the United Kingdom, France, Sweden, the Netherlands, Japan, and New Zealand. The monitors share a common destination set of 971,080 IPv4 addresses. Each monitor cycles through the destination set at its own rate, taking typically three days to complete a cycle. For the purpose of our studies, in order to reduce computing time to a manageable level, we worked from a limited destination set of 50,000, randomly chosen from the original set.
Visits to host and router interfaces are the metric by which we evaluate redundancy. We consider an interface to have been visited if its IP address appears at one of the hops in a traceroute. Therefore, probes that pass through a router interface and are routed onwards are not considered as visits to that interface. Only a probe that stops at a host or router, generating an ICMP message that bears the IP address of the interface, constitutes a visit. Furthermore, we maintain our metric at the interface level. Though it would be of interest to calculate the load at the host and router level, we make no attempt to disambiguate interfaces in order to obtain router-level information. We believe that the load on individual interfaces is a useful measure. As Broido and claffy note [18], “interfaces are individual devices, with their own individual processors, memory, buses, and failure modes. It is reasonable to view them as nodes with their own connections.”
How do we account for skitter visits to router and host interfaces? Like many standard traceroute implementations, skitter sends three probe packets for each hop count. An IP address appears thus in a traceroute result if the interface replies with an ICMP message, at least, to one of the three probes sent (but it may also respond two or three times). If none of the three probes are returned, the hop is recorded as non-responding.
Even if an IP address is returned for a given hop count, it might not be valid. Due to the presence of poorly configured routers along traceroute paths, skitter often records anomalies such as private IP addresses that are not globally routable. We account for invalid hops as if they were non-responding hops. The addresses that we consider as invalid are a subset of the special-use IPv4 addresses described in RFC 3330 [19], as we detail in our SIGMETRICS paper [17, Sec. 2.1]. Special addresses cover around 3% of the entire considered address set.
III. METRICS TOEVALUATETOPOLOGYDISCOVERY TOOLS
This section introduces two metrics that allow one to evaluate a distributed tracerouting system.
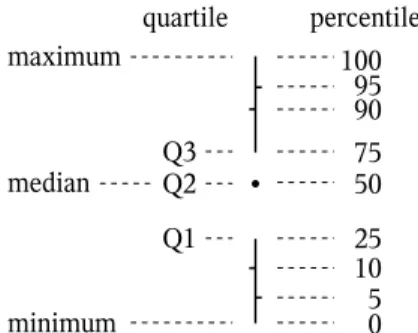
Fig. 1. Quantiles key
We evaluate such a system by considering the redundancy (i.e., the duplication of effort) at two levels. One is the individ-ual level of a single monitor, considered in isolation from the rest of the system. This intra-monitor redundancy is measured by the number of times the same monitor visits an interface. The other, global, level considers the system as an ensemble of monitors. This inter-monitor redundancy is measured by the number of monitors that visit a given interface, counting only once each monitor that has non-zero intra-monitor redundancy for that interface. By separating the two levels, we separate the problem of redundancy into two problems that can be treated somewhat separately. Each monitor can act on its own to reduce its intra-monitor redundancy, but cooperation between monitors is required to reduce inter-monitor redundancy.
In the following sections, we plot interface redundancy distributions. Since these distributions are generally skewed, quantile plots give us a better sense of the data than would plots of the mean and variance. There being several ways to calculate quantiles, we employ the method described by Jain [20, p. 194], which is: rounding to the nearest integer value to obtain the index of the element in question, and using the lower integer if the quantile falls exactly halfway between two integers.
Fig. 1 provides a key to reading the quantile plots found in Figs. 2 and 3 and figures found later in the paper. A dot marks the median (the 2nd quartile, or 50th percentile). The vertical
line below the dot delineates the range from the minimum to the 1st quartile, and leaves a space from the 1st to the 2nd
quartile. The space above the dot runs from the 2nd to the 3rd
quartile, and the line above that extends from the 3rdquartile
to the maximum. Small tick bars to either side of the lines mark some additional percentiles: bars to the left for the 10th and 90th, and bars to the right for the 5th and 95th.
In the figures, each quantile plot sits directly above an accompanying bar chart that indicates the quantity of data upon which the quantiles were based. For each hop count, the bar chart displays the number of interfaces at that distance. For these bar charts, a log scale is used on the vertical axis. This allows us to identify quantiles that are based upon very few interfaces (fewer than twenty, for instance), and so for which the values risk being somewhat arbitrary.
In addition, each plot has a separate bar to the right, labeled “all”, that shows the quantiles for all interfaces taken together (upper part of the plot) and the number of discovered interfaces
10
610
410
210
0all
35
30
25
20
15
10
5
0
nb interfaces
hop
10
610
510
410
310
210
110
0all
redundancy
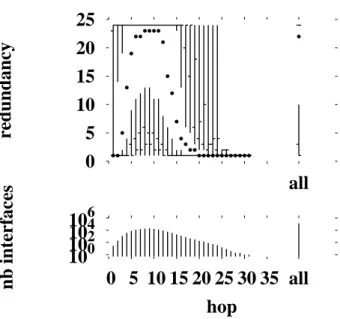
Fig. 2. skitter intra-monitor redundancy for thechampagnemonitor
(lower part of the plot).
A. Intra-Monitor Redundancy
Intra-monitor redundancy occurs in the context of the tree-like graph that is generated when all traceroutes originate at a single point. Since there are fewer interfaces closer to the monitor, those interfaces will tend to be visited more frequently. In the extreme case, if there is a single gateway router between the monitor and the rest of the internet, the single IP address of the outgoing interface belonging to that router should show up in every one of the traceroutes.
We measure intra-monitor redundancy by considering all traceroutes from the monitor to the shared destinations, whether there be problems with a traceroute such as illegal addresses, or not.
Having calculated the intra-monitor redundancy for each interface, we organize the results by the distance of the interfaces from the monitor. We measure distance by hop count. Since the same interface can appear at a number of different hop counts from a monitor, for instance if routes change between traceroutes, we arbitrarily attribute to each interface the hop count at which it was first visited. This process yields, for each hop count, a set of interfaces that we sort by number of visits. We then plot, hop by hop, the redundancy distribution for interfaces at each hop count.
Fig. 2 shows the intra-monitor redundancy metric applied to the champagnemonitor. Plots for other monitors can be found in our prior publications [17], [21].
Looking first at the histogram for interface counts (lower half of the plot), we see that these data are consistent with distributions typically seen in such cases. The histogram represents the 92,354 unique IP addresses discovered by that monitor. This total is shown as a separate bar to the right of the histogram, labeled “all”. The interface distances are distributed with a mean at 17 hops corresponding to a peak of 9,135 interfaces that are visited at that distance.
The quantile plot (upper part of the plot) shows the nature of the intra-monitor redundancy problem. Looking first to the summary bar at the right hand of the chart, we can see that the distributions are highly skewed. The lower quantile and the median interface have a redundancy of one, as evidenced by the lack of a gap between the dot and the line representing the bottom quarter of values. However, for a very small portion of the interfaces there is a very high redundancy. The maximum redundancy is 150,000 — equal to the number of destinations multiplied by the three probes sent at each hop.
Looking at how the redundancy varies by distance, we see that the problem is worse the closer one is to the monitor. This is what we expect given the tree-like structure of routing from a monitor, but here we see how serious the phenomenon is from a quantitative standpoint. For the first two hops, the median redundancy is 150,000. A look at the histograms shows that there are very few interfaces at these distances.
Beyond three hops, the median redundancy drops rapidly. By the eleventh hop, the median is below ten. However, the distributions remain highly skewed. Even fifteen hops out, some interfaces experience a redundancy on the order of several hundred visits. With small variations, these patterns are repeated for each of the monitors.
From the point of view of planning a measurement system, the extreme values are the most worrisome. It is clear that there is significant duplicated effort, and it is especially concentrated in selected areas. The problem is most severe on the first few interfaces, but even interfaces many hops out receive hundreds or thousands of repeat visits. Beyond the danger of triggering alarms, there is a simple question of measurement efficiency. Resources devoted to reprobing the same interfaces would be better saved, or reallocated to more fruitful probing tasks.
Overall, we also found that 86% of the probes are redundant, in the sense that they visit interfaces that the monitor has already discovered.
B. Inter-Monitor Redundancy
Inter-monitor redundancy occurs when multiple monitors visit the same interface. The degree of such redundancy is of keen interest to us when we envisage increasing the number of monitors by several orders of magnitude.
We calculate the inter-monitor redundancy for each interface by counting the number of monitors that have visited it. A monitor can be counted at most once towards an interface’s inter-monitor redundancy, even if it has visited that interface multiple times. For a given interface, the redundancy is calcu-lated just once with respect to the entirety of the monitors: it does not vary from monitor to monitor as does intra-monitor redundancy. However, what does vary depending upon the monitor is whether the particular interface is seen, and at what distance. In order to attribute a single distance to an interface, a distance that does not depend upon the perspective of a single monitor but that nonetheless has meaning when examining the effects of distance on redundancy, we attribute the minimum distance at which an interface has been seen among all the monitors.
Fig. 3 shows the inter-monitor redundancy metric applied to the 24 skitter monitors.
10
610
410
210
0all
35
30
25
20
15
10
5
0
nb interfaces
hop
0
5
10
15
20
25
all
redundancy
Fig. 3. skitter inter-monitor redundancy
The distribution of interfaces by hop count differs from the intra-monitor case due to the difference in how we account for distances. The mean is closer to the traceroute source (9 hops), corresponding to a peak of 19,742 interfaces that are visited at that distance.
The redundancy distribution also has a very different aspect. Considering, first, the redundancy over all of the interfaces (at the far right of the plot), we see that the median interface is visited by nearly all 24 monitors, which is a subject of great concern. The distribution is also skewed, though the effect is less dramatic. Keep in mind that the vertical axis here is on a linear scale, with only 24 possible values.
We also see a very different distribution by distance. In-terfaces that are very close in to a monitor, at one or two hops, have a median inter-monitor redundancy of one. The same is true of interfaces that are far from all monitors, at distances over 20, though there are very few of these. What is especially notable is that interfaces at intermediate distances (5 to 13) tend to be visited by almost all of the monitors. Though their distances are in the middle of the distribution, this does not mean that the interfaces themselves are in the middle of the network. Many of these interfaces are in fact destinations. Recall that every destination is targeted by every host.
IV. DOUBLETREE
In this section, we present Doubletree, our method for probing the network in a friendly manner while discovering nearly all the interfaces and links that a classic tracerouting approach would discover.
A. Algorithm
Doubletree is the key component of a coordinated probing system that significantly reduces both kinds of redundancy (i.e. inter- and intra-monitor) while discovering nearly the
(a) Monitor-rooted
(b) Destination-rooted Fig. 4. Tree-like routing structures
same set of nodes and links. It assumes that routes in the internet have a tree-like structures, as shown in Fig. 4. Routes leading out from a monitor towards multiple destinations form a tree rooted at the monitor (see Fig. 4(a)). Similarly, routes converging towards a destination from multiple monitors form also a tree, but rooted at the destination (see Fig. 4(b)). A monitor probes hop by hop so long as it encounters previously unknown interfaces. However, once it encounters a known interface, it stops, assuming that it has touched a tree and the rest of the path to the root is also known. Using these trees suggests two different probing schemes: backwards (based on a monitor-rooted tree) and forwards (based on a destination-rooted tree).
It is not necessary for monitors to maintain information about the whole tree structures. Instead, both backwards and forwards probing use data structures, called stop sets. The one for backwards probing, called the local stop set, consists of all interfaces already seen by that monitor. Forwards probing uses the global stop set of (interface, destination) pairs
accumulated from all monitors. A pair enters the stop set if a monitor visited the interface while sending probes with the corresponding destination address.
A monitor that implements Doubletree starts probing for a destination at some number of hopsh from itself. It will probe
forwards ath + 1, h + 2, etc., adding to the global stop set at
each hop, until it encounters either the destination or a member of the global stop set. It will then probe backwards at h − 1, h − 2, etc., adding to both the local and global stop sets at
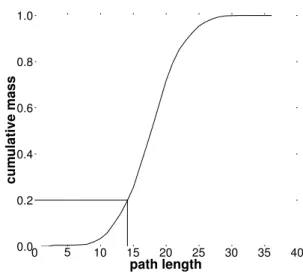
Fig. 5. Cumulative mass plot of path lengths from skitter monitor
champagne
each hop, until it either has reached a distance of one hop or it encounters a member of the local stop set. It then proceeds to probe for the next destination. When it has completed probing for all destinations, the global stop set is communicated to the next monitor. A formal description of the Doubletree algorithm is presented in our SIGMETRICS paper [17, Sec. 3.1].
B. Tuning Parameterp
Doubletree has one tunable parameter. The choice of initial probing distance h is crucial. Too close, and intra-monitor
redundancy will approach the high levels seen by classic forwards probing techniques. Too far, and there will be high inter-monitor redundancy on destinations. The choice must be guided primarily by this latter consideration to avoid having probing look like a DDoS attack.
While Doubletree largely limits redundancy on destinations once hop-by-hop probing is underway, its global stop set cannot prevent the initial probe from reaching a destination if
h is set too high. Therefore, we recommend that each monitor
set its own value for h in terms of the probability p that a
probe senth hops towards a randomly selected destination will
actually hit that destination. Fig. 5 shows the cumulative mass function for this probability for skitter monitorchampagne. If we consider as reasonable a 0.2 probability of hitting a
responding destination on the first probe, champagnemust choose h 6 14. The shape of this curve is very similar for
each of the 24 skitter monitors, but the horizontal position of the curve can vary by a number of hops from monitor to monitor.
In order to test the effects of the parameter p on both
redundancy and coverage, we implement Doubletree in a simulator. We examine the following values forp: between 0
(i.e., forwards probing only) and 0.2, we incrementp in steps
of 0.01. From 0.2 to 1 (i.e., backwards probing in all cases
when the destination replies to the first probe), we incrementp
close to 0 allows us to trace the greater variation of behavior in this area.
To validate our results, we run the simulator using the skitter data from early August 2004. We assume that Doubletree is running on the skitter monitors, during the same period of time that the skitter data represents, and implementing the same baseline probing technique described in Sec. II, of probing up to three times at a given hop distance. The difference in the application of Doubletree lies in the order in which Doubletree probes the hops, and the application of Doubletree’s stopping rules.
A single experiment uses traceroutes from all 24 monitors to a common set of 50,000 destinations chosen at random. Each data point represents the mean value over fifteen runs of the experiment, each run using a different set of 50,000 destinations randomly generated. No destination is used more than once over the fifteen runs. We determine 95% confidence intervals for the mean based, since the sample size is rela-tively small, on the Studentt distribution. These intervals are
typically, though not in all cases, too tight to appear on the plots.
Doubletree requires communication of the global stop set from one monitor to another. We therefore choose a random order for the monitors and simulate the running of Doubletree on each one in turn. Each monitor adds to the global set the
(interface, destination) pairs that it encounters, and passes the
augmented set to the subsequent monitor. This is a simplified scenario compared to the way in which a fully operational co-operative topology discovery protocol might function, which is to say with all of the monitors probing and communicating in parallel (see Sec. V). However, we feel that the scenario allows greater realism in the study of intra-monitor redundancy. The typical monitor in a large, highly distributed infrastructure will begin its probing in a situation in which much of the topology has already been discovered by other monitors. The closest we can get to simulating the experience of such a monitor is by studying what happens to the last in our random sequence of monitors. All Doubletree intra-monitor redundancy results are for the last monitor in the sequence. (In contrast, the inter-monitor redundancy for one inter-monitor is not dependent on what happens at other monitors.)
Since the value p has a direct effect on the redundancy
of destination interfaces, we initially look at the effect of p
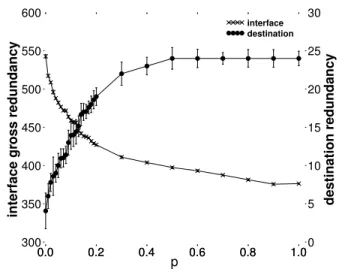
separately on destination redundancy and on router interface redundancy. We are most concerned about destination redun-dancy because of its tendency to appear like a DDoS attack, and we are concerned in particular with the inter-monitor redundancy on these destinations, because a variety of sources is a prime indicator of such an attack. The right-side vertical axis of Fig. 6 displays destination redundancy. With regards router interface redundancy, which is displayed on the left-side vertical axis, we are concerned with overall load, and so we consider a combined intra- and inter-monitor redundancy measure that we call gross redundancy, defined as the total number of visits to an interface by all monitors. For both destinations and router interfaces, we are concerned with the extreme values, so we consider the 95th percentile.
We see that the inter-monitor redundancy increases with
Fig. 6. Doubletree redundancy, 95thpercentile. Inter-monitor redundancy on destinations, gross redundancy on router interfaces
p. This is expected by definition of p. Values increase until p = 0.5, at which point they plateau at 24. The point p = 0.5
is, by definition, the point at which the probe sent to a distanceh hits a destination in 50% of the cases. Doubletree
allows a reduction in 95th percentile inter-monitor redundancy
when compared to classic probing for lower values of p.
The maximum reduction is 84% whenp = 0, implying pure
forwards probing.
As opposed to destination redundancy, the 95th percentile
gross router interface redundancy decreases with p. The 95th
percentile for the internal interface gross redundancy using the classic approach is 1,340. Doubletree thus allows a reduction between 59.6% (p = 0) and 72.6% (p = 1).
This preliminary analysis suggests that Doubletree should employ a low value for p, certainly below 0.5, in order to
reduce inter-monitor redundancy on destinations. Furthermore, the value must not be too low, in order to avoid a negative impact on router interfaces.
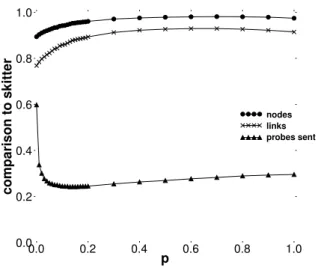
Fig. 7 compares Doubletree to skitter in terms of coverage accuracy (nodes and links) and quantity of probes sent. On the horizontal axis, we vary the probabilityp. On the vertical axis,
we show the performance of Doubletree. A value of 1.0 would mean that Doubletree performs exactly the same as skitter.
Considering first the coverage (the two upper curves), we see that it increases with p until reaching the maximum
coverage approximately when p = 0.7: Doubletree discovers
92.9% of links and 98.1% of nodes. The minimum coverage appears when p = 0: 76.8% of links and 89.3% of nodes.
However, link coverage grows rapidly forp values between 0
and0.4. After that point, a kind of plateau is reached, before
a small decrease. These two curves suggest that a Doubletree monitor should employ a high value for p, certainly around 0.7 in order to maximize its coverage accuracy.
Regarding now the quantity of probes sent (the lower curve), we can see that Doubletree allows a reduction between 40.3%
(p = 0) and 75.8% (p = 0.13). As opposed to the coverage,
Fig. 7. Doubletree in comparison to skitter regarding the level of coverage and the probes sent
Fig. 8. Doubletree in comparison to skitter regarding the communication cost
zero value forp.
Fig. 8 compares Doubletree and skitter regarding the com-munication cost. By comcom-munication cost, we mean the amount of data sent by the system in the network. It includes the probes sent for the traceroute (probe cost) as well as the data exchanged by monitors (stop set cost). On the horizontal axis, we vary the probabilityp. The vertical axis gives the quantity
of megabytes sent into the network.
The vertical line indicates the quantity of megabytes sent by all skitter monitors. They only send probes into the network. For Doubletree, each bar is divided into two parts: the lower part (in gray) shows the probe cost (in MB) and the upper part (in black) the stop set cost (in MB). The sum of both parts gives the total communication cost required by Doubletree. We do not take into account the cost of data repatriation to a centralized server after probing. This cost is incurred by both skitter and Doubletree, and the comparison would favor
Doubletree, which collects less data.
To evaluate the probe cost, we give a weight to each probe that corresponds to the sum of the IP and UDP header lengths. We multiply this weight by the number of probes sent into the network by each system. Fig. 8 indicates that skitter has a probe cost of 1,667.37 MB. For Doubletree, the probe cost oscillates between 996.49 MB (p = 0) and 403.25 MB (p = 13). Using Doubletree allows one to have a probe cost between
40.3% and 75.8% less than skitter.
Concerning the stop set cost, we consider the global stop set as a list of bit strings, each string being 64 bits (two IP addresses) long. We do not consider any possible compression of the global stop set, such as that suggested by authors of this paper [22], which would further favor Doubletree. In Fig. 8, we see that the stop set cost is negligible compared to the probe cost. It oscillates between 70.33 MB (p = 0) and 12.51
MB (p = 0.5).
When putting both costs together, we see that the total oscillates for Doubletree between 1,066.82 MB (p = 0) and
418.03 MB (p = 0.15). The reduction compared to skitter is
between 46.02% and 74.93%.
Therefore, although Doubletree requires communication be-tween monitors, it does not increase the overall communication cost, and, rather, strongly reduces it.
Based on Figs. 6, 7 and 8, we suggest choosing ap value
belonging to the range [0.05, 0.2], which allows a compro-mise between coverage accuracy, redundancy reduction, and communication cost. In this range, coverage is relatively high, redundancy can be strongly reduced, and communication costs remain relatively low.
Further details, specifically with respect to the intra- and inter-monitor redundancy metrics (see Sec. III) for p = 0.05,
are to be found in our SIGMETRICS paper [17, Sec. 3.3]. V. DOUBLETREEPROTOTYPE
This section describes the deployed version of Doubletree. The Java code for this prototype is freely available online [23]. This section also describes the results of initial runs of Doubletree in a real environment. We compare its performance to a classic probing system modeled on skitter.
A. Prototype Design
The simulations described earlier in this paper were based on a simple probing system: each monitor in turn works through the destination list, adds to the global stop set the
(interface, destination) pairs that it encounters, and passes
the augmented set to the subsequent monitor.
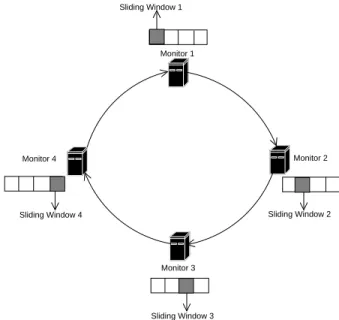
This simple scenario is not suitable in practice: it is too slow, as an iterative approach allows only one monitor to probe the network at a given time. We want all the monitors probing in parallel. However, how would one manage the global stop set if it were being updated by all the monitors at the same time? An easy way to parallelize is to divide the destination list into several sliding windows. At a given time, a given monitor focuses on its own window, as shown in Fig. 9. There is no collision between monitors, in the sense that each one is filling in its own part of the global stop set. The entire system
Monitor 1 Monitor 3 Monitor 2 Monitor 4 Sliding Window 1 Sliding Window 2 Sliding Window 3 Sliding Window 4
Fig. 9. Doubletree with sliding windows
countsm different sliding windows, where m is the number of
Doubletree monitors. If there aren destinations, each window
is of size w = n/m.
A sliding window mechanism requires us to decide on a step size by which to advance the window. We could use a step size of a single destination. After probing that destination, a Doubletree monitor sends a small set of pairs corresponding to that destination to the next monitor, as its contribution to the global stop set. It advances its window past this destination, and proceeds to the next destination. Clearly, though, a step size of one will be costly in terms of communication. Packet headers will not be amortized over a large payload, and the payload itself, consisting of a small set, will not be as susceptible to compression as a larger set would be.
On the other hand, a step size equal to the size of the window itself poses other risks. Supposing a monitor has completed probing each destination in its window, and has sent the resulting subset of the global stop set on to the following monitor. It then might be in a situation where it must wait for the prior monitor to terminate its window before it can do any further useful work.
A compromise must be reached, between lowering commu-nications costs and continuously supplying each monitor with useful work. This implies a step size somewhere between 1 and
w. For our implementation of Doubletree, we have arbitrarily
chosen a step size ofw/5. Unfortunately, this did not eliminate
blocking situations. When the system was run, one Doubletree monitor waited a cumulative 25 minutes, over the five hours total experiment time, without useful work to do. Tuning the step size parameter is a subject for further evaluation.
Interested readers might find further information about our prototype in a technical report [24].
B. Experiment Methodology
We deployed the Doubletree prototype on the PlanetLab [7] testbed.
As described earlier in this paper, security concerns are paramount in our approach to active probing. It is important to not trigger alarms inside the network with our probes. It is also important to avoid burdening the network and destination hosts. It follows from this that the deployment of a cooperative active probing tool must be done carefully, proceeding step by step, from an initial small size, up to larger scales. Note that this behavior is strongly recommended [25, Pg. 5] by PlanetLab.
Our initial prototype was therefore deployed to only m = 5 PlanetLab nodes. We selected five nodes based on their
relatively high stability (i.e., remaining up and connected), and their relatively low load. By coincidence, all five nodes are located in Europe: France, England, Denmark, Spain and Germany. In future, we will wish to deploy with greater geographic diversity. However, even with this small number of stable and lightly-loaded nodes, we found it difficult to run even a single experiment to completion. Node failure in the midst of an experiment was common, and stable but more heavily loaded nodes lead to prohibitively lengthy run times. Over the course of two weeks, we succeeded in bringing only two runs to completion.
For comparison to Doubletree, we implemented a classic tracerouting system, based on skitter, labeled skitter-like in the rest of the paper.
Both the Doubletree module and the skitter-like module send three probes for each TTL value, as standard traceroute does.
The destination list consists of n = 500 PlanetLab nodes.
Restricting ourselves to PlanetLab nodes was motivated by security concerns. By avoiding tracing outside the PlanetLab network, we avoid disturbing end-systems that do not welcome probe traffic. None of the five PlanetLab monitors belongs to the destination list. This was done to remain consistent with skitter’s approach, which is to probe outwards to a set of destinations that does not include the monitors themselves. (In future, we would want to probe between monitors in addition to this outwards probing.) The window size of w = n/m
consists of 100 destinations. The step size, ofw/5, is 20.
Some routers along the paths may be poorly configured and reply with a not well-formatted ICMP message. We choose to record these routers as non-responding. Among the whole set of probes sent (considering the Doubletree and skitter-like modules), only 0.00101% (first run) and 0.00096% (the second run) of replies came back with formatting problems.
The application was run twice on the PlanetLab nodes between Dec. 26th and Dec. 31st, 2005. For the Doubletree module, we use ap value of 0.05.
The experiment stops when both modules have probed all the destinations. Doubletree, as it sends fewer probes, finished the first.
C. Experiment Results
During our experiment a total of 186,936 probes were sent for the first run and 186,663 for the second. As shown in Table I, the Doubletree module reduces the probe traffic by 67.91% for run 1 and 67.87% for run 2. This is less good than
run 1 141,525 45,411 run 2 141,273 45,390
TABLE I QUANTITY OF PROBES SENT
|S| |S \ D| |D| |D \ S| |S ∩ D| run 1 nodes 2.209 110 2.141 42 2.099 links 2.799 495 2.496 192 2.304 run 2 nodes 2.228 119 2.149 40 2.109 links 2.825 504 2.521 200 2.321 TABLE II
NODES AND LINKS DISCOVERED
in our simulations (see Sec. IV-B) where, for the samep value,
the reduction was on the order of 74.19%. However, the results are remarkably close for an experiment that is conducted at a much different scale than the simulations (one fifth the number of monitors, and one hundredth the number of destinations).
The principal measure of performance for a probing system is the extent to which it discovers what it should. Unfortu-nately, without an exact knowledge of the complete topology (if such a thing can be said to exist), it is difficult to evaluate that performance. However, we can compare the modules to each other.
LetS be the set of information gathered by the skitter-like
module. Similarly, letD be the set of information gathered by
the Doubletree module. By information, we mean nodes (i.e. interfaces) or links. Table II shows the cardinality of these sets, their intersections, and their differences.
Looking first at the cardinality of the sets (columns |S| and |D|), we find that the skitter-like module discovers more links
and nodes than Doubletree. This was already suggested by our simulations where we showed that Doubletree was unable to reach the same coverage level as skitter (see Sec. IV-B).
Considering now the intersection of both sets (column
|S ∩ D|), we see that the modules discover much information
in common. Compared to the skitter-like module, Doubletree is able to discover 95.02% (94.65% for the second run) of nodes and 82.31% (82.15% for the second run) of links. This confirms our simulations in which, for the same p value,
Doubletree was able to discover 92.43% of the nodes and 82.31% of the links.
A look at the set differences (columns |S \ D| and |D \ S|), shows that both the skitter-like module and Doubletree
discover information that is not discovered by the other. Doubletree’s unique discoveries are approximately five times fewer than the skitter-like monitor’s. But they are not zero, as they were in the simulation. Only an experiment in the real world could reveal the extent to which Doubletree would discover things that skitter did not.
Unique discoveries can be explained by three related obser-vations. First, some of the skitter-like monitor’s unique discov-eries are attributable to the the application of the stop set. This prevents a Doubletree monitor from exploring some paths that have changed (due, for instance, to routing dynamics or load
balancing). When a Doubletree monitor encounters either an
interface (local stop set) or an (interface, destination) pair
(global stop set), it assumes that the rest of the path to the root of the tree is already known and does not change. In practice, paths are dynamic.
Second, as shown in Table I, the skitter-like module sends many more probes than Doubletree. When considering this difference in scale, combining with route dynamics, it is easy to understand that the skitter-like module has the potential to discover more nodes and links.
Third, if we consider that the experiment terminates at time
T , then Doubletree ends probing at approximately time T /4.
As the skitter-like module probes the network over a longer time frame than Doubletree, it is normal that it is able to capture network changes occurring during this additional time. How would Doubletree behave in an experiment in which the skitter-like and Doubletree modules send exactly the same quantity of probes over the same time frame? That is, allowing Doubletree to recycle through its destination list after it has completed the first round. Would Doubletree discover the same number of nodes and links as the skitter-like module; more; or fewer? These questions are the subject of ongoing work.
VI. RELATEDWORK
This paper addresses an area, efficient measurement of the overall internet topology, in which very little related work has been done. This is in contrast to the number of papers on effi-cient monitoring of networks that are in a single administrative domain (see for instance, Bejerano and Rastogi’s work [26]). The two problems are extremely different. An administrator knows their entire network topology in advance, and can freely choose where to place their monitors. Neither of these assumptions hold for measuring the internet with @home-style monitors. Since the existing literature is based upon these assumptions, we need to look elsewhere for solutions.
Some prior work has addressed strategies for tracing routes in the internet. Govindan and Tangmunarunkit [27] employ backwards probing with a stopping rule in the Mercator system, in order to reduce intra-monitor redundancy. However, no results have been published regarding the efficacy of this approach. Nor have the effects on inter-monitor redundancy been considered, or the tension between reducing the two types of redundancy (for instance, Mercator tries to start probing at the destination, or as close to it as possible, which, as we have seen, is highly deleterious to inter-monitor redundancy).
Rocketfuel [28] is a tool for mapping router-level ISP
topolo-gies. For reducing the number of measurements required, Rocketfuel makes use of ingress reduction and egress
reduc-tion heuristics. Ingress reducreduc-tion is based on the observareduc-tion
that probes to a destination from multiple monitors may con-verge and enter a target ISP at the same node. Egress reduction is based on the observation that probes to multiple destinations may leave the target ISP at the same node. The ingress and egress reduction heuristics are similar to Doubletree’s forwards and backwards stopping rules. However, Rocketfuel applies its heuristics exclusively at the boundaries of ISPs, and so it does not take advantage of the redundancy reductions that might be
found by paths that converge within an ISP. Doubletree reduces redundancy starting at the point of convergence, wherever that might be found. Nor does Rocketfuel employ backwards probing; all of its probes are presumably forwards. In contrast, Doubletree employs both, and our work explicitly examines the tradeoffs between the two types of probing, in terms of coverage and overhead. Furthermore, the Rocketfuel work assumes a centralized controller, and so it does not consider how the information regarding where to stop probing could be efficiently encoded for exchange between monitors. In Dou-bletree, this is done through the global stop set for forwards probing, encoded as a series of(interface, destination) pairs. Scriptroute [6]’s Reverse Path Tree (RPT) discovery tool is
used to avoid overloading the network when multiple monitors probe towards a given destination. A reverse path tree is a destination-rooted tree, of the sort that we describe in this paper, i.e., a tree formed by routes converging from a set of monitors on a given destination. The RPT tool avoids retracing paths by embedded a list of previously observed IP addresses in the script that directs the measurements. A given monitor stops probing when it reaches a part of the tree that has already been mapped. Scriptroute thus can avoid inter-monitor redundancy, as Doubletree does. However, as with Rocketfuel, Scriptroute assumes a centralized controller, and so does not consider how stopping information might be efficiently coded for sharing between monitors. Nor does Scriptroute consider monitor-rooted trees, or the possibility of backwards probing in order to avoid intra-monitor redundancy. Without the possibility of backwards probing, Scriptroute is not able to trade off intra-monitor redundancy against inter-monitor redundancy. Doubletree allows this tradeoff, and evaluates it. A number of papers have examined the tradeoffs involved in varying the number of monitors used for topological explo-ration of the internet. Barford et al. [29] found a low marginal utility for added monitors for the purpose of discovering certain network characteristics, implying that a small number of monitors should be sufficient. However, Lakhina et al. [10] found that the marginal utility depends upon the parameters under study, and that small numbers of monitors could lead to biased estimates. These biases have been further studied by Clauset and Moore [30], Petermann and De Los Rios [31], and Dall’Asta et al. [32]. Guillaume and Latapy [33] have extended these studies to include the tradeoff between the number of monitors and the number of destinations. This more recent work implies that there may be real benefit to increasing the number of monitors, though in the absence of knowledge of the true topology of the internet, the scale of such benefit remains to be determined.
VII. CONCLUSION
In this paper, we quantify the amount of redundancy in classic internet topology discovery approaches by taking into account the perspective of a single monitor (intra-monitor) and that of an entire system (inter-monitor). In the intra-monitor case, we find that interfaces close to the intra-monitor suffer from a high number of repeat visits. Concerning inter-monitor redundancy, we see that a large portion of interfaces are visited by all monitors.
In order to scale up classic approaches such as skitter, we have proposed Doubletree, an algorithm that significantly reduces the duplication of effort while discovering nearly the same set of nodes and links. Doubletree simultaneously meets the conflicting demands of reducing intra- and inter-monitor redundancy. We describe how to tune a single parameter for Doubletree in order to obtain an a trade-off between redundancy and coverage, and we find operating points at which it is possible to strongly reduce one while maintaining the other.
For a range of p values, Doubletree is able to reduce
measurement load by approximately 76% while maintaining interface and link coverage above 90%.
We also describe a prototype Doubletree implementation and present preliminary results from two runs on the PlanetLab testbed. These initial results are consistent with the perfor-mance expectations formed by the simulation results. Further experiments are necessary, though difficult to carry out.
This paper represents the first step towards a highly dis-tributed tracerouting system. Elsewhere [22], we have pro-posed extensions to this work: reducing the communication cost of sharing the global stop set through the use of Bloom filters, and reducing the load on destinations via techniques we call capping and clustering. In other work [34] we evaluate an address prefix based stopping rule.
We show in this paper that Doubletree can save time by avoiding duplication of effort between monitors. Therefore, Doubletree should be able to probe the network more fre-quently. We believe that this could make it possible to better capture the network dynamics that result from routing changes and load balancing. Future work might reveal the extent to which Doubletree is helpful in capturing such network changes.
We are also working on a BGP-guided topology discovery tool. We think that a topology discovery algorithm at the IP level may fruitfully make use of information from higher levels, such as the AS-level.
Finally, we plan to work on an overlay or peer-to-peer system for managing the interaction between Doubletree mon-itors.
ACKNOWLEDGEMENTS
Without the skitter data provided by kc claffy and her team at CAIDA, the simulations would not have been possible. In addition, part of Mr. Donnet’s work was supported by an internship at CAIDA, under the direction of Brad Huffaker. Mr. Donnet’s work was partially funded by the network of excellence E-NEXT through the SATIN grant. Marc Giusti and his team at the Centre de Calcul MEDICIS, Laboratoire STIX, Ecole Polytechnique, offered us access to their computing cluster, allowing faster and easier simulations. Finally, we are indebted to our colleagues in the Networks and Per-formance Analysis group at LiP6, headed by Serge Fdida, and to our partners in the traceroute@home project, Jos´e Ignacio Alvarez-Hamelin, Alain Barrat, Matthieu Latapy, and Alessandro Vespignani, for their support and advice.
REFERENCES
[1] V. Jacobsen et al., “traceroute,” UNIX,” man page, 1989, see source code: ftp://ftp.ee.lbl.gov/traceroute.tar.gz, and NANOG traceroute source code: ftp://ftp.login.com/pub/software/traceroute/.
[2] B. Huffaker, D. Plummer, D. Moore, and k. claffy, “Topology discovery by active probing,” in Proc. Symposium on Applications and the Internet, Jan. 2002.
[3] WAND Network Research Group, “IPv6 scamper,” see http://www. wand.net.nz/∼mjl12/ipv6-scamper/.
[4] F. Georgatos, F. Gruber, D. Karrenberg, M. Santcroos, A. Susanj, H. Uijterwaal, and R. Wilhelm, “Providing active measurements as a regular service for ISPs,” in Proc. Passive and Active Measurement (PAM) Workshop, 2001, see http://www.ripe.net/test-traffic/.
[5] A. McGregor, H.-W. Braun, and J. Brown, “The NLANR network analysis infrastructure,” IEEE Communications Magazine, vol. 38, no. 5, pp. 122–128, May 2000, see http://watt.nlanr.net/.
[6] N. Spring, D. Wetherall, and T. Anderson, “Scriptroute: A public internet measurement facility,” in Proc. 4th USENIX Symposium on Internet Technologies and Systems, Mar. 2003, see http://www.cs.washington. edu/research/networking/scriptroute/.
[7] PlanetLab project. See http://www.planet-lab.org.
[8] M. Faloutsos, P. Faloutsos, and C. Faloutsos, “On power-law relation-ships of the internet topology,” in Proc. ACM SIGCOMM, Sept. 1999. [9] J. J. Pansiot and D. Grad, “On routes and multicast trees in the internet,”
ACM SIGCOMM Computer Communication Review, vol. 28, no. 1, pp. 41–50, Jan. 1998.
[10] A. Lakhina, J. Byers, M. Crovella, and P. Xie, “Sampling biases in IP topology measurements,” in Proc. IEEE INFOCOM, Apr. 2003. [11] A. Clauset and C. Moore, “Traceroute sampling makes random graphs
appear to have power law degree distributions,” arXiv, cond-mat 0312674, Feb. 2004.
[12] P. Erd¨os and A. R´enyi, “On the evolution of random graphs,” Publ. Math. Inst. Hung. Acad. Sci., vol. 5, pp. 17–61, 1960.
[13] B. Cheswick, H. Burch, and S. Branigan, “Mapping and visualizing the internet,” in Proc. USENIX Annual Technical Conference, Jun. 2000. [14] A. Schmitt et al., “La m´et´eo du net,” ongoing service, see http://www.
grenouille.com/.
[15] C. R. Simpson, Jr. and G. F. Riley, “NETI@home: A distributed approach to collecting end-to-end network performance measurements,” in Proc. Passive and Active Measurment (PAM) Workshop, 2004, see http://www.neti.gatech.edu/.
[16] Y. Shavitt and E. Shir, “DIMES: Let the internet measure itself,” ACM SIGCOMM Computer Communication Review, vol. 35, no. 5, 2005, see http://www.netdimes.org.
[17] B. Donnet, P. Raoult, T. Friedman, and M. Crovella, “Efficient algo-rithms for large-scale topology discovery,” in Proc. ACM SIGMETRICS, Jun. 2005, see http://trhome.sourceforge.net.
[18] A. Broido and k. claffy, “Internet topology: Connectivity of IP graphs,” in Proc. SPIE International Symposium on Convergence of IT and Communication, Aug. 2001.
[19] IANA, “Special-use IPv4 addresses,” Internet Engineering Task Force, RFC 3330, Sep. 2002.
[20] R. K. Jain, The Art of Computer Systems Performance Analysis. John Wiley, 1991.
[21] B. Donnet, P. Raoult, T. Friedman, and M. Crovella, “Efficient algo-rithms for large-scale topology discovery,” arXiv, cs.NI 0411013 v1, Nov. 2004, see http://trhome.sourceforge.net.
[22] B. Donnet, T. Friedman, and M. Crovella, “Improved algorithms for network topology discovery,” in Proc. Passive and Active Measurement (PAM) Workshop, Mar. 2005, see http://trhome.sourceforge.net. [23] B. Donnet, “Doubletree prototype code,” Nov. 2005, see http://trhome.
sourceforge.net.
[24] B. Donnet, B. Huffaker, T. Friedman, and k. claffy, “Implementation and deployment of a distributed network topology discovery algorithm,” arXiv, cs.NI 0603062, Mar. 2006, see http://trhome.sourceforge.net. [25] L. Peterson, V. Pai, N. Spring, and A. Bavier, “Using PlanetLab
for network research: Myths, realities, and best practices,” PlanetLab, Design Note 05-028, Jun. 2005.
[26] Y. Bejerano and R. Rastogi, “Robust monitoring of link delays and faults in IP networks,” in Proc. IEEE INFOCOM, Apr. 2003.
[27] R. Govindan and H. Tangmunarunkit, “Heuristics for internet map discovery,” in Proc. IEEE INFOCOM, Mar. 2000.
[28] N. Spring, R. Mahajan, and D. Wetherall, “Measuring ISP topologies with Rocketfuel,” in Proc. ACM SIGCOMM, Aug. 2002.
[29] P. Barford, A. Bestavros, J. Byers, and M. Crovella, “On the marginal utility of network topology measurements,” in Proc. ACM SIGCOMM Internet Measurement Workshop (IMW), Nov. 2001.
[30] A. Clauset and C. Moore, “Why mapping the internet is hard,” arXiv, cond-mat 0407339 v1, Jul. 2004.
[31] T. Petermann and P. De Los Rios, “Exploration of scale-free networks,” The European Physical Journal B, vol. 38, p. 201, 2004.
[32] L. Dall’Asta, I. Alvarez-Hamelin, A. Barrat, A. V`azquez, and A. Vespig-nani, “A statistical approach to the traceroute-like exploration of net-works: theory and simulations,” in Proc. Workshop on Combinatorial and Algorithmic Aspects of Networking (CAAN), Aug. 2004.
[33] J.-L. Guillaume and M. Latapy, “Relevance of massively distributed explorations of the internet topology: Simulation results,” in Proc. IEEE INFOCOM, Mar. 2005.
[34] B. Donnet and T. Friedman, “Topology discovery using an address prefix based stopping rule,” in Proc. EUNICE Workshop, Jul. 2005, see http: //trhome.sourceforge.net.
Benoit Donnet received a degree in Economics
from the Facult´es des Sciences Economiques et de Gestion of the Facult´es Universitaires Notre Dame De La Paix (Belgium) in 2000. He received a master degree in computer science from the Institut d’Informatique of the Facult´es Universitaires Notre Dame De La Paix (Namur - Belgium) in 2003. He is currently research assistant at the Universit´e Pierre & Marie Curie. His research interests are in Internet measurements, focusing on large-scale topology discovery algorithms. In the context of the traceroute@home project, Mr. Donnet received in 2004 the SATIN grant provided by the E-Next Network of Excellence.
Philippe Raoult received his Bachelor’s degree
of Computer Science from the Ecole Normale in Lyon in 2003 and a Master’s degree of Distributed and Parallel Computing from the Universit´e Pierre & Marie Curie in 2005. After working on high-performance network proxies, he joined N2NSoft where he is responsible for software development on the company’s leading product, a scalable network simulation package.
Timur Friedman (S’96–A’02–M’04) received the
A.B. degree in philosophy from Harvard University and the M.S. degree in management from Stevens Institute of Technology. He received the M.S. and Ph.D. degrees in computer science from the Univer-sity of Massachusetts Amherst, in 1995 and 2001, respectively. He is currently a Maˆıtre de Conf´erences (assistant professor) of computer science at the Universit´e Pierre & Marie Curie in Paris, and a researcher at the Laboratoire d’Informatique de Paris 6 (LIP6). His research interests include large scale network measurement systems and disruption tolerant networking.
Mark Crovella (M’94/ACM’94) is Professor of
Computer Science at Boston University. During 2003-2004 he was Visiting Associate Professor at the Laboratoire d’Informatique de Paris VI (LIP6). His research interests are in performance evalua-tion, focusing on parallel and networked computer systems. In the networking arena, he has worked on characterizing the Internet and the World Wide Web; on analysis of Internet measurements, includ-ing traffic and topology measurements; and on the implications of measured Internet properties for the design of protocols and systems. He is co-author of “Internet measurement: Infrastructure, Traffic and Applications” (Wiley, 2006).