HAL Id: hal-01299777
https://hal.archives-ouvertes.fr/hal-01299777
Submitted on 13 May 2016
HAL is a multi-disciplinary open access
archive for the deposit and dissemination of
sci-entific research documents, whether they are
pub-lished or not. The documents may come from
teaching and research institutions in France or
abroad, or from public or private research centers.
L’archive ouverte pluridisciplinaire HAL, est
destinée au dépôt et à la diffusion de documents
scientifiques de niveau recherche, publiés ou non,
émanant des établissements d’enseignement et de
recherche français ou étrangers, des laboratoires
publics ou privés.
Jean Chateau, Lionel Fontagné, Jean Fouré, Åsa Johansson, Eduardo
Olaberría
To cite this version:
Jean Chateau, Lionel Fontagné, Jean Fouré, Åsa Johansson, Eduardo Olaberría. Trade patterns
in the 2060 world economy. OECD Journal: Economic Studies, OECD, 2015, 2015 (1), pp.67-100.
�hal-01299777�
© OECD 2015
Trade patterns in the 2060
world economy
by
Jean Chateau, Lionel Fontagné, Jean Fouré, Åsa Johansson
and Eduardo Olaberría*
* Corresponding authors are: Jean Chateau from the OECD Environment Directorate ([email protected]), Lionel Fontagné from Paris School of Economics and the Centre d’Etudes Prospectives et d’Informations Internationales (CEPII), Jean Fouré from the Centre d’Etudes Prospectives et d’Informations Internationales (CEPII) and Åsa Johansson ([email protected]) and Eduardo Olaberría ([email protected]) from the OECD Economics Department. The authors would like to thank Jørgen Elmeskov, Giuseppe Nicoletti, Frank van Tongeren, Jean-Luc Schneider, Maria Pricilla Ramos and Javier Gonzales Lopez for their valuable comments and suggestions and Sarah Michelson for excellent editorial support. The paper has also benefited from comments by members of Working Party No. 1 of the OECD Economic Policy Committee.
The statistical data for Israel are supplied by and under the responsibility of the relevant Israeli authorities. The use of such data by the OECD is without prejudice to the status of the Golan Heights, East Jerusalem and Israeli settlements in the West Bank under the terms of international law.
This paper presents long-term trade scenarios for the world economy up to 2060 based on a modelling approach that combines aggregate growth projections for the world with a detailed computable general equilibrium sectoral trade model. The analysis suggests that over the next 50 years, the geographical centre of trade will continue to shift from OECD to non-OECD regions reflecting faster growth in non-OECD countries. The relative importance of different regions in specific export markets is set to change markedly over the next half century with emerging economies gaining export shares in manufacturing and services. Trade liberalisation, including gradual removal of tariffs, regulatory barriers in services and agricultural support, as well as a reduction in transaction costs on goods, could increase global trade and GDP over the next 50 years. Specific scenarios of regional liberalisation among a core group of OECD countries or partial multilateral liberalisation could, respectively, raise trade by 4% and 15% and GDP by 0.6% and 2.8% by 2060 relative to the status quo. Finally, the model highlights that investment in education has an influence on trade and high-skill specialisation patterns over the coming decades. Slower educational upgrading in key emerging economies than expected in the baseline scenario could reduce world exports by 2% by 2060. Lower up-skilling in emerging economies would also slow down the restructuring towards higher value-added activities in these emerging economies. JEL classification codes: E23, E27, F02, F17, F47
1. Introduction
Global trade is undergoing rapid change through a fragmentation of production processes and the integration of emerging economies into the global market. These trends are affecting trade and industrial specialisation around the globe. To explore likely changes in global trade and specialisation patterns at the 2060 horizon, this paper combines the modelling of the aggregate growth trajectories of individual countries with a detailed modelling of global trade relationships and trade barriers at the sectoral level. Growth trajectories for the 34 current OECD economies and eight non-OECD G20 emerging countries rely on projections from the OECD long-term scenario model (Johansson et al., 2013) and are consistent with the long-term OECD Economic Outlook baseline (OECD, 2013). The OECD projections are used as an input in CEPII’s MaGE model which provides growth projections for another 105 countries (Fouré et al., 2012, 2013). The reason for mixing two sets of projections is that this work is part of a broader OECD research agenda on long-term challenges in which a common set of growth projections for OECD countries are used to assess various long-term issues, not only trade ones (for details see OECD, 2014).1
CEPII’s and OECD’s long-term growth models rely on conditional convergence, in which each country is expected to converge to its own steady-state in the long run. The projections account for the main structural factors affecting potential growth in the future: socio-demographic dynamics, human and physical capital accumulation and productivity developments.2 The CEPII and OECD models differ in some aspects. The OECD model highlights the link between structural policies and growth determinants, while the CEPII model emphasises energy use and efficiency as well female labour force participation. The OECD and CEPII growth projections are made consistent to obtain a baseline growth trajectory for 147 countries in real terms.
The paper then analyses how world trade and specialisation patterns will evolve along this baseline growth trajectory. To this end, country-specific baseline growth trajectories are used to design a dynamic baseline for a multisectoral CGE model of the world economy, MIRAGE-e (Fontagné et al., 2013). In addition to calibrating the CGE model to reproduce the baseline trajectories for GDP, saving and current account imbalances, the CGE dynamic baseline includes a detailed modelling of the sector-specific trajectory of productivity (in agriculture, manufacturing and services). Energy demands in the baseline are calibrated on the IEA scenario of future fossil energy prices. This way, MIRAGE-e provides a baseline projection for the allocation of production across sectors, for bilateral and sectoral trade flows, as well as for factor incomes. Whereas the baseline growth trajectories are country-specific (though with a constraint on the global investment-saving balance), the CGE baseline projections are defined at the regional level. The countries included in MIRAGE-e are aggregated into 26 regions or country groupings based on a detailed description of the economy of each region, with two categories of labour (skilled and unskilled) and 25 sectors.
Once this baseline growth trajectory and dynamic CGE baseline projection for the world economy has been constructed, the paper analyses an alternative baseline assuming slower
accumulation of human capital in three Asian emerging economies, to explore repercussions on growth, specialisation, trade and relative wages of skilled and unskilled labour and two stylised trade liberalisation scenarios. Two trade scenarios, a partial multilateral liberalisation and a full regional liberalisation, are compared with the baseline to explore in each case the impact on trade patterns and income distribution across skill levels.
The partial multilateral scenario assumes that world economies pursue a level-playing field for trade in goods and services, further cutting tariffs on goods on a multilateral basis, decoupling agricultural subsidies in all OECD countries, reducing non-tariff frictions to trade in goods, and letting regulatory obstacles to trade in services partially converge to those remaining in the EU in 2004. No assumption is made regarding the success or failure of the current Round of multilateral negotiations. Evolutions in tariffs, non-tariff barriers and frictions are considered to be the outcome of negotiation within the multilateral framework.
The full regional liberalisation scenario assumes developed economies firstly embark on an ambitious regional agreement (implemented progressively) fully phasing out tariffs, reducing regulatory obstacles to trade in services and frictions to trade in goods as above, but without decoupling of agricultural subsidies. This first phase of regionalism starting in 2014, would be extended to several other non-OECD countries from 2030 on, whereby major developing economies would embark in this liberalisation as well, though with less ambition regarding tariffs. In such a regional scenario, only 38 economies of the world (European Union, Canada, the United States, Mexico, EFTA members, Australia, New Zealand and Japan) are engaged in the full facilitation of trade in goods and services.
The remainder of this paper first describes our modelling approach and methodology in Section 2, while Section 3 describes in detail the assumptions underlying the baseline, the alternative baseline with slower skill accumulation in emerging economies and the two trade policy scenarios. Section 4 presents the results from the modelling exercise and Section 5 concludes.
2. Methodology
OECD long-term macroeconomic projections for 42 countries are combined with CEPII long-term projections for the remaining 105 developing economies. These projections provide a consistent set of country-specific variables to be introduced in a CGE: GDP, saving rates, skilled and unskilled labour supply, current account balances and energy efficiency. In addition, a common set of exogenous variables is used regarding demography, human capital and energy prices. These macro projections are used to draw scenarios for trade patterns at the 2060 horizon for the world economy split into 26 regions/countries and 25 sectors. 2.1. Combining models for the world economy
2.1.1. The OECD long-term model
The growth model developed by the OECD, documented in Johansson et al. (2013), is used to project growth to 2060 for the 34 OECD members and eight non-OECD G20 members. It derives potential output from a Cobb-Douglas production function featuring physical capital, human capital and labour. The two latter production factors are subject to a common technical progress.
While population projections are exogenous (from Eurostat and United Nations Population databases), labour force participation rates are projected using a cohort approach.
In practice the cohort approach assumes that the observed participation behaviour of individuals belonging to the most recent cohorts will continue in the future and this amounts to juxtapose constant age- and gender-specific entry and exit rates (varying with educational attainment). Special treatment is provided for retirement age, which embodies current and planned pension reforms and is indexed to changes in life expectancy over the long run, so as to maintain a constant share of active lives. Unemployment is assumed to converge towards the long-term level of unemployment (which is chosen to be the lowest level of Non-Accelerating Inflation Rate of Unemployment, NAIRU, between 2007 and 2013), at country-specific speeds that depend on labour market policies. Human capital is measured by average years of schooling of the adult population. Educational attainment of cohorts aged 25-29 is assumed to slowly converge to current best practice (Korea) over the long run at the average speed observed globally over the period 1960-2005, with attainment in Korea also gradually improving. Future educational attainment of the adult population is then projected using a perpetual inventory model and this projected stock of average years of schooling is converted into a measure of human capital assuming decreasing returns to education.
Total factor productivity (TFP) dynamics are governed by an estimated error-correction model featuring conditional convergence. TFP projections are driven by the global rate of technological progress and the speed of “catch-up” towards the country-specific steady-state level of TFP. Specifically, the country-specific long-run TFP level depends on the common global pace of technological progress and the country’s regulations in product markets. The speed of convergence towards this long-run TFP level is country-specific as it depends on the degree of openness to trade. Greater openness to trade increases the speed of convergence towards the technological frontier, thus enhancing TFP growth.
Since in most developed economies, the ratio of capital to trend output has been relatively stable, the underlying projection for capital assumes a continuation of this stability in capital intensity.3 The projections of the underlying capital-output ratio are then subject to influences from the real cost of capital, which varies mainly due to changes in real interest rates. Saving rates are estimated as a function of old-age and youth dependency ratios, life expectancy, fiscal balances, terms of trade, productivity growth, net oil balances and the availability of credit. Projected investment and saving patterns determine residually current account balances for the 42 countries covered.
A closure rule imposes a constant overall saving-investment imbalance for the 42 countries. Deviations from such a rule are reflected in changes of world interest rates that change the country-specific equilibrium capital stocks via the cost of capital. Other equilibrating mechanisms include risk premia on excessive public and external indebtedness, which also affect the country-specific costs of capital.
Policy-wise, the OECD baseline trajectory assumptions include:
● gradual convergence over the long run in product market regulations and institutions towards settings currently found in the average OECD country;
● stabilisation of debt levels at 60 % of GDP in countries with initial debt in excess of 60% while in countries with debt below 60%, debt is stabilised at the current level;
● gradual increase over the long run in financial market development to the current level in the United States, and;
● gradual increase over the long run in social spending in emerging economies to provisions similar to the average OECD country.
2.1.2. MaGE: CEPII’s long-term model
Projections for 105 additional developing countries are obtained with the MaGE model proposed in Fouré et al. (2012, 2013). Based on a three-factor (capital, labour, energy) and two-technical progress (capital-labour and energy-specific) production function, MaGE is a supply-side oriented macroeconomic growth model, defined at country level for 147 countries (although only 105 are covered in this projection exercise as the other are covered by the OECD projections). It was built in three steps: production factor and productivity data were collected for the 1980-2009 period drawing on World Bank, United Nations and International Labour Organization data; behavioural relations for factor accumulation and productivity growth were estimated; and these relations were used to project GDP.
Supply is modelled as a CES production function of energy and a Cobb-Douglas bundle of capital and labour. In MaGE, technological progress includes energy efficiency and TFP. It is derived theoretically, and estimated econometrically at the macroeconomic level.
Behavioural relations are estimated for the education level, female participation to the labour force, capital accumulation and the two forms of efficiency improvements. The labour force projection starts from UN population projections, split across 5-year age groups. For each of these age groups, education is estimated and labour force participation is derived in the following way. While male labour force participation follows the logistic relation determined by the International Labour Organization projections (and therefore does not depend on education), female participation is assumed to change with education level (more education means less participation for the study-age women, while it enhances participation afterwards). Educational attainment, defined as the percentage of each age group having attained a secondary or tertiary diploma, is assumed to follow a catch-up process to the leaders. The catching-up has different speeds, depending on the region and age-group, while the leader levels for each age-group and educational level are composites of the different leader countries (i.e. Austria, Japan, the United States, Switzerland, France, Norway, New Zealand and Russia, depending on the education level and time period). In turn, these best-practice targets are assumed to continue to grow at their historical pace.
Investment in MaGE is a function of savings. It is modelled as a non-unitary error-correction relationship that differentiates long-term correlation between saving and investment and annual adjustments around this trend. Saving is a function of economic growth and the age structure of the population, consistent with the life-cycle hypothesis. Capital accumulates in MaGE according to a permanent-inventory process with a constant depreciation rate. The closure rule in MaGE imposes consistency between saving and investment at the global level.
Capital-labour TFP and energy efficiency are driven by catch-up to the best-performing countries. TFP catch-up is conditional on, and driven by, the educational level, while tertiary education fuels innovation (autonomous productivity improvements), secondary education is a prerequisite for imitation (catching-up). Energy efficiency catch up depends both on the distance to the technological frontier in energy use, and on the level of development, to reflect differences in sectoral structure across countries.4
2.1.3. Consistency between OECD and CEPII models
The OECD and MaGE modelling frameworks share certain essential characteristics (production function approach, conditional convergence, life-cycle savings, closure rule, etc.) but also differ in many respects. This partly reflects the different coverage of countries – with
OECD projecting growth for advanced and major emerging economies and MaGE projecting growth for a larger set of countries for which data may be scarce – and different focus – with OECD projections highlighting the role of policies and looking also at fiscal balances and MaGE projections giving a more detailed account of catching up processes in terms of education, female participation, energy efficiency and addressing the role of oil rents in determining GDP changes of major oil exporters. Projections with MaGE are also less demanding in terms of data, which facilitates the extension of the exercise to a larger set of countries. In sum, the OECD and MaGE are broadly similar but each is best suited to deal with advanced and developing economies, respectively. In view of differences in specification, particular care has been taken to exploit the complementarity and ensure consistency of the two sets of projections.
In practice, projections of GDP, labour force, education and current accounts for the 42 countries covered by the OECD long-term model are used as an input for MaGE. Some variables that are not available in OECD projections or not suited for MaGE specification are derived according to MaGE’s estimated relationships. TFP for the 42 OECD and non-OECD G20 countries is recovered as the gap between the projected production factors (capital, labour and energy) and the GDP projected by the OECD model, but encompassing the effect of human capital accumulation in the technical progress.5 For the remaining 105 countries, productivity levels, production factors and GDP are recovered using MaGE assumptions. Investment in the 105 countries adjusts to match the saving-investment balance at the global level. This ensures consistency between the closure rules of the two models, as the overall imbalance for the 42 countries covered by the OECD model is compensated by a symmetric overall imbalance for MaGE’s 105 countries, with the global surplus or deficit of investment distributed to these latter countries proportionally to their contribution to global pre-rescaling investment levels.
2.2. From the macro to the sectoral level
The multi-sectoral CGE model has a recursive sequential dynamic set-up that is fed with the output of the OECD and MaGE aggregate growth models. Projections from these models are used to construct a dynamic baseline for MIRAGE-e (Fontagné et al., 2013; Decreux and Valin, 2007). MIRAGE-e relies on the same exogenous variables (population, energy prices) that are embodied in the macroeconomic models, but takes as additional exogenous variables the results from the macroeconomic projections, notably GDP, saving rates, current accounts, labour force, human capital formation and energy efficiency. Moreover, the distribution of human capital in the population is used to set the number of skilled and unskilled workers in MIRAGE-e, which distinguishes these two categories of labour, with the assumption that skilled workers correspond to people having obtained a tertiary level diploma. The global closure of MIRAGE-e is ensured by imposing that the share of each country/region in the global current account imbalance varies yearly according to the macro projections.
2.2.1. Supply in MIRAGE-e
On the supply side, each sector in MIRAGE-e is modelled as a representative firm, which combines value-added and intermediate consumption in fixed shares. Value-added is a bundle of imperfectly substitutable primary factors (capital, skilled and unskilled labour, land and natural resources) and energy. Firms’ demand for production factors is organised as a Constant Elasticity of Substitution (CES) aggregation of land, natural resources, unskilled labour, and a bundle of the remaining factors. This bundle is a nested
CES aggregate of skilled labour, and another bundle of capital and energy. Finally, energy is a CES aggregate of energy sources (except for non-electricity energy production sectors, for which the share of each energy input is fixed). Energy consumption of the representative firm comprises five energy goods (electricity, coal, oil, gas and refined petroleum), which are aggregated in a single bundle that mainly substitutes for capital.
MIRAGE-e assumes full employment of primary factors, whose growth rates are set exogenously based on the macro projections on a yearly step, as detailed below.6
● Population, participation in the labour market and human capital evolve in each country (or region of the world economy) according to the demographics embedded in the macro projections. This determines the labour force as well as its skill composition (skilled/ unskilled).7 Skilled and unskilled labour is perfectly mobile across sectors, but immobile between countries.
● Natural resources are sector specific, while land is mobile not only between agricultural sectors but also between agriculture and other uses. Natural resources for the mining sector and land for agricultural sectors are set at their 2004 levels: prices adjust demand to this fixed supply. In the baseline, natural resources for fossil fuel production sectors adjust to match the imposed exogenous price target (taken from the International Energy Agency, 2012) for coal, oil and gas, and according to the energy demand projected by the model. By contrast, in the simulations, changes in demand for fossil energy sources influence their price, while natural resources are fixed at their baseline level. In practice environmental damages could hamper long-run growth. A recent OECD study undertook CGE-modelling-based assessment of environmental damages, using similar long-run projections for OECD countries as those used in this paper (OECD, 2015). This research showed that only agricultural and energy world trade patterns would be significantly altered by taking climate change into account. Therefore, as a first approximation, most of the results presented in this study would not be significantly affected by environmental feedback effects on growth.
● Installed capital is assumed to be immobile (sector-specific), while investments are allocated across sectors according to their rates of return. The overall stock of capital evolves by combining capital formation and a constant depreciation rate of capital of 6% that is the same as in the long-term growth models. Gross investment is determined by the combination of saving (the saving rate from the growth model, applied to the national income) and the current account. Finally, while total investment is saving-driven, its allocation is determined by the rate of return on investment in the various activities. For simplicity, and because of lack of reliable data on foreign direct investment at country of origin, host and sectoral levels, international capital flows only appear through the current account imbalances, and are not explicitly modelled.
2.2.2. Demand in MIRAGE-e
On the demand side, a representative consumer from each country/region maximises instantaneous utility under a budget constraint and saves a part of its income. Expenditure is allocated to commodities and services according to a LES-CES (Linear Expenditure System – Constant Elasticity of Substitution) function. This implies that, above a minimum consumption of goods produced by each sector, consumption choices among goods produced by different sectors are made according to a CES. This representation of preferences is well suited to the analysis as it is flexible enough to deal with countries at different levels of development.
Within each sector, goods are differentiated by their origin. A nested CES function allows for a particular status for domestic products according to the usual Armington hypothesis (Armington, 1969): consumers’ and firms’ choices are biased towards domestic production, and therefore domestic and foreign goods are imperfectly substitutable, using a CES specification. Armington elasticities (defined at sector level but common to all regions) are recovered from the GTAP database (Global Trade Analysis Project) and estimated by Hertel et al. (2007). Total demand is built from final consumption, intermediate consumption and investment in capital goods.
Efficiency in the use of primary factors and intermediate inputs is based on the combination of four mechanisms. First, agricultural productivity is projected separately, as detailed in Fontagné et al. (2013). Second, energy efficiency computed from the aggregate growth models is imposed on MIRAGE-e (it enters the capital-energy bundle). Third, a 2 percentage point growth difference between TFP in manufactures and services is assumed (as in van den Mensbrugghe, 2005). Fourth, given the agricultural productivity and the relation between productivity in manufacturing and services, MIRAGE-e recovers endogenously country-specific TFP from the exogenous GDP and production factors. Notice that TFP thus recovered from the baseline projections is subsequently set as exogenous in the alternative scenarios. Therefore, GDP becomes endogenous in such scenarios.
Dynamics in MIRAGE-e are implemented in a sequentially recursive way. That is, the equilibrium can be solved successively for each period, given the exogenous variations of GDP, savings, current accounts, active population and skill level coming from the growth models, as described above. For baseline projections, the time span is 56 years, the starting point being 2004. This version of MIRAGE-e assumes that all markets are in equilibrium at each period, with an assumption of generalised perfect competition.
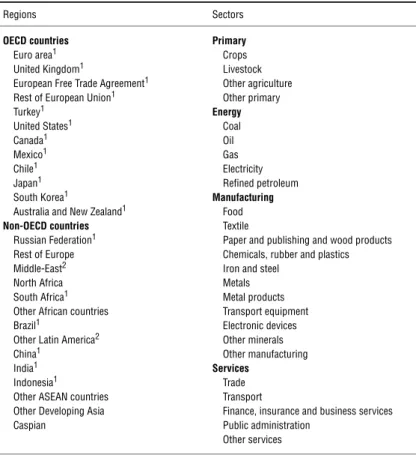
MIRAGE-e was calibrated on the GTAP dataset version 7, with 2004 as a base year. As shown in Table 1, our data aggregation singles out all energy industries and combines other industries into main representative subsectors within the agriculture, manufacturing and services aggregates. For the regional aggregation, the main OECD member countries are retained, while other member countries are aggregated. Main emerging economies are also isolated whereas the rest of the world is aggregated on a geographical basis. Table 1 shows the composition of regions, highlighting which of them is fully described in the OECD long-term aggregate growth projections. For instance, all countries in the euro area, considered as a region in MIRAGE, were modelled individually using the OECD macroeconomic framework. In contrast, only one country (Israel) in the Middle-East region of MIRAGE was modelled by the OECD. Finally, North Africa is an example of a region in MIRAGE which has been modelled exclusively by MaGE.
Tariff data at the HS6 level corresponds to the ad valorem equivalents from the MAcMap HS6 database (Guimbard et al., 2012) and are aggregated to match our regional and sectoral decomposition using the reference group methodology (Bouët et al., 2008). Finally, the model includes international transaction costs and non-tariff measures (NTM) in services, modelled as an iceberg trade cost (i.e. cost of transporting a good that uses up a fraction of the good). Data for trade costs associated with delays were calibrated using a database provided by Minor and Tsigas (2008), who adopt the methodology in Hummels and Schaur (2012). NTM in services are ad valorem equivalents taken from Fontagné et al. (2011).
The way in which the OECD long-term model, MaGE and MIRAGE-e are related is summarised in Figure 1, which shows the different variables that the models exchange and
the point at which assumptions are introduced (see Section 3 for details). Notice that two alternative sets of assumptions on educational catch-up lead to two alternative baseline scenarios. Accordingly, two alternative baselines are compared in the education scenario.
Table 1. Sector and country aggregation in MIRAGE-e
Regions Sectors
OECD countries
Euro area1 United Kingdom1
European Free Trade Agreement1 Rest of European Union1 Turkey1 United States1 Canada1 Mexico1 Chile1 Japan1 South Korea1
Australia and New Zealand1
Non-OECD countries Russian Federation1 Rest of Europe Middle-East2 North Africa South Africa1 Other African countries Brazil1
Other Latin America2 China1
India1 Indonesia1 Other ASEAN countries Other Developing Asia Caspian Primary Crops Livestock Other agriculture Other primary Energy Coal Oil Gas Electricity Refined petroleum Manufacturing Food Textile
Paper and publishing and wood products Chemicals, rubber and plastics Iron and steel
Metals Metal products Transport equipment Electronic devices Other minerals Other manufacturing Services Trade Transport
Finance, insurance and business services Public administration
Other services 1. Regions fully included in the 42 OECD sample.
2. Regions with one country only in the 42 OECD sample (Argentina and Israel).
Figure 1. Description of the models and assumptions
1. See Table 2.
Note: Vertical arrows show scenario assumptions, while horizontal arrows indicate variable flows between the models. Source: Authors’ calculations.
GDP Population Active population Current account Education (42 countries) GDP Population Active population Current account Education Savings Energy efficiency (147 countries) TFP Energy resources MaGE OECD MIRAGE MIRAGE Baseline Lower upskilling Reference Baseline Lower upskilling
Lower upskilling reference Multilateral Regional Tariffs Transaction costs NTM in services Agricultural subsidies Education Baseline assumptions1
However, trade liberalisation scenarios (regionalism versus multilateralism) are implemented as trade policy shocks in the baseline with high education only. Details on assumptions underlying these simulations are described in the next sections.
3. Education baseline alternative and trade liberalisation scenarios
The main objective of this paper is to investigate the driving forces of trade and specialisation patterns at the 2060 horizon. In order to do this a coherent baseline scenario for the world economy is constructed, based on the evolution of major determinants of growth (such as demography, physical and human capital accumulation and energy availability). This framework integrates available information on preferential trade agreements already signed. After calibrating MIRAGE-e in order to reproduce the long-term trade to income elasticities projected in the growth baseline trajectory, we obtain a baseline for the CGE that is shocked using the two scenarios already mentioned: full regional trade liberalisation versus partial multilateral liberalisation.
3.1. Baseline assumptions
When projecting trade patterns, it is important to rely on a model that is able to reproduce some basic stylised facts such as the trade-to-income elasticity. Here we follow the methodology described in Fontagné and Fouré (2013) to make the model mimic this elasticity. As shown in Table 2, four main drivers of this elasticity are tariffs, fossil-fuel energy prices, transaction costs for goods and TFP in the transportation sector. While energy prices are drawn from the International Energy Agency projections to 2035 (these are extended linearly to 2060 in MIRAGE), the three remaining parameters need to be calibrated to reproduce past evolutions of world trade.
Determining a reference scenario for drivers such as transaction costs or TFP in the transportation sector is a difficult exercise, as they summarise a large variety of determinants. Productivity in transports encompasses breakthroughs like containerisation. Product standards also influence the transaction costs (approximated here by the tariff-equivalent of time spent in duties), along with the administrative organisation of duties and other related factors.
To proceed, the four drivers are calibrated using trajectories similar to those observed over the past 50 years. This implies adding a 2% additional TFP growth in transportation (compared with other services), in line with estimations by Wolff (1999) on years 1958-87. Finally it is necessary to calibrate a 25% decrease in transaction costs for goods, to recover a long-term elasticity in line with the observed one.
Then, since the trade liberalisation scenarios will consider scenarios on agricultural subsidies, the implemented reforms of the Common Agricultural Policy (CAP) of the
Table 2. Baseline scenario assumptions
Variable Baseline assumption
Energy prices (coal/oil/gas) IEA (2012)
Transaction costs for goods -25% in 2035 (-45% in 2060); (Fontagné and Fouré, 2013)
TFP in transports +2% annual growth (compared with services); (Fontagné and Fouré, 2013) Free Trade Agreements EU28/ASEAN and partners
New Common Agricultural Policy -75% factor subsidy in EU in 2005 (crops and other agriculture) -50% factor subsidy in EU in 2005 (livestock)
European Union acted in 2003 and taking into effect in 2005 are incorporated in the model. This is done in a simplified form (due to the sectoral aggregation), based on Gouel and Laborde (2007).
Finally, the MIRAGE-e baseline includes Free Trade Agreements (FTAs) that are already planned at the time of writing, using the WTO database on regional trade agreements.8 This results in two FTAs (enlargement of the European Union to 27 and then 28 members, plus implementation of the ASEAN treaties) and six bilateral regional agreements (between EU and Korea, and the so-called ASEAN+6 agreements). These agreements are implemented at the Harmonized commodity Description and Coding System 6 (HS6) level using MAcMap for 2004. The timing for implementation is summarised in Figure 2.
The implementation of these FTAs is two-fold.9 First, it consists in the progressive abolition of tariff duties among the participants. For each step of each agreement, the tariff reduction is linearly implemented at the HS6 commodity level for all countries, and the results are aggregated to our mapping described in Table 1. Second, the external tariff (imposed on non-FTA members) of the FTA members is homogenised. Concerning the European Union, it is assumed that Croatia adopts pre-existing European tariffs in 2013, whereas for the ASEAN it is assumed that all members adopt the average tariff at the end of the implementation (2015).
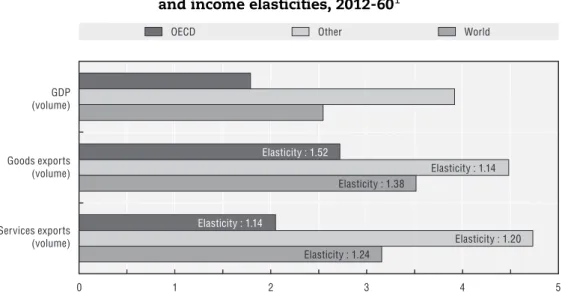
Together these assumptions imply that the model projects an elasticity of world trade to world GDP of around 1.4 for goods (as compared with 2.8 during the 1990s and with 1.6 between 1950 and 2009) and 1.2 for services (Figure 3). This lower elasticity for services is coherent with the assumptions, since the baseline projection does not include scenarios on NTM in services. This lower responsiveness of trade to GDP as compared with the one during the 1990s partly reflects that the intensity of fragmentation of global value chains that occurred in the last decades is hypothesised to slow down as there are likely physical limits
Figure 2. Baseline free trade agreements1
1. The Association of Southeast Asian Nations (ASEAN) consists of Indonesia, Malaysia, the Philippines, Singapore, Thailand, Brunei, Cambodia, Laos, Myanmar (Burma) and Vietnam. AUNZ denotes Australia and New Zealand. Source: Authors’ calculations.
2000 2005 2010 2015 2020 2025 EU28 ASEAN ASEAN-Korea ASEAN-Japan ASEAN-India ASEAN-China ASEAN-AUNZ EU-Korea
on how much a product can be fragmented (Fontagné and Fouré, 2013). This is consistent with a recent study by Constantinescu et al. (2015) which suggested that the slowdown in trade in the 2000s was partly due to a structural change in the trade-GDP relationship. 3.2. Education baseline variant scenario
Given that long-term growth trajectories are likely to be influenced by the skill distribution, as emphasised in Fontagné and Fouré (2013), it is worth comparing our central baseline with one in which skill developments are different. Since a more educated population is likely to influence TFP, the three steps constituting our modelling exercise (i.e. the OECD model, the MaGE and the MIRAGE baseline) are recomputed with a different configuration of skills (so-called lower up-skilling scenario). In this lower skill scenario, human capital upgrading in key emerging economies is weaker than in the baseline scenario.
Changes in the stock of human capital influence aggregate growth, especially in developing economies, and affect trade patterns across countries. Among the main developing countries, the Asian ones have exhibited large improvements in terms of human capital accumulation and technological progress (Fouré et al., 2012), while remaining at a relatively low level of productivity, leaving room for the large improvements that occur in our projections. Therefore, the low-skill scenario focus on the three largest Asian developing countries – China, India and Indonesia, hereafter called CII economies – and implement an alternative baseline in which the educational attainment of the cohort aged 25-29 will converge to the frontier level of education at a speed that is 50% slower than assumed in the baseline macro projections. As a result, by 2060 average years of schooling are around 1.2 years lower in these three countries as compared with the baseline.
3.3. Trade liberalisation scenarios: Regionalism versus multilateralism
Despite reductions in market- and non-market barriers to trade during the last decades, particularly for industrial products, significant barriers still remain at the global level. These barriers go beyond tariffs on goods. Regulatory obstacles to trade in services,
Figure 3. Growth of GDP, exports in goods and services
and income elasticities, 2012-601
1. Goods and services exports including intra-trade. Source: Authors’ calculations.
0 1 2 3 4 5
OECD Other World
GDP (volume) Goods exports (volume) Services exports (volume) Elasticity : 1.52 Elasticity : 1.14 Elasticity : 1.14 Elasticity : 1.20 Elasticity : 1.38 Elasticity : 1.24
agricultural subsidies and transaction costs on goods remain large. While trade liberalisation can take different forms, the approach in this paper is to describe two stylised alternative trade facilitation scenarios as summarised in Table 3. In the partial multilateral liberalisation scenario, applied tariffs on goods are linearly halved and there is a further 25% reduction in international transaction costs relative to baseline. Moreover, outside the EU regulatory obstacles to trade in services partially converge towards current EU levels, while EU further implements its internal market for services (leading to a 10% decrease of barriers to trade in services among member states over the long run). Coupled agricultural subsidies are phased out in the OECD, beyond Europe.
The full regional liberalisation scenario considers two horizons. The large FTA area comprising NAFTA, the European Union, Australia/New Zealand, Japan and Korea is completed by 2060. This is a long process, but the zone is very large and diverse. Some of its members are potentially attached to agricultural subsidies, which are eventually not phased out as opposed to the multilateral scenario. Tariffs are phased out, while progress in terms of market access for services and transaction costs is now limited to the borders of the FTA. From 2014 to 2030, trade liberalisation is strictly limited to the wide region so-defined. Then, from 2030 on, this region reduces tariffs on a bilateral and reciprocal basis with a series of preferred partners, including the BRICs, South Africa, ASEAN and Chile. Neither trade in services nor transaction costs are concerned.
These scenarios are designed to allow for comparison between a full liberalisation between a small number of (developed mostly OECD) countries, along with bilateral agreements, and a liberalisation resulting from global multilateral negotiations, while keeping assumptions simple to be able to trace their implications. Indeed, a multilateral framework is likely to lead to a less ambitious agreement (as demonstrated by the tensions on the Doha agenda) both in terms of tariff reduction and non-tariff measures.
4. Results
4.1. Baseline long-run GDP and trade scenario
4.1.1. Global growth will be sustained by emerging economies
Over the next half century, world GDP is projected to grow on average around 3% per year with declining rates in many countries. Up until 2030, world growth will be sustained by a rising weight of China and India with high, albeit declining, growth while after 2030 fast growth in Africa is expected to support world growth. The OECD trend GDP growth is projected at about 2% annually until 2050-60, and growth in emerging economies will
Table 3. Trade policy scenarios
Variable Partial multilateral liberalisation Full regional liberalisation Tariffs -50% in 2060 (compared with baseline
scenario)
-100% in 2060 in the FTA area -50% in 2060 with partners (from 2030) Transaction costs for goods -25% in 2060 -25% in 2060 in the FTA zone NTM in services -10% in 2060 among EU members.
Half convergence in 2060 to average intra-EU level between other countries.
-10% in 2060 among EU members. Half convergence in 2060 to average intra-EU level for other countries inside FTA area. Coupled agricultural subsidies -50% in 2060 for EU, US, Japan, Korea,
Canada, EFTA.
continue to outpace the OECD, but the difference will narrow over coming decades as income levels in emerging economies catch up to those in the OECD (Figure 4). As a result, the next 50 years will see major changes in the relative importance of countries or regions in global GDP.
Concerning the composition of GDP, two forces are at play. Relative prices change due to overall differences in TFP (relative prices of manufactured goods decrease) while, in developing countries, preferences shift toward services. By 2060, services will represent a lower share of world consumption but a higher share of consumption in developing economies (Figure 5).
Figure 4. Growth in real GDP over the next 50 years1
1. World GDP refers to 147 countries. Source: Authors’ calculations.
Figure 5. Share of services in consumption, selected countries, 2012 and 2060
Source: Authors’ calculations.
8 0 1 3 2 5 4 7 6 2000-10 2010-20 2020-30 2030-40 2040-50 2050-60
OECD World Non-OECD
% average annual rate
2012 2060 0 10 20 30 40 50 60 70 80 90 Per cent
China India Sub-Saharan United States Euro area World Africa
4.1.2. Continuing globalisation over the next half century
Growth in trade (gross exports of goods and services) is expected to continue to outpace GDP growth over the next 50 years with world trade estimated to grow at around 3.5% annually (compared with 6.9% over the period 1990-2007).
In terms of geographical distribution, there will be large shifts in trade patterns, reflecting among other things uneven developments in income across the globe as well as changes in comparative advantages (Figure 6). China and India are projected to gain market shares in world trade over the next half century, although the rapid growth in China’s trade share is expected to slow down after 2030, as GDP growth is slowing. Likewise, Africa, Indonesia and other Asian economies are projected to experience sizeable increases in trade shares, especially after 2030, reflecting rapid growth leading to larger economic size combined with low production costs. These gains in trade shares of emerging and developing economies are mostly at the expense of Euro area members. From having accounted for 19% of world exports in 2012, the Euro area’s market share in exports is expected to fall to approximately 12% by 2060. However, given the increase of world imports
Figure 6. The geographical distribution of trade will shift Gross exports as a share of world exports (volume), %
Source: Authors’ calculations.
2012 2030 2060 United States 14% Canada 3% United Kingdom 5% Rest of the world 16% Other Asia 13% Latin America 5% Africa 3% Indonesia 1% India 2% Euro area 19% Japan 7% China 12% United States 12% Canada 3% United Kingdom 4% Rest of the world 15% Other Asia 15% Latin America 5% Africa 4% Indonesia 2% India 3% Euro area 14% Japan 4% China 19% United States 11% Canada 2% United Kingdom 3% Rest of the world 12% Other Asia 16% Latin America 5% Africa 10% Indonesia 2% Euro area 12% Japan 5% China 15% India 7%
over that period, Euro area exports are expected to triple despite such reduced market share. By contrast, some OECD economies, including the United States and Canada, are projected to see their trade shares decrease only slightly, reflecting comparatively more favourable growth projections than the euro area.
The changing geographical distribution of trade is matched by changes in the relative importance of different sets of trading partners (Figure 7). Trade volumes are driven, among other things, by gravity factors including size of economies, distance or language. Consistent with this, the projections of the CGE model suggest that the expected shift of wealth creation from OECD to non-OECD countries will have important implications for trade patterns. While in 2012 about half of total trade in bilateral terms took place within the OECD area, the importance of bilateral trade among OECD members is expected to nearly halve by 2060. Instead, by 2060 trade among non-OECD economies will more than double, to account for approximately one-third of global trade. For instance, trade among Asian economies increases from around 6% to 16% over the projection period. At the same time, OECD economies will increasingly import products from non-OECD economies, whereas the share of global imports of non-OECD from OECD countries will remain more or less unchanged. All in all, over the next 50 years the geographical centre of trade is projected to move away from OECD towards non-OECD countries.
4.1.3. Globalisation and income convergence will influence trade patterns
The relative importance of different countries and regions in specific markets is set to change markedly over the coming decades, driven by diverging growth performance, changes in relative productivity and production prices as well as a reorientation of consumption in emerging economies towards services (Figure 8). Notably, China, India, other Asian economies and Africa are projected to become the dominant players in manufacturing, while most OECD countries are expected to lose ground. For instance, Japan, Korea and the United States are set to lose their comparative advantage in electronics to China and other Asian countries (see Appendix A, Figure A.1), who could account for as much as 70% of world exports in electronics by 2060. However, the long-run trends for detailed sectors should be interpreted with caution, given that the model-based scenario cannot foresee and incorporate major shifts in consumer preferences or technological breakthroughs.
Figure 7. A growing share of bilateral trade will occur
between different non-OECD countries
Share of global gross exports (volume), %
Source: Authors’ calculations.
2012 2060
Within non-OECD 15%
OECD with non-OECD 38%
Within OECD 47%
Within non-OECD 33%
OECD with non-OECD 42%
Within OECD 25%
Emerging and developing economies’ (e.g. China, India and Africa) world market shares will increase significantly even in service trade, as a result of a shift towards more advanced activities as these economies become wealthier, combined with a larger economic size. The gain in service trade shares in China and India is mostly at the expense of the Euro area, the United States, Japan and the United Kingdom. This tendency could be further reinforced by the possibility that some tasks performed by service sectors are offshored to low-wage countries.
In the energy sector, a marked shift in the global distribution of trade is expected to occur over the next half century. The trade share of the United States in world energy exports is expected to more than triple by 2060, at the expense of the Middle East and the Russian Federation. These large expected gains are consistent with recent investments in technologies to extract and develop new sources of shale gas and oil, as compared with the exhaustion of conventional natural reserves in other parts of the world (e.g. IEA, 2012). Alongside the increase in energy trade, the United States maintains competitiveness in complementary industries such as chemicals (see Appendix A, Figure A.1). However, it should be noted that the energy sector is subject to large geopolitical and technological uncertainty over the next half century, making projections particularly vulnerable to unpredicted events.
In agriculture, the United States and other Asian countries are expected to remain competitive and their trade share in agricultural exports will increase mostly at the expense of Africa and Latin America.
Figure 8. The relative importance of different countries
in specific industries is expected to change1
Countries shares in world exports (volume), 2010 and 2060
1. Manufacturing includes chemicals rubber and plastic, electronics, food, iron and steel, metal products, other manufacturing, other metals, other minerals, paper and wood, textiles, transport equipment. Service includes business service, transport service, wholesale and retail, public administration and other services. Agriculture includes livestock, rice and crops, other agriculture and other mining. Energy includes coal, crude oil, electricity, gas and refined oil.
Source: Authors’ calculations.
2010 2060 2010 2060 2010 2060 2010 2060 17% 12% 21% 12% 23% 30% 9% 19% 24% 14% 32% 19% 14% 14% 6% 10% 23% 15% 15% 9% 17% 14% 9% 10% 29% 43% 21% 36% 18% 22% 37% 29% 1% 9% 3% 18% 9% 3% 13% 13% 6% 6% 7% 7% 18% 17% 27% 19% Euro area + United Kingdom Rest of OECD United States + Canada
Emerging Asia Africa Rest of the world
Non-OECD
OECD
4.1.4. The industrial structure in emerging economies gradually becomes similar to that of the OECD
In parallel with the changing trade patterns, the industrial structure (measured as value-added shares of specific sectors in total value-added) will evolve differently across countries and regions depending on changing patterns of domestic and international demand, differences in the accumulation of production factors across countries, the allocation of factors across sectors within countries and countries’ international competitiveness. One general trend that stands out in the baseline projection is that most significant changes will occur in emerging economies, whereas the industrial structure will remain relatively stable in OECD countries over the next half century (Figure 9). This largely reflects the development process in lower-income countries with income and living standards catching-up towards levels of higher-income OECD countries, which results in changing domestic demand and consumption structure. Projections also show that trade costs remain large enough in certain industries to prevent a full shift of industrial activities to emerging economies away from OECD.
The industrial structure in fast-growing emerging countries will become more similar to the one in OECD economies. In emerging countries, past trends are expected to continue over the projection period and the industry mix will continue shifting towards services away from manufacturing, typically low-skilled (e.g. textile, food production, etc.). China and India are projected to experience marked increases in the contribution of financial and business services, wholesale and retail and transport services to value added as domestic demand for these services increases with income and shift in comparative advantage (Figure 9). This increased similarity among OECD and emerging countries implies that intra-industry trade should account for a larger share of trade over the next half century, contrasting with the recent decline associated with the large contribution of highly specialized emerging economies to world exports.
Despite the general reorientation towards services, manufacturing industries are still expected to remain important in emerging economies. For instance, in China, Indonesia and other Asian countries the contribution of the auto industry to value-added will increase over the next 50 years. Likewise, electronics is projected to account for an increasing share of GDP in China, reflecting strong competitiveness in this sector.
4.1.5. Income convergence will influence wage inequality among and within countries Over the next 50 years income gaps among countries will narrow. Rapid GDP growth in emerging economies is matched by a tendency of GDP per capita to converge across countries. Between now and 2060, GDP per capita (measured in 2005 PPPs) in India, the Philippines and some African countries will increase by more than 7 times, while the increase is around five times in Indonesia and China (see Johansson and Olaberría 2014; OECD, 2014 for details). Over the same period, living standards will roughly double in the highest-income OECD countries. This will lead to a richer and more equal distribution of world income among countries, which will push in the direction of falling absolute poverty.
Furthermore, across countries the relative wage of skilled to unskilled labour will change over the next half century, with implications for trade patterns. The distribution of wages across differently skilled workers within countries depends on the supply and demand for skills, the extent of skill-biased technological change, the composition of consumption demand and institutional settings in labour markets and educational systems.
Figure 9. Industrial structure is set to change in emerging economies Value-added shares of key industries by country, 2010 and 2060
Source: Authors’ calculations.
2010 2060 0 5 10 15 20 25 30 0 5 10 15 20 25 30 0 5 10 15 20 25 30 0 5 10 15 20 25 30 0 5 10 15 20 25 30 0 5 10 15 20 25 30 United States Bus iness ser vice s Othe r ser vice s Wh oles ales reta il trade Trans port servi ces Othe r ma nufa ctur ing Chemi cals rubb er a nd p lastic Pape r and w oodFood Elec trici ty Trans port e quipme nt Met al p roduct s Rice a nd c ropsGas Othe r mi neral s Text ile Iron a nd steel Elec tronic dev ices Cru de oi l Euro area Bus iness ser vice s Othe r ser vice s Wh oles ales reta il trade Trans port servi ces Othe r ma nufa ctur ing Chemi cals rubb er a nd p lastic Pape r and w oodFood Elec trici ty Trans port e quipme nt Met al p roduct s Rice a nd c ropsGas Othe r mi neral s Text ile Iron a nd steel Elec tronic dev ices Cru de oi l Japan Bus iness ser vice s Othe r ser vice s Whol esale s re tail t rade Trans port servi ces Othe r ma nufa ctur ing Chemi cals rubb er a nd p lastic Pape r and w oodFood Elec trici ty Trans port e quipme nt Met al p rod ucts Rice a nd c ropsGas Othe r mi neral s Text ile Iron a nd steel Elec tronic dev ices Crude oil China Bus iness ser vice s Othe r ser vice s Whol esale s re tail t rade Trans port servi ces Othe r ma nufa ctur ing Chemi cals rubb er a nd p lastic Pape r and w oodFood Elec trici ty Trans port e quipme nt Met al p rod ucts Rice a nd c ropsGas Othe r mi neral s Text ile Iron a nd steel Elec tronic dev ices Crude oil India Bus iness ser vice s Othe r ser vice s Whol esale s re tail t rade Trans port servi ces Othe r ma nufa ctur ing Chemi cals rubb er a nd p lastic Pape r and w oodFood Elec trici ty Trans port e quipme nt Met al p roduct s Rice a nd c rop s Gas Othe r mi neral s Text ile Iron a nd steel Elec tronic dev ices Cru de oi l Indonesia Bus iness ser vice s Othe r ser vice s Whol esale s re tail t rade Trans port servi ces Othe r ma nufa ctur ing Chemi cals rubb er a nd p lastic Pape r and w oodFood Elec trici ty Trans port e quipme nt Met al p roduct s Rice a nd c rop s Gas Othe r mi neral s Text ile Iron a nd steel Elec tronic dev ices Cru de oi l
The projected framework can only account for the influences of the relative supply of different skills and demand effects due to changing income levels and specialisation patterns, but not the effect of skill-biased technical change and institutional settings. Over the next half century educational attainment will continue to improve, increasing the supply of skilled labour. This leads to downward pressure on the skill premium in the model framework. However, as shown in Braconier et al. (2014) continued skill-biased technological progress, with rapidly rising demand for higher skills, is likely to outpace the increase in the supply of skills, leading to increased wage inequality over the next 50 years. 4.2. The speed of up-skilling in emerging economies influences GDP, trade
and specialisation
The speed of up-skilling has important implications for trade and specialisation across countries. To highlight this, this section compares the baseline GDP and trade projection with one in which CII economies are assumed to approach the global frontier level of education much more slowly than in the baseline scenario as described in Section 3.2. Slower accumulation of human capital influences aggregate growth and by 2060 results in a decrease in real GDP by 7% for China, 12% for India and 9% for Indonesia relative to baseline (Figure 10). This underlines the importance of skill accumulation for the development of these countries. There is also a more limited indirect impact in terms of GDP for other countries (less than 0.5%) channelled through capital markets, because lower GDP means less savings and investment.10
The reduction in aggregate growth due to slower accumulation of human capital in emerging economies affects trade across countries especially in CII economies (Figure 11). Indeed, world trade is some 2% lower by 2060 in the slower upskilling scenario as compared with the baseline, mainly driven by decreases in CII economies exports (ranging between 6-11%).
Slower upskilling in CII economies implies that the reorientation of trade and production towards higher value-added manufacturing and services away from lower-skill
Figure 10. Slower up-skilling reduces real GDP, 2005-601 Constant 2004 USD
1. Plain line: baseline scenario; dashed line: lower up-skilling scenario. Source: Authors’ calculations.
2 000 0 4 000 6 000 8 000 10 000 12 000 14 000 16 000 18 000 20 000 2005 2016 2027 2038 2049 2060 China Indonesia India
activities occurs at a slower pace than in the baseline. For instance, in India and Indonesia by 2060 exports of business services and electronics would be 25% and 10% lower, respectively, whereas exports of agricultural goods (e.g. other agriculture, rice and crops, livestock) would be 5% and 15% higher, respectively, compared with the baseline (Figure 12). By contrast, slower upskilling in CII economies implies that advanced economies (e.g. the United States, Japan and the Euro area) maintain their relative competitiveness in products that are intensive in human capital, such as electronics, business services and other manufacturing.
Such a change in export specialisation is driven by developments in skilled and unskilled wages triggered by the slower upskilling in CII economies, which translate into variations in production prices. Slower upskilling in CII economies leads to a shortage of skilled workers relative to unskilled workers, which will increase the relative wage of skilled to unskilled labour as compared with the baseline. As shown in Figure 13, sector production price will vary according to skill intensity, with less skill-intensive sectors facing a decrease in their price and more skill-intensive ones an increase. Differences in the variation of production prices reflect cross-country differences in sectoral demand and factor endowments. In addition, changes in relative wages are not fully translated into changes in production prices due to substitution with other production factors. The induced change in production prices reshape a country’s competitiveness influencing trading partners’ demand for its goods (as well as for goods originating from all other countries).
4.3. Trade liberalisation can increase global trade and growth
This section gauges the impact of two stylised trade liberalisation scenarios on global trade, GDP, industrial structure and wage inequality over the next 50 years, compared with the baseline long-run scenario described above. As described in Section 3.3, one scenario considers strengthened regional integration among a set of current OECD economies
Figure 11. Effects on trade of lower upskilling in emerging economies, 2060 % change in volume of gross exports as compared with the baseline by 2060
Source: Authors’ calculations.
% -14 -12 -10 -8 -6 -4 -2 0 2 4 6 Chil e EFTA Mexi co Canada Othe r Af rica Othe r EU North Afric a Caspi an Unite d Ki ngdomTur key Korea Middle Eas t Othe r Eur ope Unite d Sta tes Othe r La tin Am eric a Euro a rea Rus sian Fe derati on Aus tralia N ew Z eala nd Othe r Asia South Afric a Othe r ASEA N Japa n Braz il WorldChina Indo nesiaIndi a
(e.g. the United States, Canada, Mexico, the European Union, Switzerland, Australia, New Zealand, Japan and Korea), the other scenario considers trade liberalisation on a global basis.
4.3.1. Though gravity factors are key drivers of trade over the long-run, trade policies still matter
As previously highlighted in Fontagné and Fouré (2013) over the next decades changes in GDP will be the main driver of world trade, while changes in trade policies are unlikely to lead to changes of comparable magnitude (Figure 14). For instance, world goods exports are projected to increase on average by some 3.5% annually over the next 50 years due to changes in GDP, demography and other gravity factors, while regional trade and global
Figure 12. Slower upskilling in China, India and Indonesia slows down
their restructuring towards higher skilled activities
% change in volume of industrial exports as compared with the baseline in 2060
Source: Authors’ calculations.
-50 -40 -30 -20 -10 0 0 10 20 30 40 50 % -50 -40 -30 -20 -10 0 10 20 30 40 50 % -50 -40 -30 -20 -10 10 20 30 40 50 % China India Indonesia Bus iness ser vice s Whol esale s re tail t rade Othe r ser vice s Trans port servi ces Trans port e quipme nt Elec tronic dev ices Othe r ma nufa ctur ing Met al p roduct s Gas Cru de oi l Food Othe r ag ricult ureCoal Lives tock Rice a nd c rops Elec trici ty Bus iness ser vice s Whol esale s re tail t rade Elec tronic dev ices Othe r ser vice s Met al p roduct s Trans port e quipme nt Othe r ma nufa ctur ing Chemi cals rubb er a nd p lastic Pape r and w ood Elec trici ty Coal Cru de oi l Lives tock Rice a nd c rop s Othe r ag ricult ure Bus iness ser vice s Othe r ser vice s Trans port e quipm ent Elec tronic dev ices Chemi cals , rubb er Othe r ma nufa ctur ing Met al p roduct s Elec trici ty Food Whole sale s re tail t rade Pape r and w ood Cru de oi l Othe r ag ricult ure Lives tock Rice a nd c rop s Gas
multilateral liberalisation would add around 0.1 and 0.3 percentage points to annual OECD export growth, respectively. Thus, the projections suggest that OECD countries would not be able to keep their current position in world trade simply by moving towards deeper regional integration.
4.3.2. Unevenly distributed increases in trade from trade liberalisation
Projecting the alternative scenarios reveals mostly positive trade impacts across the globe but illustrates the different outcomes of regional versus multilateral approaches to trade liberalisation. World trade (exports) in the regional and partial multilateral liberalisation is 4% and 15% higher in 2060, respectively, but the gains are distributed unevenly across countries or regions in the two scenarios (Figure 15). While the effect of trade liberalisation in FTA members (mostly OECD economies) is to raise trade by around 7-8% in both scenarios, non-FTA members (mostly non-OECD countries) only enjoy sizeable increases in trade in the multilateral scenario. For these economies the increase in
Figure 13. Production prices: Selected sectors, 2060 % deviation from baseline
Source: Authors’ calculations.
Figure 14. Growth in GDP, exports of goods and services (volume), 2012-60
Source: Authors’ calculations.
-8 -4 0 4 8
% China India Indonesia
Livestock Food Iron and steel Textile Trade Business services
0 1 2 3 4 5 6
OECD Other World
GDP Goods exports Services exports Multilateral Regional
trade is only about 1% in the regional liberalisation scenario despite the bilateral agreements they conclude with members of the large FTA area (NAFTA, the European Union, Australia, New Zealand, Japan and Korea). By contrast, multilateral liberalisation could raise their trade by 15% to 30%. An explanation for this is that non-tariff measures (transaction costs in goods and NTM in services) remain stable in the regional scenario, counteracting the reduction in tariffs. Nonetheless, as in the baseline, in both scenarios the bulk of all trade still occurs among non-OECD (non-FTA) countries or regions at the end of the projection period.
This asymmetry in the impact of liberalisation across OECD and non-OECD countries in the two scenarios can be explained by a reorientation of trade and by large trade diversion effects. In the regional liberalisation scenario, a share of potential trade will shift towards members of the FTA (OECD countries) away from non-members (non-OECD countries) (Figure 16). Part of this expansion of trade is replacing former trade of non-members with trade from regional members, as a result of the shift in relative market access conditions. As a result of this trade diversion some non-FTA countries will experience trade losses, particularly those in regions that do not sign a bilateral agreement with the FTA in 2030 (e.g. Africa, Latin America, the Middle East, etc.). By contrast, in the partial multilateral scenario trade is instead reoriented away from OECD countries towards the non-OECD area, reflecting comparatively larger reductions in tariffs than in OECD countries (i.e. given that initial tariff levels in the baseline are higher in non-OECD than in OECD), as well as stronger underlying growth performance in this area.
4.3.3. Trade liberalisation triggers moderate changes in trade specialisation and industrial structure
Trade liberalisation will increase international competition and induce a reallocation of resources across and within countries and industries. However, on the whole, the
Figure 15. Unevenly distributed increases in trade in liberalisation scenarios, 2060 % increase in gross exports as compared with the baseline by 2060, (volume), %
Source: Calculations based on MIRAGE.
% -5 0 5 10 15 20 25 30 35
Full regional Partial multilateral
North Afric a Othe r Af rica Othe r La tin Am eric a Indi a Braz il Caspi an Middle Eas t Turke y China South Afric a Mexi co Rus sian Fe derati on Othe r Asia Othe r Eur ope Korea Indo nesia Aus tralia New Zeala nd Japa n Chil e EFTA Euro a rea USA Othe r ASEA N Othe r Eur opea n U nion Canada Unite d Ki ngdom Wo rld
change over time in the trade specialisation and, in turn, broad industrial structure triggered by deeper trade liberalisation in the two scenarios tends to be moderate compared with that which already occurs in the baseline. One explanation is that the implemented trade scenarios do not introduce any significantly differentiation in trade liberalisation among different sectors. Accordingly, countries’ trade specialisation pattern are not expected to change considerably as compared to the one observed in the baseline (Figure 17). Overall, this suggests that a larger share of the trade-induced reallocation of activities occurs within rather than between industries.
However, the change in trade specialisation in China that occurs in the multilateral scenario deserves a comment. Even though the education level in China will improve significantly over the next 50 years, multilateral trade liberalisation will slightly reinforce the Chinese specialisation in (low-skill intensive) textiles (from 11% to 12%) at the expense of (higher-skill intensive) electronics (34 to 32%). This is a consequence of the initial tariffs that China is facing in developed markets in these two sectors. The tariff on textiles is the highest tariff for manufactured goods that China is facing in Canada (15.3%) and the United States (11.5%) and the second highest in the Euro area (10.9%), with these three regions being significant destinations for Chinese textile products (the share of Canada, the United States and the Euro area in Chinese textile exports are, respectively, 2.5%, 23.5% and 23.6%). By contrast, Chinese electronic devices are facing initially the lowest tariff in the same three regions as well as being widely exported to them. As a result, halving these two tariffs implies a larger gain in revealed comparative advantage for textiles than for electronics, hence influencing the Chinese export specialisation.
Turning to the change in the industrial structure induced by trade liberalisation some interesting patterns emerge. In both alternative scenarios, the industrial structure in the United States tends to shift over time towards agriculture (rice and crops) and food production away from other manufacturing (Figure 18). This reallocation comes about through increased international competitiveness in the export market, reflecting increasing comparative advantage of the United States in this sector due to the combination of abundant arable land with the removal of high levels of agricultural support in some countries in the multilateral scenario. By contrast, the removal of agricultural support in the European Union (in the multilateral scenario) tends to reorient activities in the Euro area
Figure 16. Reorientation of trade towards FTA partners Export shares in world trade based on bilateral gross exports, (volume), %
Source: Calculations based on MIRAGE.
2012 2060 27% 41% 23% 42% 25% 42% Within non-OECD 15%
OECD with non-OECD 38% Within OECD 47% Multilateral Regional Baseline 2060 Within non-OECD Baseline 33% Multilateral 35% Regional 32% Within OECD