Publisher’s version / Version de l'éditeur:
Vous avez des questions? Nous pouvons vous aider. Pour communiquer directement avec un auteur, consultez la première page de la revue dans laquelle son article a été publié afin de trouver ses coordonnées. Si vous n’arrivez pas à les repérer, communiquez avec nous à [email protected].
Questions? Contact the NRC Publications Archive team at
[email protected]. If you wish to email the authors directly, please see the first page of the publication for their contact information.
https://publications-cnrc.canada.ca/fra/droits
L’accès à ce site Web et l’utilisation de son contenu sont assujettis aux conditions présentées dans le site LISEZ CES CONDITIONS ATTENTIVEMENT AVANT D’UTILISER CE SITE WEB.
Paper (National Research Council of Canada. Institute for Research in Construction); no. IRC-P-1606, 1988
READ THESE TERMS AND CONDITIONS CAREFULLY BEFORE USING THIS WEBSITE. https://nrc-publications.canada.ca/eng/copyright
NRC Publications Archive Record / Notice des Archives des publications du CNRC : https://nrc-publications.canada.ca/eng/view/object/?id=02599429-1cfb-48ef-980f-f2562cf3ae1a https://publications-cnrc.canada.ca/fra/voir/objet/?id=02599429-1cfb-48ef-980f-f2562cf3ae1a
NRC Publications Archive
Archives des publications du CNRC
For the publisher’s version, please access the DOI link below./ Pour consulter la version de l’éditeur, utilisez le lien DOI ci-dessous.
https://doi.org/10.4224/20386469
Access and use of this website and the material on it are subject to the Terms and Conditions set forth at
Full-scale fire tests on FRP furniture
S e x
,
'
T B 1 National Research Conseil national~ 2 1 d
I
Council d a ~ e m i w s c a n ~ , no.1 6 0 6
1
c. 2 Institute for lnstitut deB t D G Research in recherche en
-- - Construction construction
Full-Scale Fire Tests
on
FRP
Furniture
by A.K. Kim
Reprinted from
Society of Fire Protection Engineers Technology Report 88-2
p. 1-10
(IRC Paper No. 1606)
N R C
-
CISTII R C
L I B R A R Ybfiy
29
l?@9
B I B L I O T H Z Q U E I R C\
CNRC (- - If l l T NRCC 30520Trois essais de tenue au feu en vraie grandeur ont Ct6 effectuCs pour d6terminer les risques d'incendie que @sentent gois types de meubks en plastique renforcd
A
la fibre de verre( P m
dansun
dortoir. La source d'inflammation utilisCe pow les essais Ctait un feu sirnu16 (avec du propane) de madriaux combustibles qu'on retrouve couramment dans un dortoir. Pow chque essai, on a m e s d les tenqhtures amlsiantes, le taux de degagement de chaleuh, la densie optique dans le conduit ddvacuation et la toxicite des gaz de combustion. Les dsultats ont &montrt5 que, lorsque la porte Ctait fermCe, le d6veloppement du feu Ctait nettement ralenti en raison de l'insuffisance - . - d'oxyg&ne.-
Toutefois, les gaz de combustions'accumulant dans la pike
-
' --wants.
Les dsultatsindiquent Cgalement que ' 'on Ctait aetardCe et
FULL-SCALE FIRE TESTS
ON FRP
FURNITURE
Technology Report 88-2 A Peer Reviewed Publication
Society of Fire Protection Engineers 60 Batterymarch Street Boston, Massachusetts 02 1 10
A.
K.
Kim
National Research Council Canada
Institute for Research
in
Construction
1
Publlzher's Notes The publisher invites contributions of materlal for Technology Reports as well as comments on the content of the report,
This report is furnished for the interest of those
seriously studying the fire problem. The views pre- The publication Is copyrighted d 1988, Soclety of sented are those of the auhor and do not carry Fire Protection Engineers. 60 Bafterymarch Street, the endorsement of the Society of Fire Protection Boston, MA 02 1 10. Those desiring pennisslon to Engineers. The Society is not responsible for the reproduce the material in whole or in part shall technical accuracy or the content of this report. consult the Society of Fire Protection Engineers.
FULLSCALE FIRE TESTS ON FRP FURNITURE
National Research Council Canada Institute for Research in Construction
Introduction
In dormitory-type housing, such a s university residences or penal institutions. the building is
compartmentalized to minimfie fire spread from one room to another. A severe f i e in one room. however, could still spread to other parts of the building, causing substantial damage to the building and posing a serious risk to residents. The severity of a room fire would depend on the contents of the room, interior lining materials, and ventilation. In many dormitories, the rooms contain simple furnishings. which are often made from fire-retardant materials.
To provlde a way to study the fire hazard contributed by any combustibles in a dormitory.
including interior lining material, a facility for conducting full-scale room b u m tests was built at the National Fire Laboratory. National Research Council of Canada (NRCC). This facility consists of a concrete-block room, a hood and an exhaust duct with a fan. and various instruments. A pro- pane sand burner is also included and used to simulate an ignition fire. The facility allows the room temperature, heat-release rate. optical den- sity and toxicity of fire gases. and heat flux to be measured in a full-scale room b u m test. It also permits flame spread and the room fire growth to be studied in a realistic setting.
Full-scale room b u m tests were carried out in
Threefill-scalefie tests were carried out to study the incrementalfie hazard in
a dormitory room contributed by three dlferent types of Fiberglass Reinforced
Plastic (FRP1rni.s
hings.
Asimulation (using propane) of afire involving combus-
tible materials normally found in a dormitory room was used as an ignitionfire
in
the fill-scale tests. In all tests, room temperatures, heat-release rate, optical
density in the exhaust duct, and toxicity of the fue gases were measured. The
results showed that when the door was closed the f i e growth was severely
hindered due to lack of oxygen. However, the fue gases that accumulated in the
room posed an extreme hazard to the occupant. The results also showed that when
afire retardant was used infimiture, ignition was delayed and thefimiture's
contribution to room-
fue severity was reduced.
I
i
I
+ Society of Fire Protection Engineers
this facility to compare the fire hazard in a do&- tory room created by three different types of Fibreglass Reinforced Plastic (FW) furnishings. Prior to the furniture bums. preliminary tests were conducted to determine the type and sever- ity of a fire involving combustible materials nor- mally found in a dormitory room. Afire ofthis type was then simulated using a propane sand burner.
In the following tests. FRP furnishingsmade from three dserent types of fire-retardant material were burned in the test room using the simulated flre a s the ignition source.
This report describes the full-scale room bum facility at the National Fire Laboratory. NRCC,
and also gives the description and the results of the full-scale flre tests on FRP furniture.
Test Room
I
The test roDm was built according to the ASTM "Proposed Method for ROOM FIRE TEST OF WALL AND
CEILING MATERM AND ASSEMBLIES* [I]. The interior
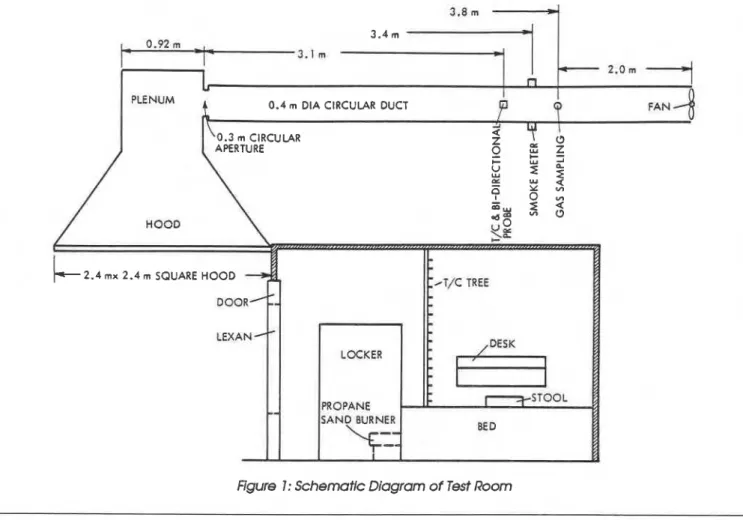
floor dimensions were 2.44 m by 3.66 m. and the ceiling height was 2.44 m. The test room was a concrete-block structure with a concrete floor. The interior surfaces were covered with calcium- silicate boards having a density of 736 kg/m3 and a nominal thickness of 12 rnm.
The room had one 0.76 m by 2.03 m doorway in the center of one of the 2.44 m by 2.44 m walls. No other openings existed. A plywood door (cov- ered with Fiberfrax on the inside surface) was installed in the doorway. The central 0.8 m x 1.0 m portfon of the door was covered with polycar- bonate glazing to allow viewing of the interiorwith the door closed. A gap of approximately 30 mrn was left between the bottom of the door and the
sill.
A schematic drawing of the experlrnental set- up is shown in Fig. 1. At the top of the doorway. immediately adjacent to the exterior wall. a hood was installed to collect the combustion products leaving the room. The hood measured 2.4 m by 2.4 m. with a depth of 1.1 m. The hood was
2.4 rnx 2.4 m SQUARE HOOD
Figure 1: Schematic Diagram of Test Room
FRP Furniture Fire Tests A
-
-
connected through a 0.92 m cubic plenum to a package of matches. 2 parkas, 1 plastic model 0.4 m diameter horizontal exhaust duct with a train, and 1 can of Lysol. Prior to ignition, the can circular aperture of 0.3 m a t the entrance. The of Lysol was sprayed on all combustible materials downstream end of the exhaust duct contained a to create an intentionally severe fire.
fan with a capacity of 2.4 m3/s. The length of the Three tests were carried out in the prepara- horizontal exhaust duct was approximately 6 m. tory series. In Test 1, the combustible materials were purposely arranged to create the most se- Instrumentation vere fire possible (for example, all books, maga- zines, and papers were tom and crumpled, and A thermocouple tree with 24 (26 gauge chromel- the sheets and towels were t o m and spread out).
alumel) thermocouples, located 100 mm apart in In Test 2, these materials were piled in the test the vertical direction, was placed at the center of room without consideration of the arrangement. the room. A thermocouple and a bi-directional Test 3 was devised to simulateTests 1 and 2 using velocity probe were installed in the center of the a propane sand burner (300 rnm x 300 mm size)
exhaust duct. approximately 3.6 m from the with no solid combustibles in the room.
center of the hood, and a laser smoke meter was Tests 1 and 2 commenced with the ignition of placed in the duct approximately 0.3 m down- the combustibles by a pilot light in a comer far- stream from the thermocouple location. thest from the door. Test 3 was started by spark
Two gas-sampling ports were provided, one a t ignition of the sand burner.
the side of the room approximately 1.2 m above It was hypothesized that in a real fire situ- the floor, the other in the exhaust duct approxi- ation. e.g.. one created intentionally by a n occu- mately 4.3 m downstream from the center of the pant in a prison. the door would be kept closed at hood. The CO and CO, concentrations were con- the beginning and it would take approximately 3 tinuously monitored using a n infrared analyzer. min for people outside the room to notice the fire and the 0, concentrations were measured using and open the door. Accordingly. for the initial 3 a paramagnetic oxygen analyzer. Additional gas min of each test, the door was left closed, and the samples were taken in evacuated flasks from the temperatures and the concentrations of CO, CO,.
room and from the exhaust duct, and then proc- and 0, in the room were measured. At 3 min, the essed using a n Ion Chromatograph. door was opened and left open for the remainder
of the test.
Description of Tests Gas temperatures, velocities. and concentra- tions of CO. CO,. and 0,. and the optical density The tests were carried out in two phases. The first in the exhaust duct were continuously measured phase consisted of three preparatory tests (Tests following the opening of the door. Concentrations 1. 2, and 3) aimed at studying the burning of of CO. CO,, and 0, in the room were also meas- combustible solids usually found in a dormitory ured at the sampling port at the side of the room. room. These 'typical" fires could then be sirnu-
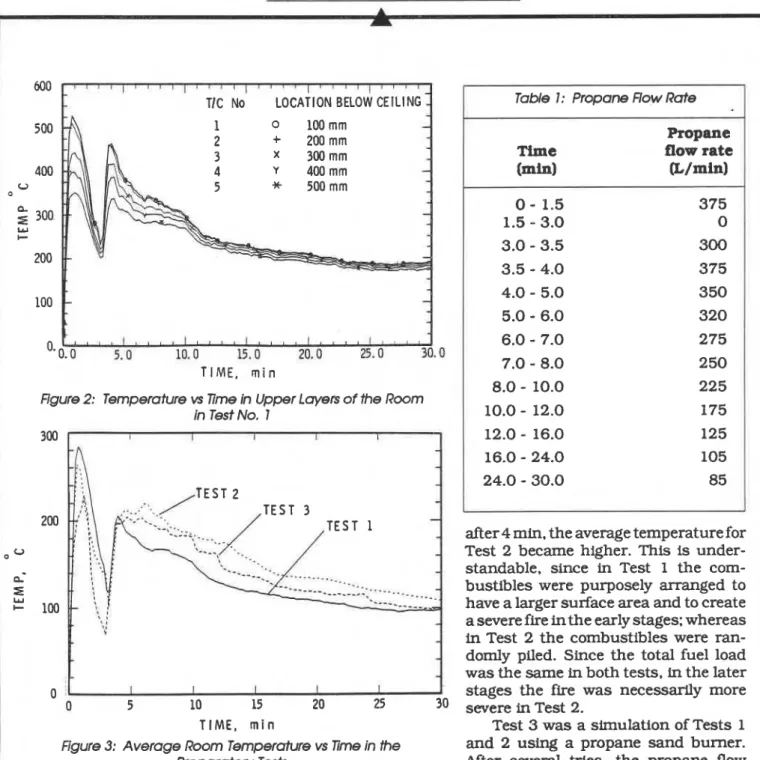
lated by a propane sand burner. The simulated Results: Figure 2 gives the temperature histories
fire then became the ignition fire in the second at the locations of the upper five thermocouples in
phase tests. The second phase consisted of three Test 1. The peak temperature reached in the room full-scale fire tests (Tests A. B, and C) with three was approximately 500°C, slightly lower than
types of FRP furniture. that needed for flashover. In Test 1, and also in Test 2. the fire developed rapidly. engulfing the PREPARATORY TESTS pile of combustibles within a few seconds of
ignition, probably because of the spraying of the Test Procedure: The combustible materials in combustibles with Lysol. The intense flre lasted the tests consisted of 2 mattresses, 4 towels. 4 for approximately 1 min following ignition, after bed sheets, 2 pillowcases. 2 bedspreads. 2 blan- which flames started to decrease; no flame was kets. 2 pillows. 2 pairs of jeans. 2 jean jackets. 8 visible at 2 1 /2 min. The decrease in fire intensity books. 1 newspaper, 12 magazines. 1 pad of was probably due to the lack of oxygen in the room writing paper. 1 roll of toilet paper, 2 T-shirts. 1 while the door was closed. When the door was
Society of Fire Protecfion Engineers
1 6 1 ( 1 1 B g I I 1 4 J 1 1 1 u 1 1 [ ' 1 u 1 1 1 1 1 1
TIC No LOCATION BELOW CEILING
T I M E , r n i n
Figure 2: Temperature vs Time h Upper Layers of the Room
in Test No. 1
after 4 min. the average temperature for Test 2 became higher. This is under- standable, since in Test 1 the com- bustibles were purposely arranged to have a larger surface area and to create a severe fire in the early stages: whereas
in Test 2 the combustibles were ran-
domly piled. Since the total fuel load was the same in both tests, in the later
stages the fire was necessarily more
0 5 10 15 20 25 30 severe in Test 2.
T I M E , m i n Test 3 was a simulation of Tests 1
Figure 3: Average Room Temperature vs Time in the and 2 using a propane sand burner. Preparatory Tests After several tries. the propane flow rates were determined to approximate the room opened at 3 min. large quantities of smoke from temperature and the heat release rate in Tests 1
the room passed through the doorway. Flames and 2. The variation of the propane flow rate used reappeared in the room and the fire started to in Test 3 is shown in Table 1.
grow rapidly untfl approximately 4 1 /2 min, after Figure 4 shows the concentration of oxygen in which the flames gradually decreased as the the room vs. time for Test 2. In the initial 3 min of combustibles were consumed. the test. the oxygen concentration decreased
The average room temperatures (arithmetic sharply. When the door was opened at 3 min.
average of the 24 thermocouples in the room) for there was a sudden influx of fresh air into the Tests 1 to 3 are shown in Fig. 3. During the initial room. while hot, smoky fire gases exited through period of the tests, the average temperature for the upper half of the doorway. The oxygen con- Test 1 was slightly higherthanthat forTest 2. but centration in the room suddenly increased and
Table I : Propane Flow Rate Propane
Time flow rate
(mhl &/min) 0
-
1.5 375 1.5-
3.0 0 3.0-
3.5 300 3.5-
4.0 375 4.0-
5.0 350 5.0-
6.0 320 6.0-
7.0 275 7.0-
8.0 250 8.0-
10.0 225 10.0-
12.0 175 12.0-
16.0 125 16.0-
24.0 105 24.0-
30.0 85FRP Fumifure Fire Tests
A
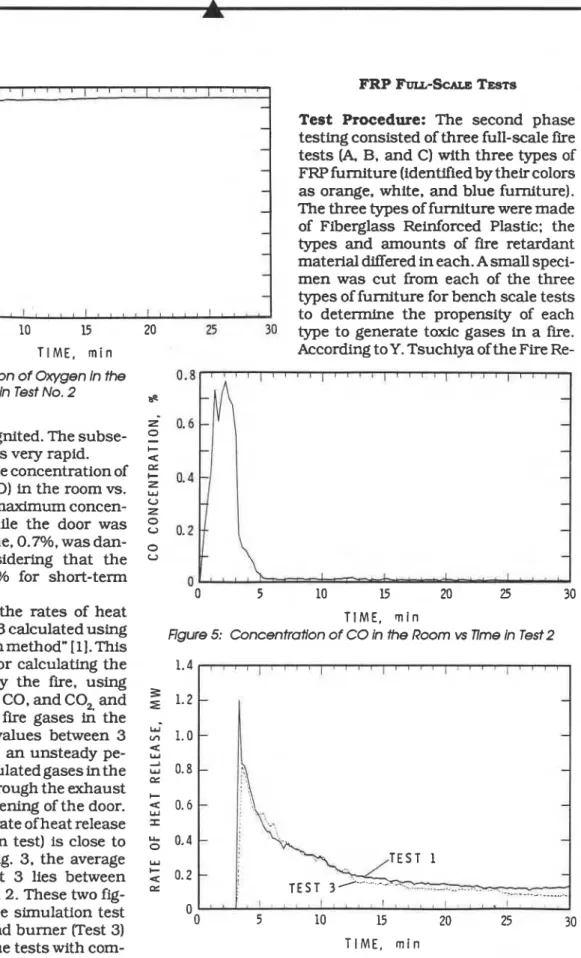
2 2 FRP FULL-SCALE TESTS
2 0
18 Test Procedure: The second phase
testing consisted of three full-scale fire
z' 1 6
o tests (A, B, and C) with three types of
1 4 FRP furniture (idenwed by their colors
2
1 2C a s orange, white, and blue furniture).
5
1 0 The three types of furniture were made8 of Fiberglass Reinforced Plastic; the
o types and amounts of fire retardant
u 6 material Wered in each. A small speci-
0" 4 men was cut from each of the three
2 types of furniture for bench scale tests
0 to detennhe the propensity of each
0 ' 5 10 15 20 25 30 type to generate toxic gases in a fire.
TIME, m i n According to Y. Tsuchiya of the Fire Re-
Figure 4: Concentration of Oxygen in the 0.8 Room vs Time in Test No. 2 s
zi 0.6
the combustibles reignited. The subse-
=
quent fire growth was very rapid. C
u
Figure 5 shows the concentration of
E
omcarbon monoxide (CO) in the room vs.
time for Test 2. The maximum concen-
tration occurred while the door was 0m2
closed. The peakvalue, 0.7%. was dan-
,
gerously high, considering that the
danger level is 0.4% for short-term 0
exposure to CO [2]. 0 5 10 15 20 25 30
Figure 6 shows the rates of heat TIME, n i n
inTest and Figure 5: Concentration of CO in the Room vs 77me in Test 2
the 'Oxygen depletion method" [I]. This
method is suitable for calculating the 1.4
total heat release by the fire, using
Z
concentrations of 0,. CO. and CO, and 1.2
the flow rate of the fire gases the
-
W
exhaust duct. The values between 3 1.0
and 4 min represent a n unsteady pe-
riod when the accumulated gases in the
$
0.8room were moving through the exhaust
+
duct following the opening of the door.
5
0.6A s seen in Fig. 6, the rate of heat release
for Test 3 (simulation test) is close to
;;
0.4that for Test 1; in Fig. 3, the average
C
temperature for Test 3 lies between u 0.2
those for Tests 1 and 2. These two fig-
ures indicate that the simulation test O 0 5 10 15 20 25 30
with the propane sand burner (Test 3)
is representative of the tests with corn- TIME, m i n
Sociefy oi Fire Protecfion Engineers
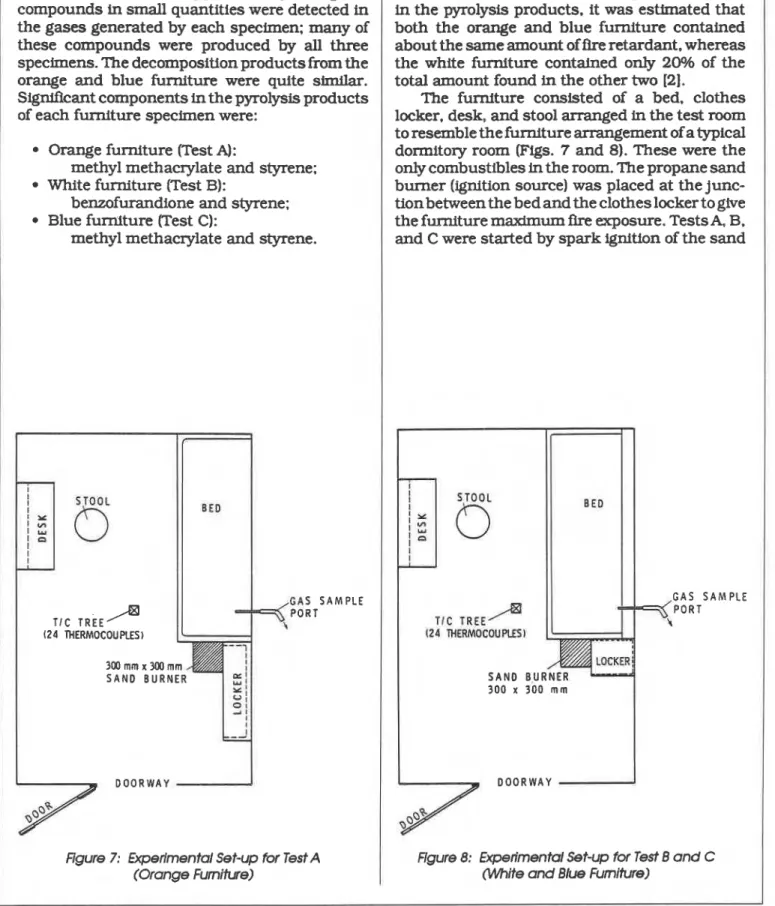
Also. based on the measured quantities of HCl in the py~olysis products. it was estimated that both the orange and blue furniture contained about the same amount of fire retardant, whereas the white furniture contained only 2Wh of the total amount found in the other two [2].
The furniture consisted of a bed. clothes locker. desk, and stool arranged in the test room to resemble the furniture arrangement of a typical dormitory room (Figs. 7 and 8). These were the only combustibles in the room. The propane sand burner (ignition source) was placed at the junc- tion between the bed and the clothes locker to give the furniture maximum fire exposure. Tests& B. and C were started by spark ignition of the sand
G A S S A M P L E P O R T (24 THERMOCOUPtESl
300 x 300 m m
Figure 8: Experimental Set-up for Test B and C
(White and Blue Furniture)
search Section. NRCC. approximately 60 organic compounds in small quantities were detected in
the gases generated by each specimen; many of these compounds were produced by all three specimens. The decomposition products from the orange and blue furniture were quite similar.
Signlflcant components in the pyrolysis products of each furniture specimen were:
Orange furniture (Test A):
methyl methacrylate and styrene; White furniture (Test B):
benzofurandione and styrene: Blue furniture (Test C):
methyl methacrylate and styrene.
BED I I
' z
I W:
I G A S S A M P L E P O R T (24 THERMOCOUPLES)Figure 7: Experimental Set-up for Test A (Orange Furnitwe)
S T O O L
FRP Furniture Fire Tests
A
burner. The propane flow rate to the
burner was controlled to correspond to 1.0 1 I I I I
the heat release rate and duration of the flre created by burning com- I
bustibles in the preparatory tests. Y
The temperatures and the concen-
trations of CO. CO,, and 0, in the room 5 0. 6
were continuously monitored during the tests. Gas temperatures, velocities. +
and concentrations of CO. CO,, and 0,
5
0.-
and the optical density in the exhaust LL duct were also continuously measured, o
following the opening of the door 3 min
;
0.2into the test. Using the sampling port at
2
the side of the room. gas samples were I - * - C ~ - ~ - . also collected in evacuated flasks after 0 I I
--..
--
-- I1 rnin and again after 2.5 min. Subse- 0 5 10 15 20 25 30
quently. few more gas samples from the T I M E , m i n
exhaust duct were collected at irregular
Figure 10: Rate of Heat Release vs 7ime for Three Tests with FRP
Furniture and for the Reference Test (Test No. 3)
Video recordings were made of all tests.
Results
Figure 9 shows the average room temperature vs. time plot for Test A (orange furniture), Test B
(white furniture), and Test C (blue furniture). It was noted from the visual observations that the white furniture burned most fiercely. whlle the orange furniture hardly burned at all. In Test B.
flames started to emerge from the doorway 8 min into the test. and the propane flow was shut off at
10 min. Even without the aid of the propane burner, the white furniture continued to bum fiercely. and flames continued to emerge from the doorway. For this reason the test was terminated at 11 min and the fire was extinguished. The severity of flre with the blue furniture was inter- mediate between the severities recorded with the white furniture and the orange fumi- ture. However, during the first 3 min (when the door was closed). Test C
showed the highest temperature. fol- lowed by Test A and Test B. The fire in the room during this period was un-
0
steady, and fire growth was controlled by the availability of oxygen and not by the amount or type of fuel available.
Following the opening of the door at
3 min. hot fire gases from the room left through the upper part of the doorway while fresh air moved into the room through the lower part. With ventila- tion established. the fire became con- trolled by the amount and type of fuel. Figure 9 shows that from 3 min on. the
0 5 10 15 20 25 30 average room temperature was highest
TIME, m i n in Test B and the lowest in Test A.
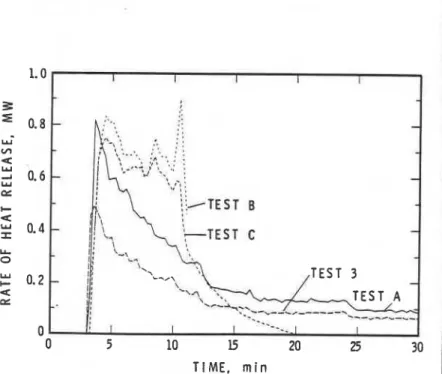
Figure 9: Average Room Temperature vs Time for the Three Tests The rate of heat release for the tests with FRP Furniture and for the Reference Test (Test No. 3) with the three types of furniture is
Society of Fire Protection Engineers
A
shown in Fig. 10. The information was derived which in a 30-60 min exposure is 1500-2000 ppm using the 'Oxygen depletion method." The heat- [2]. HBr has a threshold limit value WVI of 3 ppm
1 release rate inTest A (orange furniture) was small [2]. but no data are available on the concentration compared to that in Tests B and C. The heat of HBr that causes acute toxicity. Even though
I
release rate in Test A was close to that of the there is not necessarily a direct relationship be- ignition fire (Test 3). indicating that the orange tween the TLV and the danger level. assuming '
furniture did not contribute much to the severity that the danger levels of HBP and HCl are in the of the ffre. In contrast. the white furniture ignited same range, one can estimate that the probable quickly and once ignited. contributed signlfi- danger level of HBr. based on t h e m for HBr and
cantly to the room fire. HCl(5 ppm], is approximately 1000 ppm in a 30-
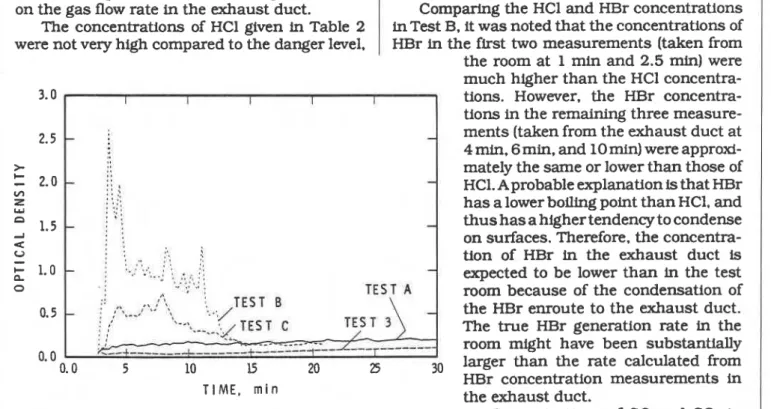
All three types of furniture produced heavy 60 min exposure.
smoke with some toxic gases. For Tests A, B. and The white furniture, which contained benzo-
C,
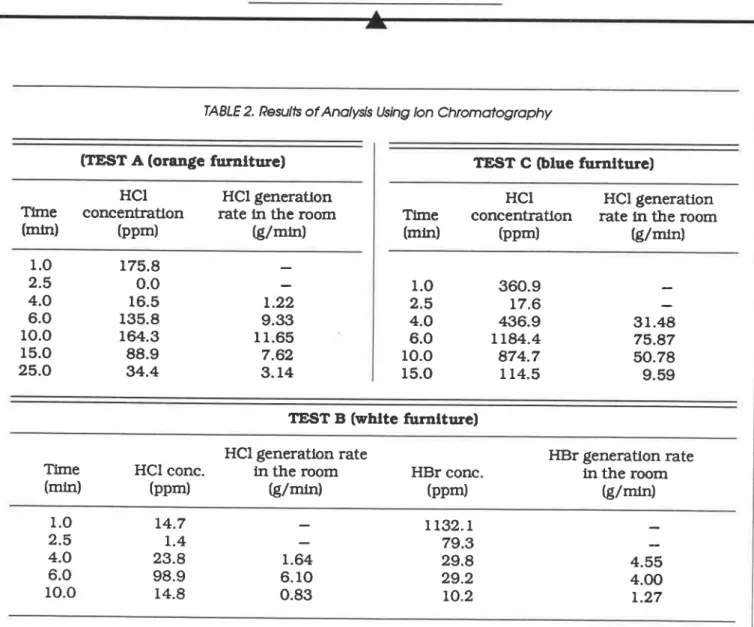
Figure 11 shows the variation of the optical furandione and styrene, produced a particularly density of the fire gases measured across the 0.4 high concentration of HBr for the first minute of m diameter exhaust duct with a Laser smoke Test B. A possible explanation for this high con- meter. The gas flow rate was approximately 0.7 centration is that the furniture was burning m9/s and included some entrained fresh air. fiercely at that time and, with the door closed, all The results of the toxicity tests for the fire the fire gases accumulated in the room. In this gases in Tests A. B, and C are shown in Table 2. test the locker ignited within 30 sec of the test.The primary toxic components were HCl and HBr. resulting in rapid fire development in the room. Gas samples taken at 1 min and 2.5 min repre- The intense fire lasted for approximately 30 sec. sent gas concentrations in the test room with the after which the flames started to decrease until no door closed. The remaining concentrations relate flame was visible at 1 min 10 sec, probably to the samples collected in the exhaust duct. The because of the lack of oxygen in the room. Among latter values were converted into rate of genera- the three types of furniture. only the white furni- tion of these gases in the room. using information ture contained a Br component.
on the gas flow rate in the exhaust duct. Comparing the HCl and HBr concentrations The concentrations of HCl given in Table 2 in Test B. it was noted that the concentrations of were not very high compared to the danger level. HBr in the first two measurements (taken from the room at 1 rnin and 2.5 min) were much higher than the HCl concentra-
3.0
.
I I I I I tions. However, the HBr concentra-tions in the remaining three measure-
2.5
-
-
ments (taken from the exhaust duct at4 min. 6 m i . , and 10 min) were approxi-
>
C mately the same or lower than those of
-
2.0-
:: '-
V) ::; HCl. A probable explanation is that HBr
Z I
.
.'W : ::: has a lower boiling point than HCl. and
n I I :
1.5
-
: :-
thus has a higher tendency to condense2 : :
u on surfaces. Therefore. the concentra-
0 : P ; I
-
' '-
.
, , :: .I.
...
.., . : :: tion of HBr in the exhaust duct is+ 1.0
-
-
P : .. ..,..: I * .
. .
.
...
. , , , expected to be lower than in the testo
room because of the condensation of
0.5 - the HBr enroute to the exhaust duct.
. , The true HBr generation rate in the
room might have been substantially
0.0
0.0 5 10 15 20 25 30 larger than the rate calculated from
HBr concentration measurements in
T I M E , m i n the exhaust duct.
Figure I I : Opffcai Density vs Time for the Three Tests with FRP Concentrations of CO and CO, in Furniture and for h e Reference Test (Test No. 3) the room were dangerously high in all
FRP Furniture Ffre Tests
-
TABLE 2. Results of Analysis Using Ion Chromatography
(TEST A (orange furniture) HCI HCl generation
Time concentration rate in the room
bin) ( P P ~ ) &/mid 1
.O
175.8-
2.5 0.0-
4.0 16.5 1.22 6.0 135.8 9.33 10.0 164.3 11.65 15.0 88.9 7.62 25.0 34.4 3.14TEST C (blue furniture)
HCI HC1 generation
Time concentration rate in the room
(mid ( P P ~ ) (g/min) 1 .O 360.9
-
2.5 17.6-
4.0 436.9 31.48 6.0 1184.4 75.87 10.0 874.7 50.78 15.0 114.5 9.59TEST B (white furniture)
HCl generation rate HBr generation rate
Time HCl conc. in the room HBr conc. in the room
(-1
( P P ~ I
&/-I
( P P ~ ) ( g / r n ) 1 .O 14.7-
1132.1-
2.5 1.4-
79.3-
4.0 23.8 1.64 29.8 4.55 6.0 98.9 6.10 29.2 4.00 10.0 14.8 0.83 10.2 1.27tests while the door was closed. The maximum concentration of CO was between 0.4% and 1.0%.
which is higher than the 0.4% danger level for
short- term exposure of CO. The average concen-
tration of CO, was between 5% and 7%. slightly
lower than the 10% danger limit for short-term exposure of CO, [2].
Even with a sumciently large ignition fire, the
orange furniture did not b u m well. probably
owing to the fire retardant contained in the mate-
rial. However, the blue furniture with the same amount of fire retardant burned reasonably well. This observation can be attributed to the differ- ence in configuration of the two lockers, which were made by two dffferent manufacturers. The orange locker was wide and shallow and had four shelves. whereas the white and blue lockers had only one shelf at the top and were narrower and deeper.
The burning of combustibles depends very much on their location with respect to the ignition
flame. In the tests with FRP furniture, the ignition
source (sand burner) was placed at the junction between the bed and the locker, and the locker was the piece of furniture most severely exposed to the ignition fire. In Tests B and C, the flames impinged directly on the bottom of the top shelf of the locker and on the inside back surface. With the orange locker (Test A), the flames impinged
only superficially on the front surface of the
locker.
Summary
Adescription of the full-scale room b u m facility a t
the National Fire Laboratory. NRCC. is given. This
facility can be used to study the fire performance
Sociefy of Fire Protection Engineers
Full-scale room bum tests were carried out in this facility to study the performance of three different types of FRP furniture (referred to as orange. white, and blue). Combustibles typically found in
a dormitory room were used to produce the igni- tion fire, which was sufficiently large to nearly cause flashover in the room.
According to the hypothetical scenario (door closed for the first 3 min) the occupant would
have been in danger because of high CO and CO, and very low 0, concentrations in the room during the first 3 min, even without any FRP furniture present.
The orange furniture contributedvery little to fire growth, whereas the white furniture burned
vigorously and caused flashover. The incre-
mental contribution to the rate of heat release by the orange furniture (Test A) was approximately
0.3 MW, whereas that for the white and for the blue furniture (Tests B and C. respectively) were
0.45 M W and 0.4 MW. The white furniture (Test
B) produced very heavy smoke compared to the orange furniture (Test A). Measurements showed contributions by the FRP furniture to the optical density to be approximately 0.8 O.D. in Test B.
0.5 O.D. in Test C. and 0.1 O.D. in Test A
Comparing the results of tests with the white and the blue furniture. it was noted that larger amounts of fire retardant in the blue furniture delayed the ignition and somewhat reduced the furniture's contribution to the fire severity. The design of the furniture with respect to the ignition flame was an important factor in the behavior of the furniture in a room-fire condition, a s revealed by the performances of the orange furniture and the blue furniture.
References
1. "Proposed Method for Room Fire Test of
Wall and Ceiling Materials and Assemblies." pp.
1618- 1638, 1982 Annual Book of ASTM Stan- dards. Part 18.
2. Surni, K. and Tsuchiya. Y.."Assessment of Relative Toxicity of Materials Toxicity Index." Paper presented at the International Symposium on Toxicity and Physiology of Combustion Prod- ucts. University of Utah, March 22-26. 1976.
A
Society of Fire Protection Engineers
60 Batterymarch Street
Boston, Mass. 02110
6 17-482-0686
About
the Society
...
Organized in 1950, the Society of Fire Protection Engineers is the professional society for engineers involved in the multifaceted field of fire protection engineering. The purposes of the Society are to advance the art and science of fire protection engineering and its allied fields, to maintain a high ethical standing among its members. and to foster fire protection engineering education. Its world- wide members include engineers in private practice, in industry, in local. regional, and national government, as w e l as technical members of the insurance industry. Chapters of the Society are located in the United States, Canada, Europe. and Australia.
Membership in the Society is open to those possessing engineering or physical science qualifications
coupled with experience in the field and to those in associated professional fields. Benefits of membership include:
W Recognition of your professional qualifi- W American Association of Engineering Socie- cations by your peers ties representation
W Chapter meetings W Insurance plan
W Bulletin- Newsletter with regular features Continuing professional development Prog-
W Technology Reports
W Profile surveys
W Public Information program
W Sharing in activities of committees a t
W Yearbook- biennial directory of members national level
W Attendance a t Annual Meeting and Semi- W Awards program nars
SFPE is the international clearing house for fire protection engineering state of the art advances and information. In addition to the Bulktin and Technology Reports, the Society also publishes
proceedings and special reports.
For additional information about the Society of Fire Protection Engineers..
.
membership...
publica- tions... Annual Meetings...
chapter activities...
continuing education...
contact the executive direc- tor a t the above address.This paper is being distributed in reprint form by the Institute for
Research in Construction. A list of building practice and research
publications available from the Institute may be obtained by writing to the ,Publications Section, Institute for Research in Construction,
National Research Council of Canada, Ottawa, Ontario,
KIA
0R6.
Ce document est distribuC sous forme de tirb-&-part par 1'Institut de recherche en construction. On peut obtenir une liste des publications de
1'Institut portant sur les techniques
ou
les recherches en matikre debitiment en Ccrivant
A
la Section des publications, Institut de rechercheen construction, Conseil national de recherches du Canada, Ottawa