China Urban Pollution Information Disclosure Study (CUPIDS): Socioeconomic Implications of Dirty Industry and a Guide to National Cleandustrialization
By
Yang CHU
B.A. in Economics
University of California at San Diego, 2008
ARCHNES
MASSACHUSETS INSTfTUTEOF TECHNOLOGY
JUN 2
0 2013
U
BRARIES
Submitted to the Department of Urban Studies and Planningin partial fulfillment of the requirements for the degree of
Master in City Planning
at the
MASSACHUSETTS INSTITUTE OF TECHNOLOGY
June 2013
© 2013 Massachusetts Institute of Technology. All Rights Reserved.
A
, I
Author
Department of jrban Sfudies and Planning
May 23, 2013
Certified by
Professor Karen R. Polenske Department of Urban Studies and Planning Thesis Supervisor
Accepted by , , ,
Associate 0;ofessor P. Chr' oph r Zegras *
China Urban Pollution Information Disclosure Study (CUPIDS): Socioeconomic
Implications of Dirty Industry and a Guide to National Cleandustrialization
By
Yang CHU
BA. in Economics
University of California at San Diego, 2008
Submitted to the Department of Urban Studies and Planning
in partial fulfillment of the requirements for the degree of
Master in City Planning
at the
MASSACHUSETTS INSTITUTE OF TECHNOLOGY
June 2013
It is now common knowledge that China's data is bad, and China's environment is
polluted. In this paper I develop a simple pollution intensity index to test China's existing
national and local environmental data, to answer the questions: "Bad" how? "Polluted"
why? And finally: what can be done?
I find that China's existing data is rudimentary, piecemeal, and inaccurate. I find that
government data is not detailed, not transparent, and that non-governmental attempts at
improving data quality and transparency are hamstringed by lack of official support. These
data quality and transparency issues contribute to the intractability of China's industrial
pollution. I also find that a pollution intensity index, like the one I develop and test in this
study, can help policymakers identify pollution hotspots years before the hotspots worsen
into public health emergencies. By running 2010 data through a simple algorithm, I isolate
a pollution hotspot that took the Chinese government until 2013 to discover without this
framework. I show that better and more accurate data, along with a mandate for
continuous monitoring and analysis, can shift the current strategy from pollution control to
pollution prevention, ultimately saving time, money, and lives.
Thesis Supervisor:
Title:
Karen R. Polenske
O RGAN IZATIONS
Thank you: Institute of Public and Environmental Affairs (Jun MA, Jingjing WANG, Matthew Collins, Sabrina Orlins) for being a key contributor to the movement and always answering my questions; Natural Resources Defense Council (Alex Wang, Stephen Leonelli, Joan Hu, Qi WU, Yang LI) for hosting me as an Environmental Law Fellow and continuing to welcome me into your office; Green Camel Bell (Zhong ZHAO, Liping RAN) for taking me into the deep wilds of western China; Green Anhui (Xiang ZHOU, Jun ZHANG) for introducing me to my first cancer village; Blue Dalian (Shuling CHENG) for opening my eyes to China's immense water safety and waste disposal challenges; Green Longjiang (Yadong ZHANG) for letting me observe so many undercover investigations and interviews; AECOM China Sustainability Center (Helena Fu, John Bachmann, Chen DU) for introducing me to how the private sector engages in China's national policymaking.
MIT
Thank you: Tunney Lee for the China Planning Studio which was so central to my MIT experience; Nicholas Ashford for teaching a fantastic class about pollution; Sean Gilbert of MISTI-China for funding my research; Reinhard Goethert for a life-changing China Charrette in Guizhou Tongren; Liyan XU and Weixuan LI for the intellectual conversations; Judy Zheng JIA for the spiritual discussions; Bill D. Wang for being the best "xue zhang" ever; Feng FU for unrivaled patience and good cheer; Louise Yeung for being the voice of reason; the China Clean
Energy Cities Center (Chris Zegras, Cressica Brazier, Ruishan ZHENG) and the China Regional
Analysis Group (Karen Polenske, Ying GAO) for providing me with platforms to pursue serious research.
MENTORS PAST & PRESENT
Thank you: Theodore Huters for invaluable support ever since my undergraduate years; Dongquan HE for introducing me to the wonders of city planning; Bo WEN for introducing me to China's grassroots environmental movement; Alvin Lin, Min HU, and Ruiying ZHANG for authentic leadership and guidance in my career development; Yan WANG for teaching me to approach advocacy with a humorous attitude, and for convincing me to adopt a wonderful stray dog from the courtyard of the Datong Environmental Protection Bureau.
FRIENDS & GREENIES
Thank you: Anthony Suen for the moral support; Kevin Hsu and Steve Andrews for believing in the importance of citizen activism; Paul Kishimoto for on-point commentary and data advice; Michael Davidson and Robert Earley for always timely comic relief; Katie Walsh for introducing me to cool people; and Sustainable John for fun eco-raps and eco-conferences.
FAMILY
And of course thank you: my parents, without whom I would not be the person I am today; my relatives in Shanxi, one of China's most polluted provinces, who inspire me to keep working until no human on earth need suffer the health impacts of dirty production.
INTR flICTI N7
CHAPTER 1 THE CONTYT 8
ENVIRONMENTAL ADVOCACY
ECONOMIC GROWTH
PUBLIC PROTESTS & SOCIAL STABILITY INTERNATIONAL ATTENTION & SAVING FACE
TOWARDS TRANSPARENCY
THE GREEN CHOICE ALLIANCE & IPE POLLUTION DATABASE THE POLLUTION INFORMATION TRANSPARENCY INDEX REPORTING & ADVOCACY
IN SUPPORT OF ENVIRONMENTAL INFORMATION DISCLOSURE GOAL 1. TEST IPE DATA
GOAL 2. EXPERIMENT WITH CURRENT DATA CAPACITY
GOAL 3. RECOMMEND NEXT STEPS
8 8 9 9 10 10 11 12 12 13 13
CHAPTER 2. THE EXPERIMENT 14
METHODOLOGY 14
ABOUT THE DATASETS USED 14
THE CHINA URBAN POLLUTION INTENSITY INDEX 15
SELECTING INDICATORS FOR STATISTICAL ANALYSIS 16
RESULTS 17
URBAN POLLUTION INTENSITY RANKING 17
URBAN POLLUTION INTENSITY STATISTICAL ANALYSIS 18
ANALYSIS 23
POLLUTION INTENSITY 23
URBAN INDICATORS 26
CHAPTER 3. KEY FINDINGS 28
KEY FINDING 1: CHINA'S EXISTING DATA FRAMEWORK IS RUDIMENTARY, PIECEMEAL, AND INACCURATE. 28 KEY FINDING 2: IT IS DIFFICULT FOR A NONGOVERNMENTAL ORGANIZATION TO PROVIDE COMPREHENSIVE DATA
WITHOUT GOVERNMENT SUPPORT. 31
KEY FINDING 3: CHINA'S CURRENT GOVERNMENT INFORMATION COLLECTION LACKS BOTH DATA AND METADATA. 31 KEY FINDING 4: IT IS POSSIBLE TO UTILIZE EXISTING DATA FOR NATIONAL POLICYMAKING DESPITE SHORTCOMINGS. 32
CONCLUDING REMARKS 33
VISION FOR URBAN POLLUTION MANAGEMENT 33
PERMITS 33
MONITORING 33
REPORTING 33
ENFORCEMENT 33
CURRENT URBAN POLLUTION MANAGEMENT PRACTICES 34
LESSONS FOR NATIONAL/INTERNATIONAL POLICY 34
REFERENCES 35
ru~~~~~~ P7RIT17rN1X
7 INTRODUCTION
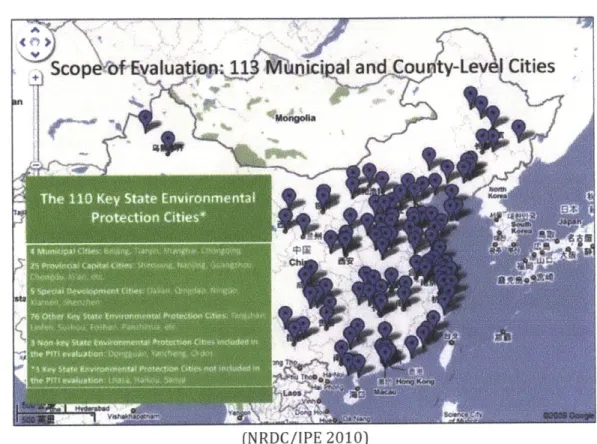
In this thesis I propose a more functional framework for information transparency and data management in China than what currently exists, by conducting a simple experiment to determine what can and cannot be studied with existing pollution data for China's 113 Key State Environmental Protection Cities. I make the case that better data will allow for better policy control of China's pollution situation; I show that preventing pollution is not just desirable, it is possible today.
Chapter 1 provides context for the experiment, including a literature review of recent media reports on China's escalating pollution crisis. Chapter 1 also presents the rationale and goals for this study. Chapter 2 describes the experiment's methodology, results, and includes an analysis. Chapter 3 presents four key findings, or lessons, extrapolated from the experiment that can be applied to improve China's existing information framework. The conclusion closes with final observations and recommendations.
Until now, environmental management in China was largely a top-top discussion, and environmental protection was a developmental luxury to be pursued inasmuch as it benefits economic goals. This pattern can no longer be sustained. The growth-paramount development strategy has plunged China into a minefield of localized pollution problems that threaten the country's public health, social stability, and the very economic growth that it sought to perpetuate. The only way forward is to open up - include more criteria in the definition of success, include more indicators in the monitoring of progress, include more voices in decision-making processes, and hold more stakeholders responsible for protecting their local environments.
Environmental Advocacy
Advocacy in the form of nongovernmental organizations (NGOs) have officially existed in China since 1994 (C. Wu 2002). However, Unfavorable tax laws and a lack of philanthropic culture (Mo 2010) combine to create an atmosphere where small local NGOs are perpetually under-funded. Therefore, while civil society in the United States is supported by local grassroots activism, China's civil society is dominated by the super-privileged. It is only the high-profile international- or Beijing- based organizations with elite connections that have the resources to influence national policy. Furthermore, even the influence of the biggest environmental players is weak because the political validity of environmental concerns is weak - the Ministry of Environmental Protection (MEP) was not established until 2008, and remains largely "toothless" to this day (Wang and Wang 2011).
Economic Growth
It is clear that economic growth is China's top priority (Xinhua 2012). This priority has thus far affected the way that environmental protection indicators are defined as well. "Energy intensity", "carbon intensity", and "water intensity", indicators by which quantitative environmental targets are allocated to sub-national governments, are all defined in terms of units Gross Domestic Product (GDP). At first glance this seems a salutary accounting for the environmental effects of economic growth, and indeed they are enthusiastically touted as such by both government and civil society alike. However this method also means that conservation of these resources is only officially supported when it relates to economic growth; resources can continue to used at increasing rates yet appear to decrease in intensity as long as the GDP figure at the bottom of the intensity ratio grows faster. While accounting for resource use in national policymaking is a step in the right direction, China still lacks a scientific method for allocating the targets (Ma, Can China Do A Better Job Delegating Its 2015 Energy and Emissions Targets? 2011), and monitoring is still dependent on inconsistent reporting by local governments. Meanwhile, experts estimate that the relegation of environmental concerns to economic growth ironically undercuts the economy by generating huge external costs: the cost of coal use was equal to 7.1 percent of
GDP in 2007 (Mao, Sheng and Yang 2008), and cost of environmental degradation was equal to 3.5 percent of GDP in 2010 (Wong, Cost of Environmental Damage in China Growing Rapidly Amid Industrialization 2013).
Public Protests & Social Stability
The weak and elite-dominated landscape of environmental advocacy, along with compromisingly defined, unscientifically allocated, and impossible to monitor environmental indicators, combine to make China susceptible to environmental pollution incidents both acute and chronic including since 2010: the Zijin Acid Leak (NRDC/IPE 2010), the Dalian Pipeline Explosion (Watts 2010), the Songhua Chemical Dump (Bloomberg News 2010), the Dead Pigs Incident (Davison 2013), Cancer Villages (BBC World 2013), etc. In the face of greater public knowledge and communication through cellular technology and social media these large-scale pollution incidents have risen to the fore of public anger, generating a 120 percent growth in environmental protests in the year from 2010 to 2011 alone (Kennedy 2012). Some of these protests have seen success, including the relocation of a chemical plant in Xiamen (Blount 2011), the suspension of a factory project in Sichuan (Bradsher 2012), the disclosure of particulate matter with diameter under 2.5 microns (PM2.5) by Beijing City (Caixin 2012), etc.
International Attention & Saving Face
Most recently, Beijing's infamous Beyond-Index Day (Economist 2013) triggered a morbid worldwide fascination with China's pollution struggles, particularly the impact of air pollution on public health. An estimated 1.2 million deaths in China in 2010 were attributable to air pollution (Wong, Air Pollution Linked to 1.2 Million Premature Deaths in China 2013), and birth defects in coal-polluted Shanxi Province are 18 times higher than in the United States (Ren, et al. 2011). Anecdotal evidence suggests an exodus of talent from China's major cities due to air pollution, particularly with parents concerned for the health of their children (Wong, In China, Breathing Becomes a Childhood Risk 2013). Meanwhile, an estimated 20-30 percent of air pollution in California can be traced to Asia (Cooper 2013), and Chinese air pollution is also shown to kill trees in Japan (Fackler 2013). It remains to be seen if this heightened international attention will prompt China's leaders to take its pollution issue more seriously, just as international pressure over energy and climate issues has accelerated China's clean energy and low carbon policies in previous five year plans. Indeed, the new Premier Keqiang Ll has already vowed to handle the pollution problem with an "iron fist" (The Climate Group 2013).
Towards Transparency
The concerns around social stability, public health, economic damage, and international pressure combine to elevate the pollution issue to the fore of China's environmental concerns. However, solving China's localized pollution problems requires new frameworks for managing information, measuring impacts, improving enforcement, and empowering civil society watchdogs. The Beijing-based Institute for Public and Environmental Affairs (IPE) plays a critical role in promoting environmental management
THE GREEN CHOICE ALLIANCE & IPE POLLUTION DATABASE IPE heads a network of NGOs, called the Green Choice Alliance (GCA), that monitor their local environmental protection bureaus (EPBs) for environmental information disclosure from locations all over China. If any EPBs do not release information to a level required of them by the China State Council's Regulations on Open Government Information and MEP's Trial Measures on Open Environmental Information, the local GCA member will apply to the EPB for disclosure of the unreleased information. The collected information is then delivered to IPE headquarters for aggregation and indexing in the
Pollution Database and Map, widely considered China's first and only Pollutant Release and Transfer Registry (PRTR).
FIGURE 1. LOCATIONS OF GREEN CHOICE ALLIANCE PARTNERS
loan
This map shows the provinces (highlighted in yellow) with presence of Green Choice Alliance partners. (IPE Website 2010)
THE POLLUTION INFORMATION TRANSPARENCY INDEX
Oftentimes the EPBs do not publish information on polluters, nor do they respond to GCA applications for polluter information, which is a direct yet commonplace violation of MEP policy. Other times a rare EPB may disclose information at a level above and beyond what is required. Whatever the EPB performance, GCA members record the experience using a special methodology for evaluating transparency. At the end of every year, IPE and
the Natural Resources Defense Council (NRDC) analyze these transparency ratings to develop a ranking of China's 113 Key Environmental Protection Cities according to environmental information transparency. This ranking is called the Pollution Information Transparency Index (PITI), now in its fifth year. The PITI project receives 100+ media
coverage hits per annual publication, as well as marked attention from city mayors.
FIGURE 2. THE 113 KEY STATE ENVIRONMENTAL PROTECTION CITIEs EVALUATED IN THE PITI
(NRDC/IPE 2010)
REPORTING & ADVOCACY
Aside from maintaining the GCA, the pollution maps, and the PITI project, IPE also plays a thinktank and environmental watchdog role through its own investigative reports. The recent media frenzy against Foxconn's N-Hexane poisoning incidents in China -and Apple Computers' generally irresponsible sourcing practices -was broken through IPE's investigations and subsequent "Poison Apple" campaign (FON, IPE, Envirofriends, Nature U, Nanjing Greenstone 2013). IPE personnel also speak frequently in public education venues and host interns for training in their office. These are rare and valuable acts of public service in a country where the platform for public engagement and understanding of environmental protection activities is so lacking.
FIGURE 3. SELECTION OF IPE REPORTS
iAipk9*Mfi
Top Row: 1) Water Footprint of China's Textile Industry; 2) Health & Environmental Impacts from Lead Battery Manufacturing & Recycling in China; 3) China Air Quality Information Transparency Index. Bottom Row: 1) The First PITI; 2) China Greening - The Emerging Role of
the Public; 3) Poison Apple Campaign Report #5. (IPE Website 2012)
In Support of Environmental Information Disclosure
Due to IPE's important role in promoting environmental protection, public participation, and information disclosure, and because IPE is essentially the only source of reliable information on factory-level pollution in China, I aim to utilize IPE's pollution database in an independent research capacity for the following purposes:
GOAL 1. TEST IPE DATA
Test IPE's data and database practices for comprehensiveness of information and ease of use, from the perspective of an independent researcher.
%*11191 4 VICE*
b.% a4m. Vi (X R. jem 0
GOAL 2. EXPERIMENT WITH CURRENT DATA CAPACITY
Utilize existing data from IPE and from official government publications, to determine the detail and quality of experiments that can reasonably be conducted at the data capacity level in China today. Goal 2 is detailed in Chapter 2: The Experiment.
GoAL 3. RECOMMEND NEXT STEPS
Provide feedback to IPE based on the testing conducted in Goal 1. Also, evaluate the experiment conducted in Goal 2, to gauge the quality of data collection, data availability, and the research that can arise out of such data, for both the IPE platform and China overall. The ultimate goal of this study is to provide a vision for how to establish information transparency in China, an undertaking that requires not just the hardware of data collection infrastructure and exchange platforms, but also socio-economic software in the form of accountability, incentives, and rule of law.
Methodology
ABOUT THE DATASETS USED
I use three sets of data in this experiment: 1) the China Urban Statistical Yearbook (CUSY) for the year 2010, published by the National Bureau of Statistics (NBS); 2) the China National Pollution Database for the year 2010, published by the Institute for Public and Environmental Affairs (IPE); and 3) the China Pollution Information Transparency Index (PITI) for the year 2010, jointly published by IPE and the Natural Resources Defense Council (NRDC).
FIGURE 4. THREE DATASETS COMPRISE THE CHINA URBAN POLLUTION INTENSITY INDEX (CUPII)
CUPH
Pollution IPE Pollution Information
Database Transparency Index
IPE Pollution Database
The IPE Pollution Database is a corporate environmental performance database found in the pollution mapping section of the IPE website. It lists all instances in which a city's industrial units engage in polluting activities without prior approval by the local Environmental Protection Bureau (EPB), as recorded by the EPB.
Even though this is a "pollution database", and even though I will refer to the data derived from this database as "pollution" and "pollution intensity", it is important to note that the pollution level recorded here is not the total amount of pollutants, but rather a
figure that indicates failure of a city's industrial units to comply with the city's pollution ordinances. Data on this "pollution" of all 113 Key State Environmental Protection Cities exist in the IPE Pollution Database. I use only year 2010 data because CUSY, the official urban data from NBS, only covers until 2010 at the time of this study (IPE data already covers until present year 2013).
Pollution Information Transparency Index
The PITI is the "metadata" that accompanies the IPE Pollution Database. It scores the "transparency" of all 113 Key State Environmental Protection Cities when releasing pollution data. This "transparency" is scored on eight metrics, two of which ("records of enterprise violations" and "public information requests") I use for this study. "Records of enterprise violations", is the rating given to EPBs for disclosing pollution records. "Public Information Requests", is the rating given to EPBs for how well they disclose pollution records when a member of the public submits an information request application form.
China Urban Statistical Yearbook
The CUSY contains official government data on urban indicators as recorded by NBS in 2011. This 2011 Yearbook reports urban development data for the year 2010, and includes all 113 Key State Environmental Protection Cities.
THE CHINA URBAN POLLUTION INTENSITY INDEX
Embedded within China's resource intensity formulae for energy, carbon, and water is the implication that economic growth is the basic criteria by which productive activities should be judged. A growth-neutral view of resource intensity must be created to evaluate accurately the sustainability of China's development path. In this section, I describe how the three publicly available datasets mentioned above can be used to generate a China Urban Pollution Intensity Index (CUPII) by which cities can be studied according to pollution instances per industrial unit, as opposed to per unit GDP. The version of the CUPII I develop in this experiment is preliminary, and it will be limited because both the quantity and quality of the data available in China today are limited. However it will provide a framework for thinking about how to design a value-neutral index, and reveal insights into how China's environmental information tracking processes should be improved in order to enable a more accurate analysis and better policymaking than without such a framework.
There is a distinct lack of available and dependable information on the quantity of pollutants at factory, city, provincial, and national scales in China. For the CUPII, I develop a methodology to fill this information gap by meshing disparate datasets from third-party NGOs and also official sources. The pollution levels, along with the figures for "pollution intensity" developed in this manner are approximations for, but likely do not perfectly equal, real pollution levels and pollution intensities in China today. Rather, the pollution intensities I developed are best for determining relative pollution management practices among the 113 Key State Environmental Protection Cities, and can be a powerful way to rank the cities, as well as to determine correlations between pollution intensity and other urban indicators. The steps for creating this CUPII are as follows.
STEP 1
Use the IPE Pollution Database to find reported pollution instances for all 113 cities in the year 2010 at current transparency levels. Weigh these reported pollution instances by the 2010 PITI transparency ratings for each city, to find pollution instances for all 113 cities in the year 2010 at a projected 100% transparency level.
The formula for doing this is: [(CityTransparency)/46=(CityReported)/total], where 46=maximum transparency rating for metric 1 and metric 8 in the PITI, and total=estimated real violations per city in 2010.
STEP 2
Use CUSY to find the official number of industries for each of the 113 cities in the year 2010. Divide total as calculated in Step 1 by this official count to determine intensity,
where intensity is the average rate of pollution instances per industrial unit per city in
2010. STEP 3
Analyze intensity: rank the cities by level of pollution intensity; isolate the 20 cities with highest (10) and lowest (10) pollution intensity, and map them to show patterns in geographic location. Use statistical analysis to determine if there is correlation between intensity and other indicators as reported in CUSY.
SELECTING INDICATORS FOR STATISTICAL ANALYSIS
The China Urban Statistical Yearbook (CUSY) published by the National Bureau of Statistics (NBS) typically contains about 50 indicators of development. In this experiment I use 24 indicators, some imported directly from the statistical yearbook, and some derived from sections of the yearbook through simple calculations. The sections used are: CUSY2-1
(population), CUSY2-12 (urbanization), CUSY2-13 (GDP), CUSY2-15 & CUSY2-16 (industrial breakdowns), CUSY2-23 (revenue breakdowns), CUSY2-31 (public services), CUSY2-36
(information), CUSY2-37 (resource use), CUSY2-40 (sustainable economy), and CUSY2-41 (industrial emissions).
I discuss the findings, including details of the individual indicators and results of the statistical analysis, in the next section.
Results
URBAN POLLUTION INTENSITY RANKING
FIGURE 5. 113 KEY STATE ENVIRONMENTAL PROTECTION CITIES RANKED FROM BEST TO WORST
POLLUTION INTENSITY
RANK CITY INTENSITY RANK CITY INTENSITY RANK CITY INTENSITY
1 Tai'an 0.7% 39 Nantong 6.5% 77 Xian 19.7%
2 Dabian 0.8% 40 Changsha 6.6% 78 Changde 20.1%
3 Yichang 1.1% 41 Tianjin 7.0% 79 Bao 20.2%
4 Weiha 1.3% 42 Fuzhou 7.0% 80 Xuzhou 22.0%
5 Jiuliang 1.4% 43 Qingdao 7.3% 81 Benxi 22.4%
6 Xiamen 1.5% 44 Rizhao 7.3% $2 Ordos 23.6%
7 Hefei 16% 45 Wenzhou 7.4% 83 Dongguan 23.7%
8 Nanchang 1.7% 46 Jilin 7.6% 84 Quanzhou 24.2% 9 Zhuhai 1.7% 47 Yangzhou 7.7% 85 Hangzhou 26.2%
10 Yantai 1.7% 48 Suzhou 8.5% 86 Hohhot 27.0%
11 Anshan 1.9% 49 Shaoxing 8.6% 87 Jinzhou 27.5%
12 Jinan 2.1% 50 Guangzhou 8.6% 88 Jiaozuo 30.6%
13 Wuhu 2.7% 51 Foshan 9.1% 89 Tangshan 31.4%
14 Xiangtan 2.9% 52 Manyang 9.2% 90 kUrnq 31.5%
is Qujing 3.0% 53 Baoding 9.3% 91 Qinhangdao 31.8%
16 Yueyang 3.2% 54 Changzhou 9.3% 92 Panzhihua 34.1% 17 Changchun 3.2% 55 Shantou 9.6% 93 Mudanjiang 37.8%
18 Jning 3.5% 56 Chifeng 9.7% 94 Nanjing 39.6%
19 Wuhan 3.7% 57 Maanshan 10.8% 95 Zunyi 39.8%
20 Huzhou 3.9% 58 Kunming 11.2% 96 Ketamayi 42.7% 21 Zaozhuang 4.1% 59 Weltang 11.5% 97 Guiyang 48.2% 22 Jiaxing 4.3% 60 Chngng 11.9% 98 Handan 48.7% 23 Jinzhou 4.4% 61 Yancheng 12.5% 99 Luoyan 52.2%
24 Zibo 4.6% 62 Baotou 13.3% 100 Beihai 61.7%
25 harbin 4.7% 63 Fushun 13.3% 101 YIbin 64.0%
26 Zhuzhou 4.9% 64 Nanning 13.6% 102 Yan'an 70.4%
27 Zhangliaise 5.3% 65 Lanzhou 14.4% 103 Changzhi 72.0%
28 Nigbo 5.4% 66 Luzhou 14.6% 104 Datong 77.5%
29 Shenyang 5.5% 67 Kaiteng 14.6% 105 Taiyuan 115.2%
30 Anyang 5.6% 68 Dqng 14.7% 106 X gning 116.7%
31 Zhengzhou 5.7% 69 Beijing 14.7% 107 Linfen 126.9%
32 Chengdu 5.7% 70 Xianyang 15.0% 108 Tongchuan 127.9%
33 Zhongshan 5.7% 71 P 15.9% 109 Shijazhuang 145.3%
34 Lluzhou 5.9% 72 Lianyungang 16.7% 110 Yangquan 164.9% 35 Taizhou 6.2% 73 Shaoguan 16.8% 111 Shizuishan 170.2%
16 Shenzhen 6.3% 74 Qiq er 18.1% 112 Yinchuan 190.4%
37 Shanghai 6.4% 75 WuxI 18.5% 113 J lnchang 298.7%
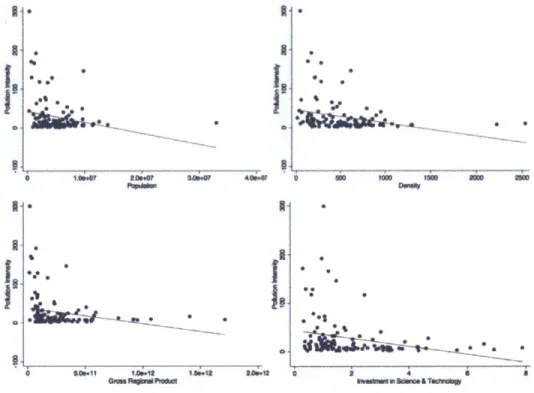
URBAN POLLUTION INTENSITY STATISTICAL ANALYSIS NEGATIVE CORRELATION
Four indicators are negatively correlated with pollution intensity: Density2, Gross Regional Product3, and Investment in Science & Technology4.
FIGURE 6. URBAN INDICATORS NEGATIVELY CORRELATED WITH POLLUTION INTENSITY
Population1, 00 0' L -*0MIU 0 - & 0 0347 tfto.0 307W 4.0p* *M PA"0MA I I
I,
I-I I-I
je
*. 0' ~ 0 -~>..j
0 - 1~O I~W ~D U~ Dgnot~ * 0 * 05 2 4 S kw.owdw~SumaeS 1ocIw~That is: more people, higher density, higher gross regional product, and higher investment in science and technology initiatives are all factors related to a city having fewer instances of pollution not previously approved by the local EPB. The opposite is true: fewer people, lower density, lower gross regional product, and lower investment in science and technology initiatives are all factors related to a city having more instances of pollution
not previously approved by the local EPB.
1 I define the Population indicator CUSY2-1 (coded "pop") as people per city's municipal area measured at the end of 2010.
2 1 define the Density indicator CUSY2-12 (coded "density") as number of people per square
kilometer residing in the municipal area.
3 1 define the Gross Regional Product indicator CUSY2-13 (coded "GRP") as total value of production for the municipal area in the year 2010.
41 derive the Investment in Science & Technology indicator (coded "expendscitech") from CUSY2-23 by dividing the amount of Chinese Yuan (CNY) spent on "Science & Technology" programming for each municipal area in the year 2010 by the total amount of city expenditures for each municipal area, then multiplying by 100 to find percent.
U U I 'U
I
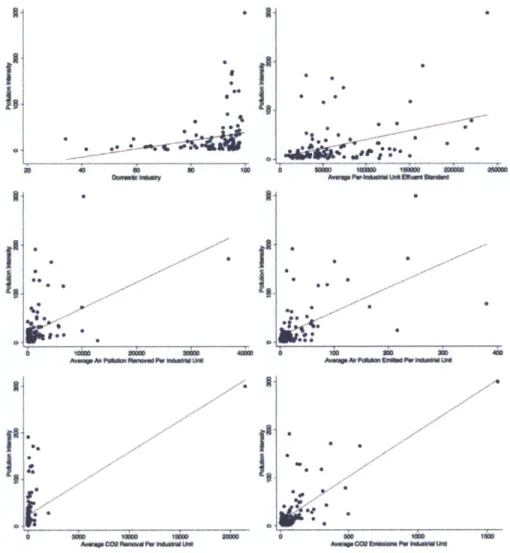
IPOSITIVE CORRELATION
Six indicators are positively correlated with pollution intensity: Domestic Industry5, Average Per-Industrial Unit Effluent Standard6, Average Air Pollution Removed Per Industrial Unit7, Average Air Pollution Emitted Per Industrial Unit8, Average C02 Removal Per Industrial Unit9, and Average C02 Emissions Per Industrial Unit10.
s I derive the Domestic Industry indicator (coded "sharedomestic") from CUSY2-16 by dividing the number of domestic industrial units by the number of total industrial units for each municipal area in the year 2010, then multiplying by 100 to find percent. I use this transformation to adjust for the different sizes of each city's industrial base (that is, two cities that are equally balanced in domestic vs. foreign industry may have one city register as hosting more domestic industry units if that city has more industrial units overall).
6 1 derive the Average Per-Industrial Unit Effluent Standard indicator (coded
"effluentstandavgper") from CUSY2-41 by dividing the municipal cap for industrial effluent in tons by the number of industries in the municipal area. This transformation is to adjust for the different sizes of each city's industrial base (that is, the same industrial effluent cap applied to two cities with different levels of industrial activity actually indicates different stringencies of industrial effluent standards).
7 I derive the Average Air Pollution Removed Per Industrial Unit indicator (coded
"indairremovavgper") from CUSY2-41 by dividing the total amount of "industrial smoke and dust" removed from all industrial units in the municipal area in tons by the total number of industries in the area. This transformation is to adjust for the different sizes of each city's industrial base (that is, the same amount of air pollution removed reported by two cities with different numbers of industrial units actually indicates different levels of average air pollution removal).
8 1 derive the Average Air Pollution Emitted Per Industrial Unit indicator (coded "indairemitavgper") from CUSY2-41 by dividing the total amount of "industrial smoke and dust" emitted from all industrial units in the municipal area in tons by the total number of industries in the area. This transformation is to adjust for the different sizes of each city's industrial base (that is, the same amount of air pollution emissions reported by two cities with different numbers of industrial units actually indicates different levels of average air pollution emission).
9 1 derive the Average C02 Removal Per Industrial Unit indicator (coded "indco2removavgper") from CUSY2-41 by dividing the total amount of C02 removed by all industrial units in the municipal area in tons by the total number of industries in the area. This transformation is to adjust for the different sizes of each city's industrial base (that is, the same amount of C02 removal reported by two cities with different numbers of industrial units actually indicates different levels of average carbon reduction achieved).
10 1 derive the Average C02 Emissions Per Industrial Unit indicator (coded
"indco2emitavgper") from CUSY2-41 by dividing the total amount of C02 emitted from all industrial units in the municipal area in tons by the total number of industries in the area. This transformation is to adjust for the different sizes of each city's industrial base (that is,
FIGURE 7. URBAN INDICATORS POSITIVELY CORRELATED WITH POLLUTION INTENSITY
>
Iu~
*04 j
4 S ~~iAi.44 aim ~-1~~ 9 4 4 0'1
Ii II*1
I
iii
A Note On CO2Although the correlation between Average C02 Removal Per Industrial Unit and Pollution Intensity is positively correlated at the 95% confidence interval according to the outputs of the statistical analysis (Appendix I), creating a plot of the fitted line against the data points shows that there is an outlier city. Referring back to CUSY2-41 shows that Jinchang, the worst-rated city in the Pollution Intensity Rankings (Figure 1), reported an incredibly high amount of C02 removed: 1,184,058 tons. In contrast, the next highest amount of C02 removed was 962,388 tons, reported by Chongqing which has 7,130
industrial units vs. Yinchang's 55. After dividing C02 removed by total industrial units to calculate the Average C02 Removal Per Industrial Unit indicator, Yinchang's amount
becomes an obvious outlier. To deal with what is likely a reporting error on the part of the Yinchang EPB, I ran a second round of analysis with maxima and minima dropped for this
indicator.
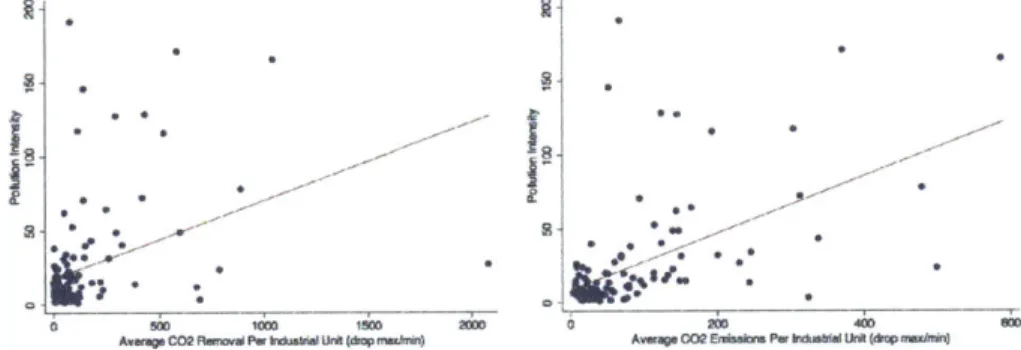
There is a similar outlier city in the plot of Average C02 Emissions Per Industrial Unit on Pollution Intensity, and referring back to CUSY2-41 shows that once again Yinchang
MUD - ~MOio -PWW6rnm~i ii 46 46 60
*
* a .4 4. 0 14660 urn 460 AWr9M PR.m..BPW ImoarntJia 0* 4. 4*F
I-iv
o Sm Vim 6 l 4. 0 4 MO * 1U 7 - 7 0 0 7 *40 Y> milereported an incredibly high amount of C02 emissions. I ran a second round of analysis with
maxima and minima dropped for this indicator. Average CO2 Emissions Per Industrial Unit
is still positively correlated with Pollution Intensity in this second analysis.
Average CO2 Removal and Emissions Per Industrial Unit are both still positively
correlated with Pollution Intensity after dropping maxima and minima.
FIGURE 8. AVERAGE CO2 REMOVAL AND EMISSIONS PER INDUSTRIAL UNIT WITH MAXIMA &
MINIMA DROPPED
NO CORRELATION
Fourteen indicators showed no correlation with pollution intensity at the 95% confidence interval. These are: Per Capita Gross Regional Product"1, Gross Regional Product Growth Rate 12, Urban Built Rate 13, Government Revenues 14 , Government Expenditures 1-, Investment in Education16, Public Library Books Per Capita , Internet
11 1 define the Per Capita Gross Regional Product indicator CUSY2-13 (coded "GRPPC") as average production value in CNY per person in the municipal area.
12 I define the Gross Regional Product Growth Rate indicator CUSY2-13 (coded "GRPGR") as percent rate of growth of total production value in CNY for the year 2010 in the municipal
area.
13 1 define the Urban Built Rate indicator CUSY2-12 (coded "ratebuilt") as urban constructed land area as percent of total urban land area for the municipal area.
141I define the Government Revenues indicator CUSY2-23 (coded "revenues") as amount CNY listed in the city budget as revenues for the year 2010.
is 1 define the Government Expenditures indicator CUSY2-23 (coded "expenditures") as amount CNY listed in the city budget as expenditures for the year 2010.
161I derive the Investment in Education indicator (coded "expendedu") from CUSY2-23 by dividing the amount Chinese Yuan (CNY) spent on "Education" programming for each municipal area in the year 2010 by the total amount of city expenditures for each municipal area, then multiplying by 100 to find percent. This transformation is to adjust for the different sizes of each city's expenditures coffer (that is, two cities that equally emphasize
Connections Per Capita18, Value Generated Through Circular Economy Activities19, Total City-Wide Electricity Use20, Total Electricity Used by Industrial Units21, Share of Total Electricity Attributable to Industrial Use22, Total City-Wide Water Use2 3
, and Share of City-Wide Water Use Attributable to Residential Uses2 4.
17 define the Public Library Books Per Capita indicator CUSY2-31 (coded "PLbooksPC") as
books available per person in the public library systems of each municipal area.
18 1 derive the Internet Connections Per Capita indicator CUSY2-31 (coded "internetPC")
from CUSY2-36 by dividing the number of households with internet connections in the municipal area by the total municipal population to arrive at an indicator of internet access that adjusts for population (that is, two cities with the same number of internet connections may still see one city as relatively lacking internet access if that city has a greater number of people overall and therefore a greater share of people not connected to the internet).
191 define the Value Generated Through Circular Economy Activities indicator CUSY2-40
(coded "threewastesval") as value in CNY of "Value Generated by Production From Comprehensive Reuse of Three Wastes" for the year 2010 in the municipal area. "Circular Economy" seems to be the best way to describe this indicator, though it is unclear from the CUSY data if there is any relationship between the "Comprehensive Reuse of Three Wastes" and the official policy promoting Circular Economy, as there is no meta-data available to inform the user how the indicators are derived and where the figures come from.
20 I define the Total City-wide Electricity Use indicator CUSY2-37 (coded "electricusetot") as total amount of electricity in kilowatt-hours used by the city for the year 2010.
21 1 define the City-Wide Electricity Used by Industrial Units indicator CUSY2-37 (coded "indelectricusetot") as the total amount of electricity in kilowatt-hours used by the city's industries during the year 2010.
22 1 derive the Share of Total Electricity Attributable to Industrial Use indicator (coded "indelectricuseshare") from CUSY2-37 by dividing the total amount of electricity in kilowatt-hours used by industries by the total amount of electricity used for all purposes in the municipal area for the year 2010. This transformation is to adjust for total electricity demand (that is, two cities with the same amount of industrial electricity use may still have different residential to industrial electricity use ratios, and this needs to be captured).
23 1 define the Total City-wide Water Use indicator CUSY2-37 (coded "waterusetot") as total water supplied for all uses in tons for the year 2010 in the municipal area.
24 I derive the Share of City-Wide Water Use Attributable to Residential Uses indicator (coded "sharewateruseres") from CUSY2-37 by dividing the total amount of water in tons supplied for residential uses divided by the total amount of water in tons supplied for all uses in the municipal area for the year 2010. This transformation is to adjust for total water demand (that is, two cities with the same amount of total amount of water supplied for residential uses may still have different residential to industrial water use ratios, and this needs to be captured).
FIGURE 9. URBAN INDICATORs NOT CORRELATED WITH POLLUTION INTENSITY I I It.
Ii..
is 4,' I,. a.1,
~. J~. p I. 3,I,
ii k .4 I a,I.
5'. ~Th. a. a ii.. a.. I,I
ill .1.
1?;~~t~
a, 3. Ji.~&.i~..
4a.
iv ~* L. It' I, Ia~ .. ., iI~ .4 *ai .,.%P..4AM4.A1'
; * . .I,.
r.. p~p. %. iiI,
4 %.1~ ,.~ a,Ia.
'1*. Ua,
I.
Analysis
POLLUTION INTENSITYA few interesting findings can be noted from the pollution intensity ratings and rankings presented in Figure 5.
The most obvious is that the nine worst ranked cities (Jinchang, Yinchuan, Shizuishan, Yangquan, Shijiazhuang, Tongchuan, Linfen, Xining, and Taiyuan) all scored above 100% in the pollution intensity index. In reality there would not be a city with pollution intensity over one hundred percent, as that entails there are more polluting
inaccuracies in the stock data I used to conduct this experiment, which I will discuss in Chapter 3: Key Findings.
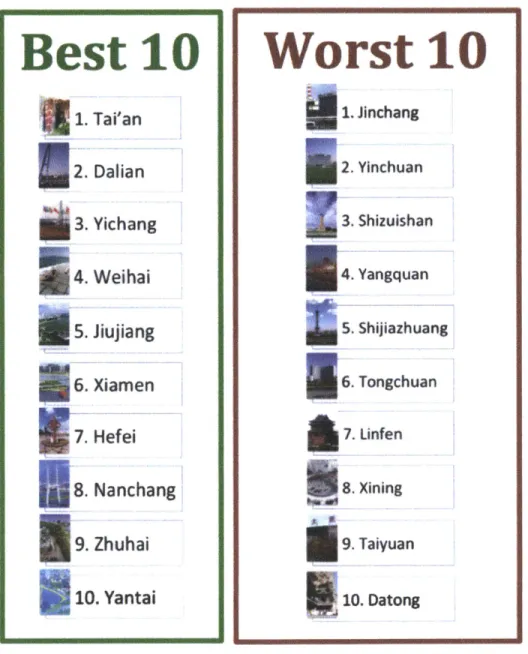
Isolating the 20 cities that scored the lowest (Best 10) and highest (Worst 10) in the Pollution Intensity Index reveals that there may be geographical patterns in city performance. It seems that the Best 10 tend to be more coastal, and the Worst 10 tend to be more inland. In Figure 11 I show with a map of the 10 Best and 10 Worst performing cities that this is indeed the case.
FIGURE 10. BEST AND WORST CITIES RANKING, POLLUTION INTENSITY
24
Best 10
1. Tai'an
2. Dalian
3.
Yichang
4. Weihai
5. Jiujiang
6. Xiamen
I7.
Hefei
8. Nanchang
9.
Zhuhai
10.
Yantai
Worst 10
1. Jinchang
2.
Yinchuan
3. Shizuishan
4. Yangquan
s.
Shijiazhuang
6. Tongchuan
7. Linfen
8. Xining9. Taiyuan
10. Datong
FIGURE 11. GEOGRAPHY OF BEST AND WORST CITIES, POLLUTION INTENSITY
In fact the geographic component of performance disparity is even more severe than I anticipated. Not only are the 10 Best cities all nearer the coast than the 10 Worst, all but one (Yichang) of the 10 Best are linked to one of China's major economic development zones: Tai'an, Dalian, Weihai, and Yantai are part of the Bohai Economic Rim Development Zone; Jiujiang, Hefei, and Nanchang are part of the Pan-Yangtze River Delta Economic Development Region; Xiamen and Zhuhai are located along the Pan-Pearl River Delta Economic Development Chain. The top-performing province is Shandong with three of the Best 10 Cities (Tai'an, Weihai, and Yantai). In Contrast, All of the Worst 10 performing cities are located inland, in the heart of the Greater North China Plains Region. The bottom-performing province is Shanxi with four of the Worst 10 Cities (Yangquan, Linfen, Taiyuan, and Datong). Figure 12 shows the map again with all cities labeled.
Mapping the Worst 10 cities clearly shows that in 2010 the North China Plains was already a severe pollution hotspot housing the country's worst and most unmanageable polluting industries. This problem was finally revealed in 2013 when the Chinese Academy of Geological Sciences found that 77.8 percent of the groundwater in the North china Plains region is polluted beyond the possibility of direct consumption without treatment. 56.6 percent is severely polluted and can only be used "after additional special treatment" (Guo 2013). In response to this pollution emergency, China's national government established a North China Plains Groundwater Pollution Prevention and Control plan and working group. This effort requires the involvement of four ministries; its research phase alone will run until 2015 and monitoring of groundwater pollution is not slated to begin until 2020 (W.
FIGURE 12. GEOGRAPHY OF BEST AND WORST CITIES, LABELED
A national database and system that tracks regional disparities in pollution management, like the China Urban Pollution Intensity Index, could have caught the North China Plains pollution hotspot problem much earlier, perhaps when it first arose. What should have cost a relatively small amount of pollution prevention effort has, in the absence of information transparency, grown into an emergency situation that requires massive deployment of human, capital, and time resources at a national level.
Every day sees the possibility of new pollution hotspots developing, and as in the case of the North China Plains, left unchecked these hotspots may grow into future national emergencies. China needs to break the mold of responding to environmental problems when there is already little recourse. Information collection, monitoring, and disclosure practices need to be developed at all levels to promote pollution prevention, not just pollution control.
URBAN INDICATORS
The urban indicators from CUSY that are statistically correlated with pollution intensity seem to make intuitive sense. A higher residential population housed in a denser more urban environment, greater gross regional product, and higher levels of city investment in scientific and technological programs are characteristics of a more developed city with more economic diversity than cities that are relatively dependent on heavier industries. Other studies in the energy field confirm that economically diverse cities in China are more likely to exhibit greater levels of urban sustainability, particularly in the form of less energy intensive production patterns (Xu, et al. 2002).
In contrast, domestic industries are associated with lower levels of urban sustainability in the form of more energy-intensive production patterns (He and Wang 2007) and worse industrial productivity overall. This also makes sense in the light of
pollution intensity's positive correlation with the Domestic Industry indicator, as well as higher levels of C02 activities, higher levels of air pollution activities, and the need for more
stringent effluent standards, which are all indicators of more active industries.
FIGURE 13. SIGNIFICANT AND INSIGNIFICANT INDICATORS
Significant
Population () Density (-) GRP (- ) Domestic industry (+ Scitech Investments(-Effluent Standards 4+) C02 Prevention (+) C02 Emissions (+)Air Pollution Prevention (+) Air Pollution Emissions (+)
insignificant
U1rb ban Bwt Rate Government Revenues LuUlilTHdl Books ;nt ernet Connections Water tjsednti Wat Use
Electricity Use
IndIu~trial Electricity Use
-n~r~ lttrct s hr CiclrEcnm
The urban indicators from CUSY that showed no significant correlation with pollution intensity were less intuitive. Government Revenues and Government Expenditures, for example, determine what resources a city can access when managing environmental information, and a 2010 study shows a link between these two indicators and a city's PITI score (Lorentzen, Landry and Yasuda 2010).
Indicators directly related to industrial production activities, like Share of Industrial Electricity Use and Share of Residential Water Use (selected because it is the inverse to the share of industrial water use) also would seem to have some correlation with pollution intensity. The Industrial Electricity Use indicator in particular was selected as a proxy for energy, with the hypothesis that a city with an industrial base that uses more energy will likely generate more pollution and more pollution intensity. The lack of correlation between electricity use by industrial units and pollution intensity should not be taken as a lack of correlation between energy and pollution - energy pollutes more in its coal form than its electricity form, but unfortunately there is no indicator within CUSY for industrial coal use. It is worth noting that four of the ten cities as Worst Pollution Intensity (Figure 10) are located in Shanxi Province, where much of China's coal is produced.
Key Finding 1: China's Existing Data Framework is
Rudimentary, Piecemeal, and Inaccurate.
RUDIMENTARY
Official government data from the National Bureau of Statistics (NBS) is collected and shared in a very rudimentary manner in terms of both availability and accessibility. The experiment conducted here is undertaken halfway through 2013, and ideally should have used urban data for the year 2012. However, NBS urban data only runs up to the 2011 report, which covers 2010 data. In contrast, IPE released full 2012 pollution transparency index data in March of 2013, a lag time of only 3 months versus the NBS lag time of 2 years.
The NBS data that is available is difficult to access. In principle the public should be able to download official NBS data from the NBS website at stats.gov.cn, but the download links are broken, rendering the service unusable. Upon consulting with a data engineer, I found that the links can be fixed (or "hacked") through Google Chrome's Website Inspector feature by editing the page elements to undo a line of code that prevents the linked folding lists from displaying, but this is hardly common knowledge. The design of the page impedes access by the general public.
FIGURE 14. SCREENSHOT OF NBS NATIONAL STATISTICAL YEARBOOK WEBPAGE
Moy
LIghtO Chn UeletVloa reeAllrgt eevd
Nepr o b pbleie ayb epouedo rNeml
PIECEMEAL
Nationally, China's State Council has required disclosure of government information since 2008. However, it is the local governments that are responsible for fulfilling this disclosure requirement. Without more detailed local laws and supporting mechanisms, the disclosure practices differ widely by locality and the overall performance of the disclosure policy is piecemeal at best.
The Pollution Information Transparency Index (PITI)'s transparency ratings for the 113 Key State Environmental Protection Cities clearly illustrate this point. Figure 14 shows that compliance differs according to geographic location. Figure 15 shows that in 2010, only the top 11 cities received passing scores for transparency (if non-passing is defined as receiving an "F" grade scoring in the 50-60 out of 100 range or lower), so compliance is extremely lacking.
FIGURE 15. REGIONAL DISPARITIES IN ENVIRONMENTAL INFORMATION DISCLOSURE PRACTICES
132 2009-2010 Average Score
(NRDC/IPE 2010)
LdLo (J LL cc
I:lIj
I
i
iI
Ijhii
][I
]144
os soenansnsususuLocci
n nn no eem o neIN ACCURATE
The lack of uniform disclosure across localities also gives rise to quality control issues during data collection and reporting, making the stock of China's official data ultimately inaccurate. The issue with Yichang's reported amounts for C02 reduction and emissions, which I found problematic during my analysis (discussed in previous "A Note on C02" section), is a more obvious example of one such inaccuracy. Other inaccuracies exist,
notably within energy data (Ma, China's Statistical Challenges Stymie Accountable Development 2011). The results from research conducted with skewed data cannot help but be skewed as well. If China is to improve the efficacy of its data-backed policymaking, it must first improve the accuracy of its stock data.
Key Finding 2: It is difficult for A Nongovernmental
Organization to Provide Comprehensive Data without
Government Support.
The Institute of Public and Environmental Affairs (IPE) is unrivaled as a central repository for pollution information disclosed locally by the Environmental Protection Bureaus (EPBs), and IPE's advocacy work in encouraging EPBs to disclose information is one of their important contributions to the field. However, the fact remains that the accuracy and comprehensiveness of IPE data is dependent upon the accuracy and comprehensiveness of local EPB disclosure practices. My experiment attempted to account for this shortcoming by weighing local EPB data with ratings of local EPB transparency levels, but that is far from ideal. Though the pollution intensities calculated in this way are closer to the true pollution intensities than simply using unweighted EPB data alone, there are clearly still errors (an example as mentioned earlier is that nine cities had pollution intensities over 100 percent, which is not possible in reality).
A national pollution database, in the form of a Pollutant Release and Transfer Registry (PRTR) as exists in other countries, should record total amount of pollutants released for all major industrial units, not just instances of pollution violations as the IPE database records. However a true PRTR requires an overhaul of how pollution is defined and tracked by all EPBs in China, which is not something that IPE can achieve alone.
Key
Finding
3: China's Current Government Information
Collection Lacks Both Data and Metadata.
Within the China Urban Statistical Yearbook (CUSY), there are indicators that touch on important development themes but do not track them in enough detail. The number of
indicators given within CUSY for a category called "Culture". "Culture" is difficult to quantify, and even if quantified by indicators like books and theaters it is then difficult to gauge the accessibility of these goods and facilities to different members of the public. However "Culture" is an important component of urban development.
Another example is number of Internet connections a city has per capita. This indicator was included in the study with the hypothesis that access to information empowers citizens to taken more initiative in their local communities, yielding a diversity of positive impacts including perhaps the watchdogging of polluters. The fact that there is no statistical correlation between Internet connections and the city's instances of pollution not previously approved by the local EPB is interesting but should not be taken to infer anything about the relationship between access to information and citizen engagement. Like the library books indicator, the existence of an Internet hookup does not imply access (the internet itself may be blocked, for example), nor does it imply access to the right information (particularly in cities receiving low scores on the PITI because they fail to publish polluter information on the internet).
While indicators like GDP and population are easy to measure and explain, indicators like culture and information are just as important to track for policymaking purposes. NBS needs to assign more indicators for these themes, and also needs to introduce metadata to accompany data points that may not be as easy to understand due to lack of universal definition. Currently NBS's lack of metadata defining its more complicated urban indicators causes confusion, such as the "Circular Economy" indicator previously discussed in Chapter 2.
Key Finding 4: It is possible to utilize existing data for national
policymaking despite shortcomings.
Despite the challenges in data quality and comprehensiveness noted in Key Findings 1-3, it is important to note that in my experiment, I was still able to generate interesting results with useful implications for policy analysis. The results confirm that higher levels of urbanization are correlated with lower levels of pollution intensity, likely through the greater economic diversity present in urban settings. The results also confirm that there are obvious regional disparities in pollution intensity that follow the classic pattern of the eastern coastal regions developing at the expense of inland regions.
Perhaps most interestingly, my analysis of the pollution-intensity ratings showed that developing a national pollution-intensity index would make possible more timely identification of pollution hotspots in China. As in the case of the North China Plains groundwater pollution crisis, identifying the problem years earlier will enable proactive investments in pollution prevention as opposed to the current (expensive and less effective) method of ex post facto pollution control and response.
In this study I provided an experimental look at China's environmental management disparities across different cities and regions, at current information transparency levels. I also presented a vision of a more open China, and discussed how information transparency can improve China's environment, governance, research capacity, and development path. Information transparency is the only way to enable well-informed decisions and balanced action at all levels; more than anything information transparency is about growing the seeds of trust in a suspicious society, because without trust there is no cooperation and no real harmony.
Vision for Urban Pollution Management
Any city that depends on industrial production as part of its income and jobs generation will have to contend with pollution. What separates a city that manages its pollution and a city that falls victim to its pollution is a strong system of permits, monitoring, reporting, and enforcement.
PERMITS
The city must start with an overall pollution management strategy that clearly sets forth the amount of pollution that can be taken on by the urban environment without resulting in harm to ecology and public health. This amount is then allocated to industrial units in the form of a pollution permit. Pollution permits should contain detailed limits for pollutants, guidelines on how the limits are to be achieved, and monitoring and enforcement protocol.
MONITORING
After the permits are given, the receiving facilities must install monitoring equipment and allocate personnel to ensure that the permit terms are upheld at all times.
REPORTING
Data collected during the Monitoring phase must be reported through secure channels back to the responsible parties within the EPBs. The EPBs must then aggregate and disclose the data in a publicly accessible venue. This requires EPB personnel and likely a software platform.
ENFORCEMENT
When industries violate permit terms, enforcement must occur typically in the form of a fee. The fee must be larger than the benefit derived by the industry for their violation. This requires enforcement personnel either within the EPB or the local law-enforcement agency.
CURRENT URBAN POLLUTION MANAGEMENT PRACTICES
Unfortunately, few if any cities in China have the will or capacity to implement the entire pollution management process described above. Permits are vulnerable to unscientific allocation and negotiation. Typically, the permits themselves are merely certificates designating permission to pollute, with none of the necessary guidelines. Performance monitoring is largely based on self-reporting, which is prone to mis-reporting. The EPBs do not uniformly disclose the collected information. Enforcement also varies, particularly depending on the political clout of the industry in question, and enforcement fees are often too low to discourage pollution.
The quality of China's urban-level pollution data is challenged at every step of the way in the pollution-management process, and there cannot be truly informed decision-making until this issue is resolved.
Lessons for National/International Policy
The pollution issue in China is too large for the national government to tackle alone. It requires participation from citizens, researchers, and enterprises, but this participation is dependent on a level of access to information that does not yet exist. Though the IPE database is an important first step in collecting and releasing this information for public use, the quality of the data is compromised by unscientific non-uniform collection at the urban and regional level.
If the national government does not intend to take over its natural role as provider of a PRTR system for China, it must at least structure its policies to support urban-level improvements in data collection and transfer, so that an NGO like IPE can take over this important work. Passing the 2008 State Council Measures on Open Government Information is not enough - there must be mechanisms deployed at a local level to support implementation of the Measures; in particular there must be funding for developing the technical capacity, for paying the necessary personnel, for trainings and public education campaigns, etcetera. If the national government does not wish to take responsibility for managing and paying for all the pollution management mechanisms required at all levels, it must at least cede to local governments the ability to raise and allocate funding for this important work.
There is a pollution crisis in China, a problem so large and complicated it can only be resolved when the entire society participates. There are other crises as well, in water scarcity, in energy, in public health, in education, in all aspects of society, and all such problems are solved faster and solved more completely when more parties become involved through access to the necessary information. The best time for installing information transparency mechanisms in China was 5,000 years ago. The second best time is today.