HAL Id: inserm-02444365
https://www.hal.inserm.fr/inserm-02444365
Submitted on 17 Jan 2020HAL is a multi-disciplinary open access archive for the deposit and dissemination of sci-entific research documents, whether they are pub-lished or not. The documents may come from teaching and research institutions in France or abroad, or from public or private research centers.
L’archive ouverte pluridisciplinaire HAL, est destinée au dépôt et à la diffusion de documents scientifiques de niveau recherche, publiés ou non, émanant des établissements d’enseignement et de recherche français ou étrangers, des laboratoires publics ou privés.
Systems biology identifies cytosolic PLA2 as a target in
vascular calcification treatment
Jean Sébastien Saulnier-Blache, Trang T.D. Luong, Manousos Makridakis,
Sophie van Linthout, Vasiliki Lygirou, Agnieszka Latosisnska, Ioana Alesutan,
Beate Boehme, Nadeshda Schelski, Dirk von Lewinski, et al.
To cite this version:
Jean Sébastien Saulnier-Blache, Trang T.D. Luong, Manousos Makridakis, Sophie van Linthout, Vasiliki Lygirou, et al.. Systems biology identifies cytosolic PLA2 as a target in vascular cal-cification treatment. JCI Insight, American Society for Clinical Investigation, 2019, 4 (10), �10.1172/jci.insight.125638�. �inserm-02444365�
1
System biology identifies cytosolic PLA2 as a target
in vascular
calcification
treatment
Joost P Schanstra1,2,*, Trang T.D. Luong3,*, Manousos Makridakis4,*, Sophie Van Linthout3,
5,6*
, Vasiliki Lygirou4, Agnieszka Latosisnska7, Ioana Alesutan3,6,8,9, Beate Boehme3, Nadeshda Schelski3, Dirk Von Lewinski10, William Mullen11, Stuart Nicklin11, Christian Delles11, Guylène Feuillet1,2, Colette Denis1,2, Florian Lang12, Burkert Pieske3,6, Jean-Loup Bascands13, Harald Mischak7, Jean-Sebastien Saulnier-Blache1,2,#, Jakob Voelkl3,6,9,#,Antonia Vlahou4,#, Julie Klein1,2,#
* Equal contribution # Corresponding authors : Jean-sebastien.saulnier-blache@inserm.fr jakob.voelkl@charite.de vlahoua@bioacademy.gr Julie.klein@inserm.fr
2
Affiliations :
1
Institute of Cardiovascular and Metabolic Disease, Institut National de la Santé et de la Recherche Médicale (INSERM), Toulouse, France.
2
Université Toulouse III Paul-Sabatier, Toulouse, France. 3
Department of Internal Medicine and Cardiology, Charité – Universitätsmedizin Berlin, Campus Virchow-Klinikum, Berlin, Germany.
4
Biotechnology Laboratory, Centre of Basic Research, Biomedical Research Foundation of the Academy of Athens, Athens, Greece.
5
Charité – Universitätsmedizin Berlin, BCRT – Berlin Institute of Health Center for Regenerative Therapies, 10178 Berlin, Germany.
6 German Center for Cardiovascular Research (DZHK), partner site Berlin, Berlin, Germany. 7 Mosaiques Diagnostics GmbH, Hannover, Germany.
8
Berlin Institute of Health (BIH), Berlin, Germany. 9
Institute for Physiology and Pathophysiology, Johannes Kepler University Linz, Altenbergerstr. 69, 4040 Linz, Austria.
10
Department of Cardiology, Medical University of Graz, Graz, Austria. 11
Institute of Cardiovascular and Medical Sciences, University of Glasgow, Glasgow, UK. 12
Department of Physiology I, University of Tubingen, Germany. 13
Institut National de la Sante et de la Recherche Médicale (INSERM), U1188 - Université de La Réunion, France.
3
Abstract
Although cardiovascular disease (CVD) is the leading cause of morbi-mortality worldwide, promising new drug candidates are lacking. We compared the arterial high-resolution proteome of patients with advanced (n=17) versus early stage (n=15) CVD to predict, from a library of small bioactive molecules, drug candidates able to reverse this disease signature. Of the ~4000 identified proteins, 100 proteins were up- and 52 were down-regulated in advanced CVD. Arachidonyl trifluoromethyl ketone (AACOCF3), a cytosolic phospholipase A2 (cPLA2) inhibitor was predicted as the top drug able to reverse the advanced CVD signature. Vascular cPLA2 expression was increased in patients with advanced CVD. Treatment with AACOCF3 significantly reduced vascular calcification in a cholecalciferol overload mouse model and inhibited osteoinductive signaling in vivo and in vitro in human aortic smooth muscle cells. Finally, long term AACOCF3 treatment also slightly reduced the accumulation of lipids in aortic sinus of ApoE -/- mice fed a high cholesterol diet. In conclusion, using a systems biology approach, we have identified a new compound that prevented typical vascular calcification in CVD in vivo. Apart from the clear impact of this approach in CVD, such strategy should also be able to generate novel drug candidates in other complex diseases.
4
Introduction
Cardiovascular disease (CVD) is the leading causes of morbidity and mortality worldwide accounting for about 32% of all global deaths (1, 2). CVD results from multifactorial causative mechanisms and constitutes a high economic burden on the society and health care system. Typically, CVD including coronary artery disease, stroke, or peripheral artery disease involves endothelial dysfunction resulting from a vascular injury and are characterized by progressive arterial thickening leading ultimately to thrombosis and vascular occlusion. This atherosclerotic process starts with early lipid deposition in the inner layers of the artery walls and progresses to late complications such as fibrosis and calcification. While calcification of arterial intima is associated with plaque rupture and myocardial infarction, calcification of arterial media leads to vessel stiffening, increased pulse-wave velocity, and reduces cardiac perfusion, with the consequence of ventricular hypertrophy and heart failure (3, 4).
Although significant advancements have been made in understanding the pathophysiology of CVD (5), there is still progress to be made to unravel the detailed molecular complexity of the disease and to transform this information into new drug candidates. The extreme complexity and multifactorial character of CVD has prompted researchers to shift from investigating already well known candidate pathways or single molecules to unbiased omics-based studies (6). Omics allows studying the entire “system” simultaneously leading to a better representation of the complex molecular mechanism of CVD (7), thus ultimately to the major aim of identifying truly novel CVD targets. This has resulted in a number of recent omics studies in the field identifying potential biomarkers of CVD (8), but not necessarily resulting in novel drugs yet. The latter could be attributed to the fact that potential targets need to be transformed into drugs which often takes a substantial amount of time and
5 effort, and/or, that most studies employed genomic and transcriptomic strategies which not necessarily translate to changes in proteins, the major drug targets (9).
As a response to the ever-increasing omics data and targeting their optimal use for drug discovery, a number of initiatives have evolved to create a shortcut associating omics molecular signatures to drugs and small compounds. The Connectivity Map (CMap) is the most advanced example of this type of approaches (10) where 564 gene-expression profiles from cultured human cells treated with 164 bioactive small molecules were generated and associated via pattern mining software. This resource was later updated to include associated signatures to 1,309 compounds (https://portals.broadinstitute.org/cmap/). Attempts have been made to use CMap in CVD but were limited to mouse models (11), in
vitro studies (12) or focused on human stem cells (13). Furthermore, none of these studies
tested the therapeutic validity of the selected small CMap molecules.
To our knowledge this is the first effort to identify novel drugs in CVD using drug repurposing based on human molecular signatures. We generated a high-resolution human proteome signature of advanced CVD using peripheral artery samples that allowed the identification of a novel drug candidate arachidonyl trifluoromethyl ketone (AACOCF3), a cytosolic phospholipase A2 (cPLA2) inhibitor. In vivo and in vitro investigations showed that AACOCF3 exerts a potent inhibitory action on arterial calcification.
6
Results
Clinical data of CVD patients used in vessel proteome analysis. For the analysis of the vessel
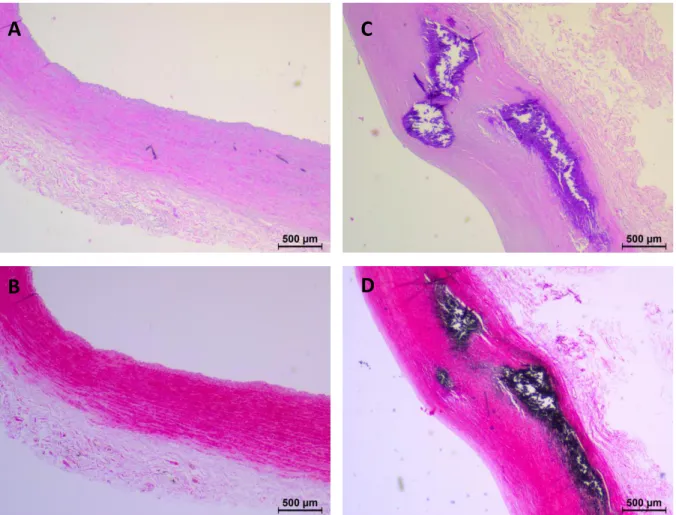
CVD proteome, common iliac, external iliac and superficial femoral arteries from 15 patients with early stage CVD and 17 patients with advanced stage CVD were employed (Table 1). Advanced CVD patients had clear CVD phenotypes (vascular disease, left ventricular hypertrophy, angina pectoris, intermittent claudication, myocardial infraction). These cardiovascular phenotypes were not found in early CVD patients (Table 1). Hematoxylin and eosin-staining (Figure 1 A,C) and von Kossa-staining (Figure 1 C,D) confirmed intima media thickening and calcification in arteries from the advanced CVD group compared to early stage patients. Advanced stage CVD patients were older than early stage patients. The female/male ratio was also different between the groups with almost exclusively females in the early CVD group. The advanced CVD group had a higher proportion of patients with hypertension, diabetes, and nicotine use. The medication of the two groups was very diverse with no clear distinguishable features between the groups (Table S3).
Arterial protein signature of advanced CVD. Proteome analysis of the arteries led to the
detection of about 4000 proteins in total (2500-3500 proteins per patient, detected in at least 60% of samples). Samples were analyzed in two batches and only proteins that were significantly differentially expressed in one batch and displayed the same expression direction in the other batch were selected. This led to the selection of 152 proteins with 100 and 52 that were up and downregulated in advanced CVD, respectively (Table S4). The change in abundance of selected proteins present in the CVD signature (SHMT1, EFEMP1,
7 KDM5D: increase; GUCY1B2: decrease) was confirmed by Western blot analyses of the arteries (Figure S1), supporting in general the validity of the CVD vessel proteome analysis. Pathway analysis with Reactome database (https://reactome.org/) revealed that these proteins mainly participated in: Signal transduction (37%); Transcription (26%); Metabolism (22%); Immune system (22%); Metabolism of proteins (21%) and Developmental biology (18%). Among the 29 proteins involved in Metabolism, 14 were related to lipid metabolism including Sterol regulatory element-binding protein 1 (SREBF1), ATP-binding cassette sub-family A member 2 (ABCA2) and PTB domain-containing engulfment adapter protein 1 (GULP1) involved in cholesterol synthesis and transport. The CVD signature also contains the Protein AMBP involved in calcium crystallization and EGF-containing fibulin-like extracellular matrix protein 1 (EFEMP1) involved in chondrogenesis.
AACOCF3 as a potential drug-candidate for CVD treatment. We next used this 152 protein
signature to identify potential new drug candidates for CVD treatment. Using CMap (10) we screened 1,309 small molecules able to reverse in silico this CVD signature. Among the molecules of the CMap database, 12 were predicted to significantly reverse the CVD signature (Table 2). Among these 12 molecules, arachidonyltrifluoromethane, also called arachidonic acid trifluoromethyl ketone (AACOCF3), an inhibitor of the cytosolic phospholipase A2 (cPLA2), showed the highest negative enrichment score (Table 2). Immunohistochemistry showed that cPLA2 was present in all vascular areas in early and late CVD (Figure S2A). Semiquantitative analysis showed that cPLA2 was significantly more abundant in the intima of advanced compared to early CVD arteries, while no significant difference was observed in the tunica media and the tunica externa (Figure S2B). Western
8 Blot analysis confirmed that cPLA2 expression was significantly higher (1.4-fold) in arteries from advanced CVD patients compared to early CVD patients (Figure 2).
AACOCF3 protects against vascular calcification.
Arterial calcifications are observed during medial calcification and late stage atherosclerosis (4, 14). Vascular smooth muscle cells are important mediators for these calcific processes PMID 29514202. Due to important clinical implications, we have focused our interventional approach on the effects of AACOCF3 in vascular smooth muscle cells.
To evaluate the potential protective effects of AACOCF3 on CVD, experiments were performed in the cholecalciferol (vitamin D3)-overload mouse vascular calcification model without or with additional treatment with AACOCF3. Cholecalciferol overload significantly increased serum calcium, CaxPi product and FGF23 C-term concentrations and reduced serum phosphorus levels to similar levels in both, control or AACOCF3 treated mice (Table
3).
Cholecalciferol overload triggered aortic calcification in mice, an effect significantly attenuated by additional treatment with AACOCF3 (Figure 3A). In control mice, AACOCF3 did not modify aortic calcium deposition. The mRNA level of the gene encoding the most prevalent cPLA2 subtype, cPLA2α (Pla2g4a) (15) was significantly higher in aortic tissue of cholecalciferol-treated mice than of control mice (Figure 3B). AACOCF3 treatment alone did not significantly affect aortic Pla2g4a mRNA expression. Western blot analysis showed that cPLA2 protein was clearly present in the aortic tissue, but no significant change was observed after vitamin D or AACOCF3 treatments (Figure S3).
These effects were paralleled by inhibition of aortic osteo-/chondrogenic signaling by AACOCF3. As shown in Figure 4, cholecalciferol overload significantly up-regulated the
9 mRNA expression of osteogenic transcription factors Msx2 and Cbfa1 and of the osteogenic enzyme tissue-nonspecific alkaline phosphatase (Alpl), as markers of increased osteo-/chondrogenic transdifferentiation in the aortic tissue, effects again significantly ameliorated by AACOCF3 treatment. Thus, AACOCF3 inhibited aortic osteoinductive signaling and vascular calcification in the cholecalciferol-overload mouse model.
To investigate possible mechanisms of the protective effects of AACOCF3 on vascular calcification, further experiments were performed in primary human aortic smooth muscle cells (HAoSMCs) during high phosphate conditions in the presence or absence of AACOCF3. As shown by alizarin Red staining and quantification of calcium deposition, treatment with calcification medium increased calcification of HAoSMCs that was significantly blunted by treatment with AACOCF3 (Figure 5A, B). Similarly, AACOCF3 significantly suppressed phosphate-induced MSX2, CBFA1 and ALPL mRNA expression (Figure 5C-E) as well as ALPL activity (Figure 5F) in HAoSMCs. In control conditions, AACOCF3 did not significantly affect mineralization, but tended to reduce CBFA1 mRNA levels (p=0.202) and significantly down-regulated MSX2 and ALPL mRNA expression in HAoSMCs (Figure 5A-F). Thus, AACOCF3 suppressed phosphate-induced osteo-/chondrogenic transdifferentiation and calcification of HAoSMCs in vitro.
Moreover, phosphate triggered the release of arachidonic acid (AA) in the cell culture medium of HAoSMCs (Figure 5G). Treatment with AACOCF3 significantly inhibited both basal and Pi-induced release of arachidonic acid (AA), the product of PLA2 activity.
To confirm the involvement of cPLA2 in vascular calcification, the endogenous expression of cPLA2 in HAoSMCs was suppressed by silencing of the PLA2G4A gene using siRNA. As a result, transfection with cPLA2 siRNA significantly suppressed PLA2G4A mRNA levels in HAoSMCs as compared to negative control silenced HAoSMCs (Figure 6A). Phosphate
10 treatment up-regulated PLA2G4A mRNA expression in negative control silenced HAoSMCs (Figure 6A). Furthermore, phosphate significantly increased MSX2, CBFA1 and ALPL mRNA expression in negative control siRNA transfected HAoSMCs, effects significantly blunted in cPLA2 siRNA silenced HAoSMCs (Figure 6B,C,D). Taken together, the protective effects of AACOCF3 on vascular calcification may involve, at least in part, inhibition of cPLA2-mediated osteoinductive signaling.
AACOCF3 inhibits arterial lipid deposition. AACOCF3 was tested in another preclinical model
of CVD, the ApoE-/- mice known to develop atherosclerotic lesions. In our conditions ApoE-/- mice fed a high cholesterol diet displayed dyslipidemia (Table 4, vehicle) and lipid deposition (Figure 7A) and increased type III collagen expression (Figure 7B) in the aortic sinus, in agreement with previous reports (16). Ten weeks treatment with AACOCF3 did not significantly modify plasma lipids and glucose levels (Table 4). In contrast, analysis of the aortic root showed that AACOCF3 had no influence on the total plaque area but it significantly inhibited lipid deposition in the plaques (-35%: Figure 7A) compared to vehicle treated mice. In parallel, AACOCF3 significantly reduced type III collagen plaque expression (-16%: Figure 7B) but had no significant influence on total collagen accumulation as assessed by Sirius red staining (Figure S4). In parallel, AACOCF3 did not significantly changed SMA (myofibroblast marker) and slightly increased MOMA2 (macrophage marker) staining (Figure
S4). Finally, AACOCF3 did not significantly change the expression of calcification gene
markers (Alpl and Cbfa1) aortic tissue (Figure S5). Collectively, the experiments using the ApoE-/- mouse model show that AACOCF3-treatment reduces lipid accumulation and collagen accumulation but without reducing inflammation.
12
Discussion
In the present study, we explored the possibility of omics-based disease signature correction by small bioactive compounds to identify and validate in vivo novel CVD drugs. Applying this approach to the high resolution human arterial protein signature of advanced CVD, we identified among >1000 compounds the cytosolic phospholipase A2 (cPLA2) inhibitor AACOCF3 that reversed this CVD signature. AACOCF3 is a cell-permeant trifluoromethyl ketone analogue of arachidonic acid (17) that behaves as a slow- and tight-binding inhibitor of cPLA2 (18–21). A literature screen showed that cPLA2 inhibition has not been used in CVD management yet, suggesting AACOCF3 as a possible novel drug candidate for CVD treatment. Our preclinical analysis of the cholecalciferol-overload mouse model demonstrates that AACOCF3 was efficient in vivo at attenuating vascular calcification, one of the major features of CVD. To our knowledge, our work demonstrates for the first time the protective action of AACOCF3 against vascular injury.
Functional analysis of the proteins present in the human CVD vessel signature highlighted enrichment of proteins associated with cholesterol and lipid metabolism. Moreover, we also detected an increase in EFEMP1, also called Fibulin-3, a protein involved in the regulation of osteo-/chondrogenic transdifferentiation of vascular smooth muscle cells (VSMCs) (22). Because vascular calcification is preferentially associated with advanced stage CVD, we focused on the mechanisms of AACOCF3 in this process. Vascular calcification is mediated, mainly, by osteo-/chondrogenic reprogramming of VSMCs in response to various triggers, especially hyperphosphatemia (14, 23). In liver tissue, excessive phosphate intake in rats is associated with increased arachidonic acid concentrations (24). The osteo-/chondrogenic transdifferentiated VSMCs are characterized by increased expression and activity of osteogenic and chondrogenic transcription factors as well as of osteogenic enzymes such as
13 tissue non-specific alkaline phosphatase (ALPL), leading to active mineralization of the vascular tissue (25–27, 22) . We show here that AACOCF3 treatment attenuates vascular osteo-/chondrogenic transdifferentiation and calcification in vitro and in the cholecalciferol-overload mouse model in vivo. Moreover, vascular cPLA2 expression is increased during calcification conditions, both in vitro and in vivo. Accordingly, osteo-/chondrogenic transdifferentiation of VSMCs during elevated phosphate levels in vitro is blunted by silencing of cPLA2 and, thus, cPLA2 knockdown mimics the protective effects of AACOCF3. These observations strongly suggest that the in vivo protective effect of AACOCF3 may result, at least partially, from its direct action on VSMCs through inhibition of cPLA2-dependent osteoinductive signaling.
There exist multiple PLA2 isoforms classified as secreted (sPLA2) and cytosolic (cPLA2) that have different structures and various physiological functions. PLA2G4A, i.e. cPLA2, is a calcium-dependent cytosolic PLA2. Some secreted isoforms such as the lipoprotein-associated PLA2 (Lp-PLA2) or sPLA2-X or sPLA2-V (28) were shown causative in atherosclerosis and some of their inhibitors were in clinical trials but did not reach the market (29). Expression of cPLA2 has been previously found in arteries from atherosclerotic patients, mainly localized in the intimal regions with an inflammatory infiltrate consisting of macrophages and smooth muscle cells (30). Moreover, a PLA2G4A gene variant was associated with a decreased risk of coronary artery disease, although the functional consequence of the mutation remains still elusive (31). Our results are in agreement with those observations since we found that cPLA2 is indeed present in arteries and its expression is increased in advanced CVD. So far, the use of a cPLA2 inhibitor as a possible drug candidate for CVD treatment has never been proposed.
14 A first limitation of our study is that, for our study, we have deliberately compared patients with advanced vascular disease and early vascular disease. Whilst these features were confirmed by histology, the initial screen was based on presence or absence of risk factors and hence differences in age, blood pressure and other cardiovascular risk factors between the group are present. We cannot rule out that elements of the proteomic data are driven by these risk factors rather than specifically by the vascular phenotype. But by selecting of patients with multiple risk factors and advanced disease we believe that our findings represent a molecular signature of advanced arteriosclerosis, rather than a single risk factor. A further limitation might be that the CVD signature was established from peripheral arteries (iliac and femoral) and cannot necessarily be extrapolated to a CVD signature in other arterial locations. However, our results show that AACOCF3 treatment was efficient in aorta of the animal models suggesting that its protective action is not limited to peripheral arteries and that apparently the molecular mechanisms overlap between these different vessel compartments/segments. We are also aware that the specificity of AACOCF3 for cPLA2 is likely not exclusive. It has indeed been reported that AACOCF3 was able to inhibit cyclooxygenases 1 and 2 (32). However, our results show that the effect of AACOCF3 could be reproduced by cPLA2 knockdown in vitro.
In conclusion, using a systems biology approach to optimally describe the molecular mechanisms of human advanced CVD, we identified a new compound that reversed typical vascular lesions in CVD in vivo. Apart from the clear impact of this approach in CVD, such strategy should be able to generate novel targets in other complex diseases.
15
Methods
Arterial sample acquisition and CVD grading method. 18 common iliac arteries, 15
superficial femoral arteries and 2 external iliac arteries were collected from 15 early and 17 advanced CVD patients with the following specific distribution: early CVD (11 common iliac arteries, 2 external iliac arteries, 4 superficial femoral arteries), advanced CVD (7 common iliac arteries, 11 superficial femoral arteries). All advanced CVD patients had clear CVD phenotypes (vascular disease, left ventricular hypertrophy, angina pectoris, claudication intermittens, myocardial infraction). These cardiovascular phenotypes were not found early CVD patients exhibits (Table 1). Following harvesting, the vascular tissues were snap frozen in liquid nitrogen and stored at -80C until preparation for proteomics analysis. Blood and urine samples were also collected from the same patients for biochemical analysis. The study has been conducted according to the principles expressed in the Declaration of Helsinki. Written informed consent has been given by each patient or representative. The study was reviewed and approved by the local ethics committee (approval number: 26-355 ex 13/14).
Sample preparation and LC-MS/MS analysis. Approximately 10-20 mg (net weight) of tissue
specimens were homogenized in lysis buffer consisting of 0.1 M Tris-HCl pH 7.6 supplemented with 4% SDS and 0.1 M DTE. Homogenization was performed with the bullet blender homogenizer (Next Advance) (33). Ten micrograms of each protein sample were analyzed in SDS-PAGE (5% stacking, 12% separating). Electrophoresis was stopped when samples just entered the separating gel. Gels were fixed with 30% methanol, 10% acetic acid for 30 min followed by 3 washes with water (5 min each) and stained with Coomassie
16 Colloidal Blue overnight. Each band was excised from the gel and further sliced into small pieces (1-2 mm). Gel pieces were destained with 40% Acetonitrile, 50 mM NH4HCO3 and then reduced with 10 mM DTE in 100 mM NH4HCO3 for 20 min RT. After reduction, samples were alkylated with 54 mM Iodoacetamide in 100 mM NH4HCO3 for 20 min at room temperature in the dark. Samples were then washed with 100 mM NH4HCO3 for 20 min at room temperature, followed by another wash with 40% Acetonitrile, 50 mM NH4HCO3 for 20 min at room temperature and a final wash with ultrapure water under the same conditions. Gel pieces were dried in a centrifugal vacuum concentrator and trypsinized overnight in the dark at room temperature, by adding 600 ng of trypsin per sample (trypsin stock solution: 10 ng / μL in 10 mM NH4HCO3, pH 8.5). Peptides were extracted after incubation with the following buffers: 50 mM NH4HCO3 for 15 min at room temperature followed by two incubations with 10% Formic Acid, Acetonitrile (1:1) for 15 min at room temperature. Peptides were eluted in a final volume of 600 μL and filtered with PVDF filters (Merck Millipore) before dried in a centrifugal vacuum concentrator. Dried peptides were reconstituted in mobile phase A buffer (0.1% formic acid, pH 3.5) and processed with LC-MS/MS analysis.
2.5 μg of protein digest were injected from each sample into a Dionex Ultimate 3000 RSLS nano flow system configured with a Dionex 0.1 × 20 mm 5 μm C18 nano trap column. Mobile phase was 2% ACN : 0.1% FA with a flow rate of 5 µL / min. The analytical column was an Acclaim PepMap C18 nano column 75 μm × 50 cm, 2 μm 100 Å at a flow rate of 300 nL / min. The trap and nano-flow column were maintained at 35°C. The samples were eluted with a gradient starting at 1% B for 5 min rising to 5% B at 10 min then to 25% B at 360 min and 65% B at 480 min. Mobile phase A was 0.1% Formic acid while mobile phase B was 80% ACN:0.1% Formic acid. The column was washed and re-equilibrated prior to each sample
17 injection. The eluent was ionized using a Proxeon nano spray ESI source operating in positive ion mode. For mass spectrometry analysis, an Orbitrap LTQ Velos (Thermo Finnigan) was operated in MS/MS mode, scanning from 380 to 2,000 m / z. Ionization voltage was 2.6 kV and the capillary temperature was 275°C. The resolution of ions in MS1 was 60,000 and 7,500 for higher-energy collisional dissociation (HCD) MS2. The top 20 multiply charged ions were selected from each scan for MS/MS analysis using HCD at 35% collision energy. Dynamic exclusion was enabled with a repeat count of 1, exclusion duration of 30 s.
MS data processing and quantification. Raw files were analyzed with Proteome Discoverer
1.4 software package (Thermo Finnigan), using the Sequest search engine and the Uniprot human (Homo sapiens) reviewed database, downloaded on May 30, 2016. The search was performed using carbamidomethylation of cysteine as static and oxidation of methionine as dynamic modifications. Two missed cleavage sites, a precursor mass tolerance of 10 ppm and fragment mass tolerance of 0.05 Da were allowed. False discovery rate (FDR) validation was based on q value: target FDR (strict): 0.01, target FDR (relaxed): 0.05. Quantification analysis was performed at the peptide level with the clustering approach as previously described (34) with some minor modifications. Peptides were clustered using “window” of mass (±5ppm) and retention time (±15 min). Only peptides being present in 60% of the samples in at least one group were further processed for quantification and statistical analysis (Mann-Whitney). The differentially expressed proteins selected for further analysis, were considered those with a fold change of ≥1.2 or ≤0.83 in both batches and a p-value of ≤0.05 in at least one batch.
18
CMap analysis. Each up- and down-protein ID from the CVD signature was converted into
gene ID and were analyzed with the bioinformatic tool Connectivity Map (CMap) (CMap, build 02). CMap is a collection of genome-wide transcriptional expression signatures (6,100 treatment vs. vehicle control pairs) from cultured human cells (MCF7, PC3, and HL60) treated with 1,309 bioactive small chemical molecules at varying concentrations, and analyzed by simple pattern-matching algorithms (10).
Preparation of AACOCF3 solutions. AACOCF3 (Arachidonyl trifluoromethyl ketone) was
supplied by Cayman Chemical company (ref 62120). For in vivo treatments, the initial solution of AACOCF3 (50 mg/5 ml ethanol) was concentrated to 250 mg/ml and 20 µl was diluted in 4 ml of a 0.5% methylcellulose (Fisher Scientific, ref 10246190) in water. That solution was used to treat the animals. For in vitro treatment, AACOCF3 (Cayman Chemical) 10 mM stock solution in ethanol, was diluted to a final concentration of 10 µM in cell culture medium. Equal amounts of vehicle were used as control.
Mouse model of vascular calcification. Female C57Bl/6 mice were treated with AACOCF3
(10 mg/kg) or its vehicle (methylcellulose 0.5% containing 0.5%M ethanol) via gavage and were fed with calcium reduced diet (C1031, Altromin). Subsequently, mice were injected subcutaneously with 400 000 IU/kg BW of cholecalciferol (Vitamine D3) (Sigma-Aldrich) or vehicle for 3 days (35, 36). After six days of treatment, blood was collected by retroorbital puncture under isoflurane inhalative anaesthesia, and the mice were immediately sacrificed by cervical dislocation and aortic tissues were collected and snap-frozen for further experiments. All animal experiments were conducted according to the recommendations of
19 the Guide for Care and Use of Laboratory Animals of the National Institutes of Health as well as the German law for the welfare of animals and were approved by local authorities.
Mouse model of atherosclerosis. ApoE-/- mice (37, 38) (6 weeks old males) (Charles River)
were fed a high cholesterol diet (1.25% of cholesterol, 6% fat and 2% sucrose (Ssniff, Soest, Germany diet: TD.96335 mod. – 1.25 % cholesterol) and simultaneously treated (gavage with 200 µl; 5 days a week) with AACOCF3 (10 mg/kg) or its vehicle (methylcellulose 0.5% containing 0.5%M ethanol) for 10 weeks. The mice were sacrificed by pentobarbital injection and heart aortic sinus was collected and snap-frozen in liquid nitrogen for further analysis. Blood was collected 1 week before sacrifice by intra-caudal puncture in heparinized tubes. Ice-cold blood was centrifuged for 5 min at 1500 g and upper plasma phase was collected and immediately frozen at -80°C. The project was approved by the local (Inserm/UPS US006 CREFRE) and national ethics committees under the number 02604.02.
Biochemical analysis. The plasma concentrations of phosphorus and calcium were measured
by QuantiChrom Phosphate assay kit and QuantiChrom Calcium assay kit, respectively (BioAssay Systems). An ELISA kit was used to determine plasma concentrations of FGF23 C-term (Immutopics), according to manufacturer's instructions. Blood glucose concentration was measured using a glucometer. Plasma concentrations of cholesterol and triglyceride were measured by autoanalyzer.
Immuno-histology. For human, histologic paraffin sections of iliac arteries samples were cut
at 2 μm, mounted on charged slides, and stained with hematoxylin-eosin (H&E) and von Kossa, for pathological evaluation. cPLA2 staining was performed on 1-2 µm paraffin
20 sections of A. ilia communis samples of histopathologically classified early (n=15) and advanced (n=24) patients, using a 1:50 dilution of the rabbit anti-human PLA2G4A antibody (ProSci Incorporated, Poway, CA, USA). Heat-induced epitope retrieval was performed at pH8. For detection, the EnVision+ System-HRP Labelled Polymer Anti-Rabbit kit (Dako, Hamburg, Germany) was used. Nuclei were counterstained with hematoxylin and sections, cover-slipped with gelatin. The expression levels of cPLA2 were evaluated per tissue section (vessel cross section), distinguishing between the different vessel layers (Tunica intima, Tunica media, and Tunica externa). The abundance of cPLA2 was scored as follows: 0.5 for no expression, 1 for weak expression, 2 for moderate expression and 3 for strong expression. Images were acquired using the AxioImager Z1 microscope (Carl Zeiss MicroImaging, Inc.). All evaluations were performed in a blinded manner.
For aortic sinus of ApoE-/- mice, lipid accumulation and collagen expression were analyzed on serial cross-cryosections of the heart as previously described (39). For lipid analysis, cryo-sections were post-fixed with formaldehyde and stained with oil red O and counterstained with hematoxylin. For collagen, cryo-sections were post-fixed with methanol/acetone and exposed to a type III collagen primary antibody (Acris BP8014) and revealed with an anti-rabbit HRP secondary antibody (DAKO 4010). Samples were imaged with a Nikon Y-FL microscope equipped with a computer-based imaging system. Staining was expressed as the percentage of total sinus area. Reported intensities used for further statistical analysis correspond to the mean value of 5 sections per animal.
Western Blot. Arteria iliaca communis samples of histopathologically classified control
(n=15) and disease (n=24) patients were homogenized in lysis buffer (Invitrogen, Darmstadt, Germany) supplemented with proteinase inhibitors (Roche, Munich, Germany). Next, 30 µg
21 of protein was loaded on 10% SDS-polyacrylamide gels. EFEMP1, GUCY1B2, KDM5D, cPLA2, and SHMT1 were detected with a rabbit anti-human EFEMP1 antibody (1:1000, Abcam, Cambridge, UK), rabbit anti-human GUCY1B2 antibody (1:500, Thermo Fisher Scientific, Walthamn MA, USA), rabbit anti-human KDM5D (Jarid 1D, 1:5000, Novus Biologicals, Centennial, Colorado, USA), rabbit anti-human PLA2G4A antibody (1:500, ProSci Incorporated, Poway, CA, USA), and rabbit anti-human SHMT1 (1 250, Sigma Aldrich, St. Louis, MO, USA), respectively, followed by a goat anti-rabbit IR dye 680 secondary antibody (1:7500, LI-COR Biosciences, Lincoln, NE, USA). All samples were normalized towards GAPDH (1:2000, BPS Bioscience, San Diego, CA, USA) as internal control. Visualization and quantitative analysis were performed on Odyssey (LI-COR Biosciences) via Odyssey V3.0 software (LI-COR Biosciences).
Cell culture of primary human aortic smooth muscle cells. Primary human aortic smooth
muscle cells (HAoSMCs, Thermo Fisher Scientific) were cultured in Waymouth’s MB 752/1 medium and Ham’s F-12 nutrient mixture in a 1:1 ratio (Thermo Fisher Scientific) containing 10% FBS (Thermo Fisher Scientific), 100 U/ml penicillin and 100 μg/ml streptomycin (Thermo Fisher Scientific) (40, 41). HAoSMCs were used in all experiments from passages 4 to 11 and each experiment was performed in at least two different batches of HAoSMCs at different passages, depending on the availability of the cells. HAoSMCs were treated for 24 hours (qRT-PCR, AA release), 7 days (ALPL assay) or 11 days (calcification) with 2 mM β-glycerophosphate (Sigma Aldrich) (25, 42, 43, 40, 36) or with 10 µM AACOCF3. Equal amounts of vehicle were used as control. For the mineralization analysis and Alizarin Red staining, treatment with 10 mM β-glycerophosphate and 1.5 mM CaCl2 (Sigma-Aldrich) for 11 days was used as calcification media (Calc.) (44). Fresh media with agents were added
22 every 2-3 days. HAoSMCs were transfected with 10 nM cPLA2 siRNA (ID no. s10592, Thermo Fisher Scientific) or with 10 nM negative control siRNA (ID no. 4390843, Thermo Fisher Scientific) using siPORT amine transfection agent (Thermo Fisher Scientific) according to the manufacturer’s protocol. The cells were used 48 hours (qRT-PCR) after silencing and silencing efficiency was determined by quantitative RT-PCR.
Analysis of calcification. To quantify vascular calcification, abdominal aortic tissues were
incubated overnight at 37°C in 0.6 M HCl. HAoSMCs were incubated in 0.6 M HCl for 24 hours at 4°C. Calcium content in the supernatant was determined by using QuantiChrom Calcium assay kit (BioAssay Systems) according to the manufacturer’s protocol. Tissues and HAoSMCs were lysed with 0.1 M NaOH/ 0.1% SDS and protein concentration was determined by the Bradford assay (Bio-Rad Laboratories). The results are shown normalized to total protein concentration (45). To visualize calcification, HAoSMCs were fixed with 4% paraformaldehyde and stained with 2% Alizarin Red (pH 4.5). The calcified areas are shown as red staining (36).
Alkaline phosphatase (ALPL) activity assay. ALPL activity in HAoSMCs was determined by
using the ALP colorimetric assay kit (Abcam) according to the manufacturer’s protocol (22, 41). The results are shown normalized to total protein concentration measured by the Bradford assay (Bio-Rad Laboratories).
Arachidonic acid (AA) release. Medium AA levels were determined by using an arachidonic
23 shown normalized to total protein concentration measured by the Bradford assay (Bio-Rad Laboratories).
RNA isolation and quantitative RT-PCR. Total RNA was isolated from aortic tissue and
HAoSMCs by using Trizol Reagent (Thermo Fisher Scientific) according to the manufacturer’s instructions (46–48). Reverse transcription of total RNA was performed using oligo(dT)12-18 primers (Thermo Fisher Scientific) and SuperScript III Reverse Transcriptase (Thermo Fisher Scientific). Quantitative RT-PCR was performed with the iCycler iQTM Real-Time PCR Detection System (Bio-Rad Laboratories) and iQTM Sybr Green Supermix (Bio-Rad Laboratories) according to the manufacturer’s instructions. The mouse and human primer sequences are given in Table S1 and Table S2, respectively. The specificity of the PCR products was confirmed by analysis of the melting curves. All PCRs were performed in duplicate and relative mRNA expression was calculated by the 2-ΔΔCt method using GAPDH as housekeeping gene normalized to the control group.
Statistics. Proteomics statistical analysis was based on the Mann-Whitney test performed
using R package. For both batches, protein changes between early stage and advanced stage CVD with p-value ≤0.05 were considered as statistically significant. Other statistical analysis: Data are shown as scatterdot plots and arithmetic means ± SEM. N indicates the number of independent experiments performed at different passages of the cells or the number of mice examined, respectively. Normality was tested with Shapiro-Wilk test. Non-normal datasets were transformed (log, reciprocal or sqrt) prior to statistical testing to provide normality according to Shapiro-Wilk test. Statistical testing was performed by one-way ANOVA followed by Tukey-test for homoscedastic data or Games-Howell test for heteroscedastic
24 data. Non-normal data were tested by the Steel-Dwass method. Two groups were compared by unpaired two-tailed t-test or Mann-Whitney test. P<0.05 was considered statistically significant (22).
25
Acknowledgements
This work was supported by grants from: the European Union Seventh Framework Program (FP7/2007-2013–603288-SysVasc) for JPS, VL, SVL, CD, FL, BP, JLP, HM, JSSB, JV, AV, JL; the European Union ERA CVD JTC2017 PROACT (ANR-17-ECVD-0006 for JK, GF, CD, JSSB and JPS; 01KL1805 via the BMBF for HM); the Institut National de Santé et de Recherche Médicale (INSERM) and the "Fondation pour la Recherche Médicale" (grant number DEQ20170336759) for JK, GF, CD, JSSB and JPS; the BHF Centre of Research Excellence Award RE/13/5/30177; the Deutsche Forschungsgemeinschaft (AL2054/1-1, VO2259/2-1) and the Berlin Institute of Health (BIH) and the Else Kröner-Fresenius-Stiftung for T.T.D.L., J.V., I.A., B.B., N.S. Immunopathological analysis of cPLA2 was provided by the iPATH.Berlin – Core Unit Immunopathology for Experimental Models of the Charité – Universitätsmedizin Berlin (Berlin, Germany).
Authors’ contributions
JPS, JK, JLB, AV, CD, JV, IA, HM, BP, FL designed research; MM, SVL, VL, AL, TTDL, JV, IA, BB, NS, GF, CD, performed experiments; JPS, JK, JSSB, JLB, AV, CD, JV, IA, HM, BP, FL analyzed and interpreted data; JSSB, JPS, JK, JLB, AV, CD, JV, IA, HM, BP, FL wrote the manuscript. All authors gave final approval of the version to be published.
Disclosure Statement
26
References
1. Roth GA et al. Demographic and epidemiologic drivers of global cardiovascular mortality.
N. Engl. J. Med. 2015;372(14):1333–1341.
2. Benjamin EJ et al. Heart Disease and Stroke Statistics-2017 Update: A Report From the American Heart Association. Circulation 2017;135(10):e146–e603.
3. Albanese I, Khan K, Barratt B, Al-Kindi H, Schwertani A. Atherosclerotic Calcification: Wnt Is the Hint. J Am Heart Assoc 2018;7(4). doi:10.1161/JAHA.117.007356
4. Durham AL, Speer MY, Scatena M, Giachelli CM, Shanahan CM. Role of smooth muscle cells in vascular calcification: implications in atherosclerosis and arterial stiffness.
Cardiovasc. Res. 2018;114(4):590–600.
5. Weber C, Noels H. Atherosclerosis: current pathogenesis and therapeutic options. Nat.
Med. 2011;17(11):1410–1422.
6. Rüegg C, Tissot J-D, Farmer P, Mariotti A. Omics meets hypothesis-driven research. Partnership for innovative discoveries in vascular biology and angiogenesis. Thromb.
Haemost. 2008;100(5):738–746.
7. Dominiczak AF et al. Systems biology to battle vascular disease. Nephrol. Dial. Transplant. 2010;25(4):1019–1022.
8. Vernon ST et al. Utilizing state-of-the-art “omics” technology and bioinformatics to identify new biological mechanisms and biomarkers for coronary artery disease.
Microcirculation 2018;e12488.
9. Mokou M, Lygirou V, Vlahou A, Mischak H. Proteomics in cardiovascular disease: recent progress and clinical implication and implementation. Expert Rev Proteomics
2017;14(2):117–136.
10. Lamb J et al. The Connectivity Map: using gene-expression signatures to connect small molecules, genes, and disease. Science 2006;313(5795):1929–1935.
11. Xi D et al. Identification of Gene Expression Changes in the Aorta of ApoE Null Mice Fed a High-Fat Diet. Genes (Basel) 2017;8(10). doi:10.3390/genes8100289
12. Huang C-H et al. Identify potential drugs for cardiovascular diseases caused by stress-induced genes in vascular smooth muscle cells. PeerJ 2016;4:e2478.
13. Li J et al. Gene expression profiling of CD133-positive cells in coronary artery disease.
Mol Med Rep 2015;12(5):7512–7516.
14. Lang F et al. Therapeutic Interference With Vascular Calcification-Lessons From Klotho-Hypomorphic Mice and Beyond. Front Endocrinol (Lausanne) 2018;9:207.
15. Leslie CC. Cytosolic phospholipase A₂: physiological function and role in disease. J. Lipid
Res. 2015;56(8):1386–1402.
16. Getz GS, Reardon CA. Animal models of atherosclerosis. Arterioscler. Thromb. Vasc. Biol. 2012;32(5):1104–1115.
17. Trimble LA et al. NMR structural studies of the tight complex between a trifluoromethyl ketone inhibitor and the 85-kDa human phospholipase A2. Biochemistry 1993;32(47):12560– 12565.
18. Riendeau D et al. Arachidonyl trifluoromethyl ketone, a potent inhibitor of 85-kDa phospholipase A2, blocks production of arachidonate and 12-hydroxyeicosatetraenoic acid by calcium ionophore-challenged platelets. J. Biol. Chem. 1994;269(22):15619–15624. 19. Bartoli F et al. Tight binding inhibitors of 85-kDa phospholipase A2 but not 14-kDa phospholipase A2 inhibit release of free arachidonate in thrombin-stimulated human platelets. J. Biol. Chem. 1994;269(22):15625–15630.
27 20. Gelb MH, Jain MK, Berg OG. Inhibition of phospholipase A2. FASEB J. 1994;8(12):916– 924.
21. Street IP et al. Slow- and tight-binding inhibitors of the 85-kDa human phospholipase A2.
Biochemistry 1993;32(23):5935–5940.
22. Luong TTD et al. Fibulin-3 Attenuates Phosphate-Induced Vascular Smooth Muscle Cell Calcification by Inhibition of Oxidative Stress. Cell. Physiol. Biochem. 2018;46(4):1305–1316. 23. Voelkl J et al. Zinc Inhibits Phosphate-Induced Vascular Calcification through TNFAIP3-Mediated Suppression of NF-κB. J. Am. Soc. Nephrol. 2018;29(6):1636–1648.
24. Chun S et al. A High Phosphorus Diet Affects Lipid Metabolism in Rat Liver: A DNA Microarray Analysis. PLoS ONE 2016;11(5):e0155386.
25. Steitz SA et al. Smooth muscle cell phenotypic transition associated with calcification: upregulation of Cbfa1 and downregulation of smooth muscle lineage markers. Circ. Res. 2001;89(12):1147–1154.
26. Lanzer P et al. Medial vascular calcification revisited: review and perspectives. Eur. Heart
J. 2014;35(23):1515–1525.
27. Voelkl J et al. SGK1 induces vascular smooth muscle cell calcification through NF-κB signaling. J. Clin. Invest. 2018;128(7):3024–3040.
28. Rosenson RS, Hurt-Camejo E. Phospholipase A2 enzymes and the risk of atherosclerosis.
Eur. Heart J. 2012;33(23):2899–2909.
29. Kokotou MG, Limnios D, Nikolaou A, Psarra A, Kokotos G. Inhibitors of phospholipase A2 and their therapeutic potential: an update on patents (2012-2016). Expert Opin Ther Pat 2017;27(2):217–225.
30. Elinder LS et al. Expression of phospholipase A2 isoforms in human normal and atherosclerotic arterial wall. Arterioscler. Thromb. Vasc. Biol. 1997;17(10):2257–2263. 31. Hartiala J et al. Genetic contribution of the leukotriene pathway to coronary artery disease. Hum. Genet. 2011;129(6):617–627.
32. Leis HJ, Windischhofer W. Inhibition of cyclooxygenases 1 and 2 by the phospholipase-blocker, arachidonyl trifluoromethyl ketone. Br. J. Pharmacol. 2008;155(5):731–737. 33. Makridakis M, Vlahou A. GeLC-MS: A Sample Preparation Method for Proteomics Analysis of Minimal Amount of Tissue. Methods Mol. Biol. 2018;1788:165–175. 34. Lygirou V et al. Plasma proteomic analysis reveals altered protein abundances in cardiovascular disease. J Transl Med 2018;16(1):104.
35. Han M-S et al. Functional cooperation between vitamin D receptor and Runx2 in vitamin D-induced vascular calcification. PLoS ONE 2013;8(12):e83584.
36. Alesutan I et al. Augmentation of phosphate-induced osteo-/chondrogenic transformation of vascular smooth muscle cells by homoarginine. Cardiovasc. Res. 2016;110(3):408–418.
37. Zhang SH, Reddick RL, Piedrahita JA, Maeda N. Spontaneous hypercholesterolemia and arterial lesions in mice lacking apolipoprotein E. Science 1992;258(5081):468–471.
38. Plump AS et al. Severe hypercholesterolemia and atherosclerosis in apolipoprotein E-deficient mice created by homologous recombination in ES cells. Cell 1992;71(2):343–353. 39. Lesnik P, Haskell CA, Charo IF. Decreased atherosclerosis in CX3CR1-/- mice reveals a role for fractalkine in atherogenesis. J. Clin. Invest. 2003;111(3):333–340.
40. Alesutan I et al. Inhibition of Phosphate-Induced Vascular Smooth Muscle Cell Osteo-/Chondrogenic Signaling and Calcification by Bafilomycin A1 and Methylamine. Kidney Blood
Press. Res. 2015;40(5):490–499.
28 Osteogenic Transformation Of Vascular Smooth Muscle Cells. Sci Rep 2017;7(1):2059.
42. Liao X-B et al. MiR-133a modulates osteogenic differentiation of vascular smooth muscle cells. Endocrinology 2013;154(9):3344–3352.
43. Qiao W, Chen L, Zhang M. MicroRNA-205 regulates the calcification and osteoblastic differentiation of vascular smooth muscle cells. Cell. Physiol. Biochem. 2014;33(6):1945– 1953.
44. Villa-Bellosta R, Millan A, Sorribas V. Role of calcium-phosphate deposition in vascular smooth muscle cell calcification. Am. J. Physiol., Cell Physiol. 2011;300(1):C210-220. 45. Alesutan I et al. Inhibition of osteo/chondrogenic transformation of vascular smooth muscle cells by MgCl2 via calcium-sensing receptor. J. Hypertens. 2017;35(3):523–532. 46. Voelkl J et al. Spironolactone ameliorates PIT1-dependent vascular osteoinduction in klotho-hypomorphic mice. J. Clin. Invest. 2013;123(2):812–822.
47. Voelkl J et al. Up-regulation of hepatic alpha-2-HS-glycoprotein transcription by testosterone via androgen receptor activation. Cell. Physiol. Biochem. 2014;33(6):1911– 1920.
48. Voelkl J et al. AMP-activated protein kinase α1-sensitive activation of AP-1 in cardiomyocytes. J. Mol. Cell. Cardiol. 2016;97:36–43.
29
Figure legends
Figure 1. Histology of human arteries. Representative pictures of hematoxylin and
eosin-staining (A, C) and von Kossa-eosin-staining (B, D) of iliac arteries sections from an early (A, B) and an advanced (C, D) CVD patient. Black staining in B and D corresponds to calcium deposits.
A
C
30
Figure 2. cPLA2 expression was increased in the arteries of advanced compared to early CVD patients. (A) Representative cPLA2 and GAPDH Western blots in iliac arteries from early
(n=3) versus advanced (n=3) CVD patients. (B) Scatterdot plots and arithmetic means ± SEM of cPLA2 protein expression normalized to GAPDH in iliac arteries from early (n=14) versus advanced (n=23) CVD patients. *p<0.05 statistically significance vs. early CVD group (unpaired Mann-Whitney test).
GAPDH
cPLA2
75
100
Early
Advanced
A
B
kDa
Early
Advanced
0.00
0.05
0.10
0.15
0.20
c
P
L
A
2
/G
A
P
D
H
*
31
Figure 3. AACOCF3 reduced vascular calcification in vivo. A. Scatterdot plots and arithmetic
means ± SEM (n=5-6, µg/mg protein) of calcium content in aortic tissue of mice receiving vehicle (CTR) or high-dosed cholecalciferol (vD) without or with additional treatment with AACOCF3 (AAC). B. Scatterdot plots and arithmetic means ± SEM (n=5-6; arbitrary units, a.u.) of Pla2g4a relative mRNA expression in aortic tissue of mice receiving vehicle (CTR) or high-dosed cholecalciferol (vD) without or with additional treatment with AACOCF3 (AAC). *(p<0.05), **(p<0.01), ***(p<0.001) statistically significant vs. control mice; †(p<0.05) statistically significant vs. vD treated mice (One-way ANOVA with Tukey-HSD post-hoc test).
32
Figure 4. AACOCF3 ameliorated aortic osteo-/chondrogenic signaling during cholecalciferol overload-induced calcification in vivo. Scatterdot plots and arithmetic means ± SEM (n=5-6;
arbitrary units, a.u.) of Msx2 (A), Cbfa1 (B) and Alpl (C) relative mRNA expression in aortic tissue of mice receiving vehicle (CTR) or high-dosed cholecalciferol (vD) without or with additional treatment with AACOCF3 (AAC). *(p<0.05), **(p<0.01) statistically significant vs. control mice; †(p<0.05) statistically significant vs. vD treated mice (Steel-Dwass method for A and One-way ANOVA with Games-Howell post-hoc test for B,C).
33
Figure 5. AACOCF3 suppressed phosphate-induced calcification and osteo-/chondrogenic signaling in HAoSMCs. Representative images showing Alizarin red staining (A, n=3) and
scatterdot plots and arithmetic means ± SEM of calcium content (B, n=4, µg/mg protein) in HAoSMCs following treatment with control (CTR) or with calcification medium (Calc.) without or with additional treatment with 10 µM AACOCF3(AAC). The calcified areas are shown as red staining. C-G. Scatterdot plots and arithmetic means ± SEM of MSX2 (C), CBFA1 (D) and ALPL (E) relative mRNA expression (n=6; arbitrary units, a.u.) and of ALPL activity (F, n=4, U/mg protein) in HAoSMCs as well as of arachidonic acid (AA) levels (G, n=4; ng/mg protein) in the cell culture medium of HAoSMCs following treatment with control (CTR) or with β-glycerophosphate (Pi) without or with additional treatment with 10 µM AACOCF3 (AAC). *(p<0.05), **(p<0.01), ***(p<0.001) statistically significant vs. control treated HAoSMCs; †(p<0.05), ††(p<0.01), †††(p<0.001) statistically significant vs. HAoSMCs treated with Calc./Pi alone (One-way ANOVA with Games-Howell post-hoc test for B,C,F or with Tukey-HSD post-hoc test for D,E,G).
0 2 4 6 A L P L a c ti v it y [ U /m g p ro t. ] CTR AAC Pi Pi + AAC ** † M S X 2 m R N A e x p . [a .u .] 0.0 0.5 1.0 1.5 2.0 2.5 CTR AAC Pi Pi + AAC *** *** †† C B F A 1 m R N A e x p . [a .u .] 0.0 0.5 1.0 1.5 2.0 2.5 CTR AAC Pi Pi + AAC *** ††† A L P L m R N A e x p . [a .u .] 0.0 0.5 1.0 1.5 2.0 CTR AAC Pi Pi + AAC * *** ††† A F C D E B C T R C a lc . CTR AAC C a lc iu m c o n te n t [µ g /m g p ro t. ] 0 500 1000 1500 2000
CTR AAC Calc. Calc.+
AAC * † A A [ n g /m g p ro t. ] 0 50 100 150 200 CTR AAC Pi Pi + AAC * * ††† G
34
Figure 6. Silencing of cPLA2 inhibited phosphate-induced osteo-/chondrogenic signaling in HAoSMCs. Scatterdot plots and arithmetic means ± SEM (n=6, arbitrary units, a.u.) of PLA2G4A (A), MSX2 (B), CBFA1 (C) and ALPL (D) relative mRNA expression in HAoSMCs
following silencing with negative control siRNA (Neg.si) or cPLA2 siRNA (cPLA2si) without or with additional treatment with β-glycerophosphate (Pi). *(p<0.05), **(p<0.01), ***(p<0.001) statistically significant vs. Neg.si silenced HAoSMCs; †(p<0.05), †††(p<0.001) statistically significant vs. Neg.si silenced and Pi treated HAoSMCs (One-way ANOVA with Games-Howell post-hoc test for A or with Tukey-HSD post-hoc test for C and Steel-Dwass method for B,D).
35
Figure 7. AACOCF3 reduced atherosclerosis in vivo. Representative pictures and scatterdot
plots and arithmetic means ± SEM of quantification (%) of lipid deposits by oil red O staining (A, n=8-10) and of type III collagen by immunostaining (B, n=7-11) in aortic sinus cryosections of 6 weeks old ApoE-/- male mice fed a high cholesterol diet and simultaneously treated with AACOCF3 (AAC, 10 mg/kg) or vehicle (CTR) for 10 weeks. *(p<0.05) statistically significant vs. control mice (unpaired two-tailed t-test).
36 Tables
Table 1. Clinical parameters of the early and advanced CVD patients for whom high resolution vessel proteome analysis was performed.
Early CVD Advanced CVD
mean SD min max N* yes/no mean SD min max N* yes/no T-test
gender 14m/1f 15 9m/8f 17 age [years] 45,4 18,2 21 74 15 66,1 9,2 50 78 17 0,0018 weight [kg] 80,9 9,6 62 95 15 74,5 11,0 60 100 17 0,0609 height [cm] 1,77 0,09 1,60 1,90 15 1,69 0,08 1,58 1,82 17 0,0208 BMI 25,9 2,3 22 31 15 26,1 3,5 21 35 17 0,9699 Nicotin 1/7 5/9 Hypertension** 5/10 17/0 familiy history of CVD*** 0/7 2/8 diabetes 0/15 5/12 vascular disease 1/13 17/0
left ventricular hypertrophy 0/14 6/11
angina pectoris 0/15 2/15
claudicatio intermittens 0/14 9/8
myocardial infarction 0/14 2/15
death from a CV event 1/13 8/9
Routine analysis
creatine kinase [U/l] 518 731 39 2790 13 138 141 11 529 14 0,0886 creatine kinase isoform MB [U/l] 21,5 10,3 10 40 13 18,2 9,7 5 39 14 0,4090 lactate dehydrogenase [U/l] 296 111 164 556 13 204 87 128 471 14 0,0283 troponin T [pg/ml] 112 181 3 597 13 62 106 3 354 15 0,4100 NT-proBNP [pg/ml] 117 88 5 283 10 74 91 4 233 8 0,4140 creatinine [mg/dl] 1,0 0,3 1 2 14 0,9 0,3 1 2 17 0,1726 Na [mmol/l] 150 7 137 161 13 143 8 133 163 17 0,0074 K [mmol/l] 4,2 0,4 4 5 14 4,1 0,4 4 5 17 0,5596 Ca [mmol/l] 2,1 0,3 1 2 14 2,3 0,1 2 2 16 0,0114 leukocytes [g/l] 11,3 3,2 7 17 14 10,5 4,3 5 21 17 0,5380
37 C-reactive protein [mg/l] 154 72 43 298 14 95 101 1 249 17 0,0677 total bilirubin [mg/dl] 0,9 0,5 0 2 13 0,5 0,3 0 1 17 0,0300 alanine transaminase [U/l] 74,2 64,4 12 221 13 33,1 40,4 8 158 12 0,0679 aspartate transaminase ( [U/l] 75,2 47,4 23 196 13 31,5 23,5 14 100 13 0,0081 cholinesterase [U/l] 4129 1241 2132 6418 13 6482 2823 1625 12333 16 0,0071 total cholesterol [mg/dl] 115 69 31 280 13 132 21 106 168 7 0,4349 triglycerides [mg/dl] 111 55 34 193 13 150 88 66 346 12 0,1956
*N: measured patients; ** Hypertension (≥ 140/90 mmHg); *** Family history of CVD (CVD in first-degree relatives; women <65 years; men <55 years)
38 Table 2. Top molecules predicted to reverse human arterial protein signature of advanced CVD following CMap analysis.
CMap name Mean* n enrichment p specificity percent non-null arachidonyltrifluoromethane -0.538 2 -0.918 0.01368 0.0261 100 atracurium besilate -0.556 3 -0.915 0.00104 0 100 Prestwick-691 -0.542 3 -0.891 0.0025 0.0263 100 vinblastine -0.551 3 -0.888 0.00268 0.0382 100 isoflupredone -0.555 3 -0.871 0.00421 0.1083 100 ouabain -0.48 4 -0.854 0.00084 0.0263 100 viomycin -0.596 4 -0.849 0.00097 0.0576 100 STOCK1N-35696 -0.511 2 -0.846 0.04797 0.0616 100 quinpirole -0.524 4 -0.827 0.00171 0 100 ajmaline -0.559 3 -0.827 0.01024 0.0284 100 lisuride -0.529 5 -0.816 0.00054 0.0082 100 thioperamide -0.479 5 -0.791 0.00078 0 100
* Abbreviations: “Mean”, is the arithmetic mean of the connectivity scores for those signatures; “n” is the number of signatures of a given compound available in the Cmap database; ”enrichment” indicates the degree of matching between a query signature (here the CVD signature) and the reversed signature of a given compound; “p” (permutation p) estimates the likelihood that the enrichment would be observed by chance; “specificity” provides a measure of the uniqueness of the matching between a compound and the CVD signature; “percent non-nul” measures the support for the connection between a set of compound signature and the query signature based upon the behavior of the individual signature in that set. More details can be found here:
39 Table 3. Effect of AACOCF3 during cholecalciferol overload. Arithmetic means ± SEM of serum calcium, phosphorus, CaxPi product and FGF23 C-term concentrations in mice receiving vehicle (CTR) or high-dosed cholecalciferol (vD) without or with additional treatment with AACOCF3 (AAC).
*(p<0.05), **(p<0.01), ***(p<0.001) statistically significant vs. control mice.
CTR AAC vD vD + AAC n
Calcium [mg/dl] 10.29 ± 0.23 9.63 ± 0.23 20.01 ± 0.60*** 19.00 ± 0.56*** 5-6 Phosphorus [mg/dl] 7.78 ± 0.25 7.23 ± 0.55 5.53 ± 0.11*** 5.81 ± 0.14** 5-6 CaxPi product 79.9 ± 1.8 69.6 ± 5.3 110.3 ± 2.0*** 110.2 ± 3.1*** 5-6 FGF23 C-term [pg/ml] 554 ± 52 525 ± 31 172980 ± 18530* 192196 ± 19727* 5-6
40 Table 4. Influence of AACOCF3 treatment on plasma lipids and glucose in ApoE-/- mice.
Plasma concentration (mmol/L) Vehicle (n=18) AACOCF3 (n=18)
total cholesterol 17.45 ± 0.73 17.55 ± 1.04
HDL-cholesterol 0.30 ± 0.02 0.33 ± 0.02
LDL-cholesterol 5.72 ± 0.26 5.66 ± 0.30
triglyceride 1.67 ± 0.10 1.56 ± 0.15
41
Supplementary Figures.
Figure S1. Expression of EFEMP1, KDM5D, GUCY1B2 and SHMT1 in the A. iliaca communis of early versus advanced CVD patients. Dot plots representing the mean±SEM of A. EFEMP1, B. KDM5D, C. GUCY1B2, and D. SHMT1 expression (Western blot) normalized to GAPDH in the A. iliaca communis of control (n=15) and disease (n=24) patients, with **p<0.01, ***p<0.001, and ****p<0.0001.
early advanced 0.0 0.2 0.4 0.6 0.8 EFEMP1 E F E M P 1 /G A P D H **** early advanced 0.00 0.05 0.10 0.15 GUCY1B2 G U C Y 1 B 2 /G A P D H *** early advanced 0.00 0.01 0.02 0.03 0.04 0.05 KDM5D K D M 5 D /G A P D H ** early advanced 0 1 2 3 4 5 SHMT1 S H M T 1 /G A P D H ***
A
B
C
D
42 Figure S2. cPLA2 protein expression is increased in the intima of A. iliaca communis of disease versus control patients. A. Representative pictures of A. iliaca communis of a early (left) and adavnced (right) CVD patient at 100x magnifcation, scale bar 100 µm. B. Dot plots representing the mean±SEM of cPLA2 expression in the Tunica intima, media and externa of early (n=15) and advanced (n=24) CVD patients. Expression is depicted semiquantitatively with the following
classification: 0.5 = very weak expression, 1 = weak expression, 2 = moderate expression, 3 = strong expression.
Early
Advanced
A
early advanced early advanced early advanced
0 1 2 3 4 cPLA2 c la s s if ic a ti o n (0 -3 )
Intima Media Externa
*
43 Figure S3. Influence of vitamin D on cPLA2 expression in aortic tissue in vivo. (A) Representative cPLA2 and GAPDH Western blots in aortic tissue of mice receiving vehicle (CTR) or high-dosed cholecalciferol (vD) without or with additional treatment with AACOCF3 (AAC). (B) Scatterdot plots and arithmetic means ± SEM of cPLA2 protein expression normalized to GAPDH (n=4 per group). One-way ANOVA test revealed no statistical significance.
Figure S4. Representative pictures and scatterdot plots and arithmetic means ± SEM of quantification (%/plaque) of Sirius red staining (A, n=8-8), and aSMA (B, n=6-10) and of MOMA2 immunostaining (C, n=7-12) in aortic sinus cryosections of 6 weeks old ApoE-/- male mice fed a high cholesterol diet and simultaneously treated with AACOCF3 (AAC, 10 mg/kg) or vehicle (CTR) for 10 weeks. *(p<0.05) statistically significant vs. control mice (unpaired two-tailed t-test).
Vehicle AACOCF3 0 20 40 60 80 100 % S ir iu s / P la q u e Vehicle AACOCF3 0 20 40 60 80 100 % a S M A / p la q u e Vehicle AACOCF3 0 20 40 60 80 100 % M O M A 2 / p la q u e * A B C
44 Figure S5. Scatterdot plots and arithmetic means ± SEM (n=8; arbitrary units, a.u.) of Alpl (A), Cbfa1 (B) relative mRNA expression in aortic tissue of 6 weeks old ApoE-/- male mice fed a high cholesterol diet and simultaneously treated with AACOCF3 (AAC, 10 mg/kg) or vehicle (CTR) for 10 weeks. Unpaired two-tailed t-test revealed no significant difference between Vehicle and AACOCF3 groups.
C b fa 1 m R N A e x p . [a .u .] Vehicle AACOCF3 0 1 2 3 A lp l m R N A e x p . [a .u .] Vehicle AACOCF3 0 1 2 3 4 5 A B