HAL Id: hal-00297803
https://hal.archives-ouvertes.fr/hal-00297803
Submitted on 12 Jun 2006HAL is a multi-disciplinary open access
archive for the deposit and dissemination of sci-entific research documents, whether they are pub-lished or not. The documents may come from teaching and research institutions in France or abroad, or from public or private research centers.
L’archive ouverte pluridisciplinaire HAL, est destinée au dépôt et à la diffusion de documents scientifiques de niveau recherche, publiés ou non, émanant des établissements d’enseignement et de recherche français ou étrangers, des laboratoires publics ou privés.
River biogeochemistry and source identification of
nitrate by means of isotopic tracers in the Baltic Sea
catchments
M. Voss, B. Deutsch, R. Elmgren, C. Humborg, P. Kuuppo, M. Pastuszak, C.
Rolff, U. Schulte
To cite this version:
M. Voss, B. Deutsch, R. Elmgren, C. Humborg, P. Kuuppo, et al.. River biogeochemistry and source identification of nitrate by means of isotopic tracers in the Baltic Sea catchments. Biogeosciences Discussions, European Geosciences Union, 2006, 3 (3), pp.475-511. �hal-00297803�
BGD
3, 475–511, 2006 Source identification of riverine nitrate M. Voss et al. Title Page Abstract Introduction Conclusions References Tables Figures J I J I Back CloseFull Screen / Esc
Printer-friendly Version
Interactive Discussion
EGU
Biogeosciences Discuss., 3, 475–511, 2006 www.biogeosciences-discuss.net/3/475/2006/ © Author(s) 2006. This work is licensed under a Creative Commons License.
Biogeosciences Discussions
Biogeosciences Discussions is the access reviewed discussion forum of Biogeosciences
River biogeochemistry and source
identification of nitrate by means of
isotopic tracers in the Baltic Sea
catchments
M. Voss1, B. Deutsch1, R. Elmgren2, C. Humborg3, P. Kuuppo4, M. Pastuszak5, C. Rolff2, and U. Schulte6
1
Baltic Sea Research Institute, Seestr. 15, 18119 Rostock, Germany 2
Stockholm University, Department of System Ecology, 10691 Stockholm, Sweden 3
Stockholm University, Department of Applied Environmental Science, 10691 Stockholm, Sweden
4
Finnish Environment Institute, P.O. Box 140, 00251 Helsinki, Finnland 5
Sea Fisheries Institute, Kollataja 1, 81–332 Gdynia, Poland 6
Ruhr Universit ¨at Bochum, Universit ¨atsstr. 150, 44780 Bochum, Germany Received: 2 March 2006 – Accepted: 11 March 2006 – Published: 12 June 2006 Correspondence to: M. Voss ([email protected])
BGD
3, 475–511, 2006 Source identification of riverine nitrate M. Voss et al. Title Page Abstract Introduction Conclusions References Tables Figures J I J I Back CloseFull Screen / Esc
Printer-friendly Version
Interactive Discussion
EGU
Abstract
Nitrate input to a river is largely controlled by land use in its catchment. We compared the information carried by the isotopic signatures of nitrate in 12 Baltic rivers, in relation to the vegetation cover of their catchments. We found isotope values in nitrate ranging from −2 to 14‰ for δ15N and 8 to 25 per mil for δ18O. Seasonal signals were evident 5
in all rivers. The annual variability of riverine isotope signatures is presented in detail for one Nordic, the Kemijoki, and two southern rivers, Vistula and Oder. Nordic rivers with relatively pristine vegetation in its catchments show not only low δ15N values and high δ18O–NO−3 but also lower annual variability than rivers draining densely popu-lated land. Seasonal signals could be found in all of the rivers. We used load weighted 10
nitrate isotope data and data from the three major sources (farmland/sewage, atmo-spheric deposition and from runoff of pristine soils) to theoretically estimate the shares of nitrate from these sources. The results agree well with same estimates derived from a Global Land Cover data base. The comparison with an emission model (EM) reveals good agreements for intensively used catchments and rather bad ones for pris-15
tine catchments. Advantages and limitations of the tested model types are discussed.
1 Introduction
Humans create reactive N at rates that now exceed the natural conversion of atmo-spheric N2into combined N (Galloway et al., 1995). Most of this anthropogenic com-bined nitrogen is used as fertilizer for human food production and much is unintention-20
ally widely distributed by uncontrolled hydrologic and atmospheric transport (Howarth et al., 1996). In humic climates a considerable fraction of the surplus N from fields and meadows ends up in rivers. A study of 16 different watersheds along the east coast of the United States showed high variability in nitrogen sources and the proportion exported (Boyer et al., 2002). A large but not well constrained share of that nitrogen 25
BGD
3, 475–511, 2006 Source identification of riverine nitrate M. Voss et al. Title Page Abstract Introduction Conclusions References Tables Figures J I J I Back CloseFull Screen / Esc
Printer-friendly Version
Interactive Discussion
EGU
areas suffer under the riverine nitrogen load (Galloway and Cowling, 2002).
The nitrogen export as a function of land use can best be studied in well-described catchments like that of the Baltic Sea, a shallow, intra-continental, brackish sea with an area of 400 000 km2 and a four times larger drainage basin. Baltic rivers have a combined mean fresh water inflow of 15 400 m3s−1 (HELCOM, 2002), resulting in 5
salinities around 2 in the northernmost Gulf of Bothnia and still only 7–8 in surface waters of the Baltic Proper, where anoxic conditions below the marked halocline at 60– 80 m depth generally favour phosphate release from deep sediments. A rapid increase in nitrate concentrations in the central Baltic Sea in the 1970s has been attributed to river nitrogen loading, since catchment fertilizer usage increased drastically in this 10
period (Larsson et al., 1985; Nausch et al., 1999). Recent studies have challenged this view and suggest that much of the river N-load is sequestered and denitrified already near the coast (Voss et al., 2005). But there is still no doubt that the low winter N/P-ratios found in the Baltic proper favour high combined nitrogen inputs via nitrogen fixing organisms (Elmgren, 2001).
15
Eutrophication is a major environmental issue in the Baltic proper, and particularly in its coastal regions, where most of the total nitrogen input is from rivers (Elmgren, 2001). St ˚alnacke (1999) estimated the input of nitrate from the five largest rivers, Vistula, Daugava, Oder, Neva, and Nemunas, for the period 1983–1999 to 183 kt yr−1of nitrogen, about half of the total annual riverine nitrate delivery to the Baltic. These rivers 20
enter the Baltic Sea in the south and east, and – except for Neva – all drain densely populated agricultural areas. Agriculture is thus a major source of riverine nitrate, to which is added sewage from urban areas and industries. Atmospheric deposition is the second largest diffuse nitrate source for the Baltic Sea and less well constrained than the river load (Granat, 2001; Grimvall and St ˚alnacke, 2001).
25
The stable isotope signatures of nitrogen (δ15N-NO−3) and oxygen (δ18O-NO−3) have been used successfully in the past to attribute nitrate in river water to specific sources. Thus nitrate in streams during early snowmelt was shown to originate from pre-melt periods and not from the nitrate deposited in winter (Kendall, 1998; Kendall et al.,
BGD
3, 475–511, 2006 Source identification of riverine nitrate M. Voss et al. Title Page Abstract Introduction Conclusions References Tables Figures J I J I Back CloseFull Screen / Esc
Printer-friendly Version
Interactive Discussion
EGU
1995). A comparison of 16 watersheds in the US corroborated the hypothesis that the isotopic signature of nitrate differs between forested catchments and agricultural land (Mayer et al., 2002). The reasons for such differences in N and O-isotope ratios in nitrate are both the ultimate sources of N and O, and kinetic fractionation processes which tend to separate light isotopes (14N and16O) from heavier (15N and18O, Kendall, 5
1998; Mariotti et al., 1984). Nitrate produced by the Haber-Bosch-process has isotope ratios close to atmospheric nitrogen for N (0‰) and oxygen for O (23.5‰, Amberger and Schmidt, 1987). When soil organic matter is degraded and nitrified, the resulting nitrate δ18O value decreases depending on the source water used (Mayer et al., 2001). Denitrification generally leads to isotope values increasing at a 2:1 ratio for N and O, 10
but deviations from this ratio due to temperature variability and substrate concentra-tion have been observed (B ¨ottcher et al., 1990). If substrate limitaconcentra-tion leads to total conversion of nitrate to dinitrogen gas there is no fractionation (Brandes and Devol, 1997). The highest reported δ18O values are found in nitrate from atmospheric depo-sition (Kendall, 1998; Kendall et al., 1995), while the highest δ15N values have been 15
measured in manure and septic tanks, where 14N is preferentially lost via ammonia volatilisation (Heaton, 1986). The ranges of isotope values for different sources tend to overlap, but even then measurements of both stable isotope pairs can often give a unique characterization of nitrate from different sources (Kendall, 1998).
The Baltic Sea catchment is especially suitable for comparing nitrate sources in 20
rivers, since northern rivers drain near-pristine catchments, southern ones densely populated watersheds with much agriculture. The present study was presented on the Conference on “Significant Processes, Observations and Transformation of Ocean Ni-trogen” (SPOT-ON) as an example for human influence on the catchments’ scale. We use dual-isotope data for nitrate as a tool for determining nitrate sources in river sys-25
tems, while also evaluating seasonal changes in isotopic values. Additionally, nitrate source attributions by isotope mixing models and an emission model are attempted. We demonstrate the basic feasibility and practical limitations of such studies for the characterization of catchments, and establish rough relationships between land use
BGD
3, 475–511, 2006 Source identification of riverine nitrate M. Voss et al. Title Page Abstract Introduction Conclusions References Tables Figures J I J I Back CloseFull Screen / Esc
Printer-friendly Version
Interactive Discussion
EGU
and isotopic signatures.
2 Material and methods
2.1 River sampling and isotopic analysis
River water was sampled monthly for 2 years (July 2000 to June 2002), except biweekly in the Vistula and Oder, and approximately bimonthly in the Neva. Samples were taken 5
with a bucket at the official HELCOM river monitoring sites, which are located some 20–30 km upstream, except 100 km in the Oder. Water samples were processed in the laboratory within hours of sampling. Nitrate, nitrite, ammonia, and phosphate were measured following standard protocols (Grasshoff et al., 1983), while total nitrogen and phosphorus were determined through simultaneous persulphate oxidation of N and P 10
(UNESCO, 1983). Not all variables were always measured for all rivers (Table 1). A water sample of 0.5–1 L was filtered through precombusted GF/F filters, which were then dried, and the filtrate for δ15N-NO−3 analysis preserved with 1ml of concentrated HCl. Also, 0.5–6.0 L was filtered through 0.45 µm membrane filters, transferred to a cation exchange resin (5 ml AG 50W-X4, H+-form; Biorad), followed by collection of 15
at least 60 µmol nitrate on an anion exchange resin (2 ml AG1-X8, Cl−-form; Biorad), according to a method of Silva (2000). The resin columns were stored cool until fur-ther preparation at the University of Bochum, where the samples were eluted from the anion exchange resin with 15 ml 3M HCl. Then a solution of BaCl2·2 H2O (10%) was added to remove SO2−4 and PO3−4 , precipitated BaSO4 and Ba3(PO4)2 being re-20
moved by filtration (0.45 µm membrane filter, cellulose-acetate), and the filtrate passed through a cation exchange resin (5 ml AG 50W-X4, H+-form; Biorad) to eliminate the excess Ba2+. The filtrate was neutralized with approximately 7 g Ag2O to a pH of 5.5–6, precipitated AgCl and remaining Ag2O was removed by filtration (0.45 µm membrane filter, cellulose-acetate), and the solution freeze-dried. Ten mg of the solid AgNO3were 25
BGD
3, 475–511, 2006 Source identification of riverine nitrate M. Voss et al. Title Page Abstract Introduction Conclusions References Tables Figures J I J I Back CloseFull Screen / Esc
Printer-friendly Version
Interactive Discussion
EGU
analyses the tubes were evacuated and sealed with a torch. The samples were com-busted in a furnace at 850◦C for about 1 h and cooled down slowly to room temperature. The resulting CO2was extracted cryogenically at a vacuum distillation line. The δ18O analysis was carried out with a Thermo Delta S mass spectrometer. The isotope val-ues are given in per mil (‰) relative to Vienna standard mean ocean water (VSMOW) 5
defined as 0‰. Precision of the measurement was verified by repeated analysis of an internal laboratory standard (AgNO3) with a standard deviation of 1σ=0.38 (n=80).
Nitrate-δ15N analyses were carried out with the diffusion method from Sigman et al. (1997). The acidic filtrate samples were brought to a pH of 10–11 with NaOH and MgO. After 10 days of incubation of the basic solution in an oven (5 days at 60◦C) 10
and on a shaker table (5 days at 40◦C) the acidified filter sandwiched between two Teflon membranes was removed and dried. Repeated standards from a nitrate solution showed a standard variation of 1σ=0.5‰. The GF/F filters from δ15N-NO−3 analyses and the POC/PON filtration were wrapped in tin cups and combusted in an elemental analyser (Thermo 1108) before the gas was measured in a Finnigan Delta S or Delta 15
plus. Calibration substance for the PON and POC analysis was acetanilide. Standard gases were high purity N2and CO2gases from 50 L cylinders calibrated against IAEA standard substances. As a lab-internal standard a protein, peptone (Merck), was run after every fifth sample. Values are conventionally given in permill deviation from the standards which were air N2for nitrogen and V-PDB for CO2. All δ15N-NO−3 samples 20
were analysed in duplicates and a mean value taken. If the standard variation was >0.5‰ repeated analyses were performed.
The Swedish rivers were analysed for the isotopic composition of total nitrogen only, since nitrate concentrations were usually too low for nitrate δ15N measurements (<3 µM). A 500 ml sample of surface water was immediately frozen and transported to 25
the lab. After thawing 300 ml were filtered under pressure through a 25 mm Whatman GF/F glass-fibre filter (precombusted 4 h at 400◦C). The filters were dried for 24 h at 60◦C in glass vessels. The filtrate was reduced to ∼5 ml at 50◦C in a vacuum rotava-por (Laborota 4000), and freeze dried onto a 25 mm Whatman GF/F glass-fibre filter
BGD
3, 475–511, 2006 Source identification of riverine nitrate M. Voss et al. Title Page Abstract Introduction Conclusions References Tables Figures J I J I Back CloseFull Screen / Esc
Printer-friendly Version
Interactive Discussion
EGU
(precombusted 4 h at 400◦C). All filters were wrapped in ethanol-washed aluminium foil and stored in air-tight plastic containers before being analysed as described above for POC/PON filters.
2.2 Determinations of vegetation cover in catchments and the calculation of N-emissions
5
Calculations of percentage land cover for each drainage area used ARC VIEW® 8.1 and data from the Global Land Cover (GLC) 2000 database (European Commission, Joint Research Centre, 2003; http://www-gem.jrc.it/glc2000). Drainage basin bound-aries were also obtained from the Join Research Centre.
The atmospheric N deposition (wet and dry; reduced and oxidized N forms) used 10
was obtained from the UNECE/EMEP emission database, which provides annual N deposition over the Baltic Sea catchment on a sub-catchment scale from 1980 onwards
(http://www.mare.su.se/nest/).
N-emissions within the various river catchments from sewage, manure and mineral fertilizers each having characteristic N isotope values were calculated to compare their 15
shares with the observed isotopic values measured at the river mouths. N emissions from sewage were calculated from the total population living in a watershed and the connectedness of the total population to primary, secondary and tertiary treatment (EUROSTAT). We assumed that N emissions per capita are 3.9 kg yr−1 (Johnes et al., 1996) and reductions in primary, secondary and tertiary treatment is 10%, 25% and 20
75%, respectively. N emissions from manure were estimated from livestock data of pigs and cattle in a watershed. N emissions per diary cows ranged between 50–100 kg N yr−1as a function of milk production; emissions from other cattle, sows and slaughter pigs were estimated as 34, 22, and 9 kg N yr−1, respectively (Claesson and Steineck, 1991). Emissions from mineral fertilizers were taken from FAO statistics (FAOSTAT, 25
2005), whereas total amounts used per watershed were calculated using Geograph-ical Information Systems (GIS) information on total hectares of arable land that were multiplied by the national average of mineral fertilizer used per hectare in a respective
BGD
3, 475–511, 2006 Source identification of riverine nitrate M. Voss et al. Title Page Abstract Introduction Conclusions References Tables Figures J I J I Back CloseFull Screen / Esc
Printer-friendly Version
Interactive Discussion
EGU
country.
2.3 River flow rate and load calculation
Flow rates of the Polish, German, and Finnish rivers were measured continuously at the locations of the hydrological stations (HELCOM, 2004), and the annual and monthly runoff calculated using WMO guidelines (World Meteorological Organization, 1994). 5
Monthly flow rates (given in m3s−1) were multiplied with the respective concentra-tions. Annual isotopic data were weighted with the loads, after the formula:
δ15Nwml = P i δ15Ni × concNi × flowi P i concNi× flowi
Where δ15Nwml is the load weighted annual isotope value, δ15Ni the isotope value for a certain month, conc. Ni is the concentration in µmol and flowi the flow in m3month−1. 10
2.4 Isotope mixing models and statistics
The source attribution of the riverine nitrate was made with the Phillips and Koch (2002) isotope mixing programm, available at http://www.epa.gov/wed/pages/models.htm. The basic formulas are:
δ15NR=fFδ15NF + fPδ15NP + fAδ15NA 15
δ18OR=fFδ18OF + fPδ18OP + fAδ18OA 1= fF + fP + fA,
where δ15N and δ18O are the nitrate isotope values from the rivers (R), and the three sources for IMM-1, farmland/agricultural land (F), pristine soils (P), and atmospheric deposition (A), while for IMM-2 the sources were sewage/manure (F), mineral fertilizer 20
BGD
3, 475–511, 2006 Source identification of riverine nitrate M. Voss et al. Title Page Abstract Introduction Conclusions References Tables Figures J I J I Back CloseFull Screen / Esc
Printer-friendly Version
Interactive Discussion
EGU
(P) and atmospheric deposition (A). The sum of all three sources is assumed to be 100%.
Isotopic source data for farmland/agricultural land, and pristine soils for our IMM-1 calculation were taken from a similar study in the German Warnow River (Deutsch et al., 2006) only for atmospheric deposition in the north (for the Kemijoki) we took the 5
data from Burns and Kendall (2002), Table 2. We thus distinguish in the IMM-1 cal-culation nitrate from agricultural land, from pristine soil runoff, and from atmospheric deposition. The EM distinguishes between nitrate from mineral fertilizers and nitrate from sewage/manure. The sewage/manure nitrate can either come from organic fer-tilization of fields or from septic tanks from private households. We tried to verify the 10
information from the EM model by means of a second IMM run (IMM-2), where we took isotope values from the literature for mineral fertilizer and sewage/manure (Ta-ble 2). Atmospheric deposition was also included in the IMM-2, but pristine sources of nitrate were neglected.
A principal component analysis (PCA) based on a correlation matrix including all 15
monthly mean variables was carried out with Statistica® (vers. 6). The number of available data is given in Table 1. This excluded the Swedish rivers, for which we had no component-specific isotope data. The included rivers were characterised according to their biogeochemical similarity. An ANOVA with the variables from Table 1 was carried out on the web page: http://www.physics.csbsju.edu/stats/anova.htmlto group 20
rivers additionally according to single variables.
3 Results
3.1 Sites description – differences between catchments
The catchments of the Baltic Sea stretches from 68◦N to 49.5◦N and thus covers a wide span of climatic conditions from subarctic to temperate (Fig. 1). The Baltic Sea 25
BGD
3, 475–511, 2006 Source identification of riverine nitrate M. Voss et al. Title Page Abstract Introduction Conclusions References Tables Figures J I J I Back CloseFull Screen / Esc
Printer-friendly Version
Interactive Discussion
EGU
1100 for the Paimionjoki (Table 3). Accordingly, we find a wide range of natural vari-ability in vegetation cover, land use and population density (Table 3). The nitrogen con-tent in the rainfall of the catchments correlates well with the population density (n=11, r2=0.897, p<0.001) varying from 200 kg N m−2yr−1 in the Kemijoki catchments with just 2 Ind. km−2to almost 1700 kg N m−2yr−1 in the Oder River catchments with mean 5
population of 138 ind. km−2 to (Table 3). Today the southern catchments have much less forests than the northern part, although deforestation over the past 40–50 years almost ceased. The Peene catchments has only 17% forests left, while the Swedish rivers, the Finnish river Kemjoki and part of the Neva catchments have largely kept its original vegetation and still have up to 86% forests (Table 3). However, Kemijoki is 10
highly fragmented by damming (http://earthtrends.wri.org/) like the Swedish rivers Lule ¨
Alv and Angerman ¨alven (Humborg et al., 2002). Flow-weighted winter NO−3 concentra-tions vary from 10 and 27 µMol in Kemijoki and Neva, respectively, to 270 µMol in the Vistula (Figs. 2–4). Artificial and agricultural used areas range from 1% for the Lule ¨Alv to 81% for the Peene River (Table 3).
15
3.2 Annual patterns in nutrient and stable isotope data
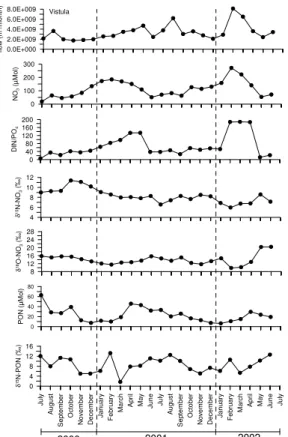
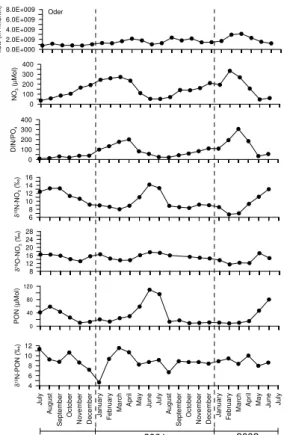
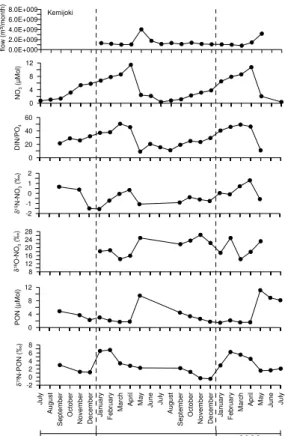
Averaged monthly data from three rivers, the Vistula (Fig. 2), the Oder River (Fig. 3), and the Kemijoki (Fig. 4) show clear seasonal patterns. Water flows are usually highest in February to April; the northernmost river, Kemijoki, has its peak flow in May. Nutrient concentrations co-vary with the flow as exemplified by the nitrate data (Figs. 2–4). This 20
means that highest nutrients loads are being delivered to the coastal zones in late winter and early spring. Since nitrate is the most abundant inorganic nitrogen form, the DIN/DIP ratios in all the rivers are almost always above 16 (the Redfield ratio) and have highest deviations from the Redfield ratio in the early summer months. Extremes reach 189 in the Vistula and 461 in the Neva River in winter (Kuuppo et al., 2006). 25
The δ15N-NO−3 values are usually higher in winter than in summer, while the δ18O data have more an opposite tendency. PON concentrations have clear peaks in spring and summer (as POC, not shown), while their corresponding isotope values have a less
BGD
3, 475–511, 2006 Source identification of riverine nitrate M. Voss et al. Title Page Abstract Introduction Conclusions References Tables Figures J I J I Back CloseFull Screen / Esc
Printer-friendly Version
Interactive Discussion
EGU
significant tendency. The δ15N of the PON is not correlated with the PON loads. Within season, more significant relationships between concentration and isotopic signature can be seen.
A comparison reveals a similar δ15N-NO−3 pattern in all rivers, with low values in win-ter, which increase towards summer (Fig. 5a). Peene, Paimionjoki, and Kokemaenjoki 5
have higher values in winter. High amplitude of 8‰ was determined in the southern rivers Vistula and Oder while the Kemijoki had a low one with 3‰. We measured up to 13.2‰ in the Oder River while the Kemijoki had a δ15N value of −1.6‰ in winter 2000/2001 (Fig. 5a). In the Swedish river Lule ¨Alven we measured an even lower value of <−3‰. All other rivers were in between these extremes. Differences be-10
tween years are also obvious with a clearer seasonal variation in the sampling period 2000/2001 than in 2001/2002. A peak in δ15N-NO−3 in summer was detectable for the Oder, Peene, and Paimionjoki, where we had the highest DIN loads among all rivers investigated (Fig. 5a) and >40% farmland. The Vistula belonging into the same group of farmland dominated catchments (66%) has a less clear isotopic pattern. The δ15 N-15
NO−3 values from the Kokemaenjoki were highest in winter with only slight peak in late summer and are thus similar to the rivers described above, although the catchments are dominated by 79% forests (Table 3). Kemijoki and Neva River have considerably lower δ15N values of −0.1 and 2.4‰, respectively. The Kemijoki has small peaks before the actual spring flow occurs (Fig. 4). Neva δ15N-NO−3 data show no seasonal pattern 20
(Fig. 5a) which may be caused by some buffering effect of the huge Lake Ladoga, located approximately 70 km upstream from the city of St. Petersburg (Kuuppo et al., 2006).
The δ18O-NO−3 river data vary less with season than the δ15N (Fig. 5b), but Vistula, Oder and Peene show elevated values in summer. The δ18O values are lowest in the 25
southern Polish and German rivers and Paimionjoki and higher in the Nordic rivers (Fig. 5b, Table 3). Values over 20‰ are only found in the Nordic rivers at relatively low nitrate concentrations (<25 µmol l−1).
BGD
3, 475–511, 2006 Source identification of riverine nitrate M. Voss et al. Title Page Abstract Introduction Conclusions References Tables Figures J I J I Back CloseFull Screen / Esc
Printer-friendly Version
Interactive Discussion
EGU
3.3 Statistics
A principal component analysis (PCA) gave 94.8% explained variance in the first three eigenvectors and thus found almost identity between pairs of rivers: Vistula and Oder, Neva and Kemijoki and similarity between Kokemaenjoki and Paimionjoki. The Peene River was slightly separate from all others (Fig. 6). However, the ANOVA test showed 5
that the similarity between variables was rather complex, e.g. NO−3 concentrations of Vistula, Oder and Peene were indistinguishable, likewise the ones from Paimionjoki, Kokemaenjoki, Kemijoki, and Neva. The PO3−4 concentrations from the Vistula, Oder, Peene, and Kokemaenjoki were indistinguishable and also for the other three rivers, Kemijoki, Neva, and Paimiojoki. The isotope data of nitrate identified two main groups 10
and separated the southern from the Nordic rivers.
3.4 Land use, isotopic composition of nitrate and source attribution
The anthropogenic nitrate sources that are considered in the following text are either from farmland fertilized with manure or mineral fertilizer summarized as mixed fertilizer, or from sewage from septic tanks of private households and treatment plants. The 15
organic N-sources are usually summarized as manure/sewage. Additionally, nitrate from atmospheric deposition and from pristine soils is evaluated.
There was a positive correlation between the load weighted δ15N-NO−3 values and the share of farmland/agricultural land in the catchments, as calculated from GLC data (Table 4, Fig. 7), and a less significant negative relationship with the δ18O-NO−3 values 20
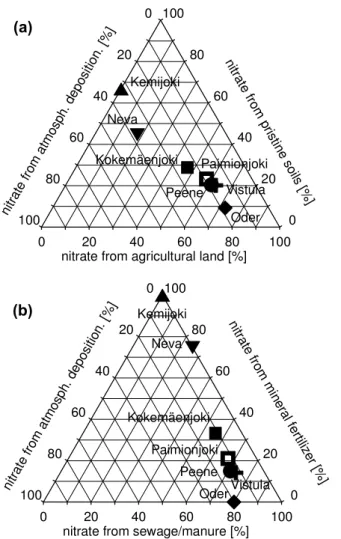
(Table 4, Fig. 7). Forest coverage also correlated with the annual mean δ18O data, but positively. Other land use categories like wetland, bare land, ice or snow were not considered in detail since they are only relevant for the Nordic rivers. The IMM-1 results independently confirm that low δ15N values and high δ18O values result from pristine nitrate sources, while the southern rivers receive up to 80% of its nitrate from 25
soils with mixed fertilization and sewage (Fig. 8a). We also used a source emission model (EM) which allowed distinction between nitrate from sewage/manure and mineral
BGD
3, 475–511, 2006 Source identification of riverine nitrate M. Voss et al. Title Page Abstract Introduction Conclusions References Tables Figures J I J I Back CloseFull Screen / Esc
Printer-friendly Version
Interactive Discussion
EGU
fertilizer and atmospheric deposition (Table 4), but did not include pristine soil runoff. Thus, atmospheric deposition was the only source category included in both models. However, if we summed nitrate from sewage/manure plus mineral fertilizer in the EM we got an approximately 20% larger share of NO−3 from agricultural runoff than in IMM-1 (Table 4).
5
We then tested the EM results with an IMM calculation (IMM-2) using the end mem-bers mineral fertilizer, sewage/manure and atmospheric deposition (Fig. 8b). This gave a meaningful separation only for rivers with a high share of agricultural land and high fertilizer applications. For the Kemijoki the sum of sewage/manure and mineral fertilizer suggest 100% nitrate from these two sources (Fig. 9a). This is unrealistic and an arte-10
fact caused by the omission of pristine sources. The percentages for sewage/manure from the IMM-2 are well correlated with the percentages of nitrate from agricultural land from IMM-1 (Fig. 9a). Nitrate from atmospheric deposition gives very different contribu-tions in IMM-1 and -2 (Fig. 9b), although calculated with the same isotope values, due to the overlap of the δ15N values of atmospheric deposition with the mineral fertilizer 15
data. The N from pristine soils, estimated with the IMM-1, gives percentages that were between the ones from GLC data for forests and wetland/bare, respectively (Fig. 9c).
4 Discussion
4.1 Seasonal variation in the isotopic composition of riverine nitrate
Seasonal changes in nutrient and particulate matter concentrations in rivers are caused 20
by variability in soil runoff and discharge, and in autochthonous production and degra-dation of organic matter (Battaglin et al., 2001). A number of studies have used iso-topic data to attempt to unravel these processes, and to distinguish them from source signals, which can also vary (Chang et al., 2002; Harrington et al., 1998; Mayer et al., 2002; McClelland et al., 1997). It is important to evaluate how the variability of 25
BGD
3, 475–511, 2006 Source identification of riverine nitrate M. Voss et al. Title Page Abstract Introduction Conclusions References Tables Figures J I J I Back CloseFull Screen / Esc
Printer-friendly Version
Interactive Discussion
EGU
concentration is significantly negatively correlated with N-isotope values in the Oder (r=0.84, p>0.001, n=24) and Vistula waters (r=0.46, p>0.02, n=24) suggesting that biological fractionation during nitrate consumption is important. The δ15N-NO−3 data from the Oder (Fig. 3) show this very clearly. Similar results are reported for sites in the agricultural Mississippi River Basin (Chang et al., 2002). Isotopically heavy nitrate 5
may additionally be generated during denitrification when river water infiltrates through soils (Grischek et al., 1997) or riparian river zones (Sebilo et al., 2003). The sharp increase in the N:P ratios in summer also suggest nitrate uptake until phosphate lim-itation occurs. Denitrification in soils may only be important in autumn and in winter, while nitrification is effective around the year, especially after fertilization with ammonia 10
and urea compounds. Therefore, high δ15N-NO−3 values in the rivers may be nitrifica-tion/denitrification transformation taking place mainly in autumn and winter. Chang et al. (2002) identified different N-sources by their isotopes in river nitrate. They assume that isotopically heavy soil-N in winter is from manure and mineral fertilizers influence the signatures in spring. Although Oder and Vistula are both draining catchments with 15
up to 66% of agriculture land, it is very unlikely that fertilizer N enters the rivers directly. Usually the nitrogen is processed in the soils before it enters the river. Livestock and septic tanks effluents may add nitrogen rather directly. These sources are known to have high δ15N-NO−3 values of up to 14‰ (Aravena et al., 1993) or even 20‰ (Heaton, 1986). Isotopically heavy sources are responsible for the overall high δ15N signal in 20
Oder, Vistula, Peene and Paimionjoki and seem to further increase when biological production starts.
The highest PON concentrations were recorded in summer, supporting an origin from autochthonous production in the rivers, but there was no clear relationship to the isotope signal. This is to be expected when a variety of N-sources reach the river, 25
where assimilation and dissimilation processes occur simultaneously (Battaglin et al., 2001; Kendall et al., 2001).
Forests in northern Scandinavia are little affected by anthropogenic fertilization (Humborg et al., 2004) and presumably leach nitrate from soils that have similar δ15
N-BGD
3, 475–511, 2006 Source identification of riverine nitrate M. Voss et al. Title Page Abstract Introduction Conclusions References Tables Figures J I J I Back CloseFull Screen / Esc
Printer-friendly Version
Interactive Discussion
EGU
NO−3 values as the rivers draining mainly forested catchments in North America, where values <5‰ (Mayer et al., 2002) and 2‰ (Harrington et al., 1998) are reported. The Kemijoki, with a catchment of over 80% forest, has the lowest δ15N values of all sam-pled rivers (−0.1‰). Furthermore, it has a positive relationship (r=0.42, p>0.1) be-tween monthly mean nitrate concentration and δ15N. Since the nitrate concentration 5
and the δ15N increase almost simultaneously until April 2002 and then drop (Fig. 4) there must be a source of nitrate with low δ15N values and low nitrate concentrations. This could be nitrate from pristine soils or from atmospheric deposition. The increasing δ18O values also suggest nitrate from snowmelt since δ18O-NO−3 in snow from Green-land is reported with 65–80‰ (Hastings et al., 2004) and from the Rocky Mountains 10
with 46–55‰ in the precipitation (Burns and Kendall, 2002). Even a low contribution of NO−3 with these high values could easily raise our winter δ18O signal of 14–15‰ to >26‰ in spring and simultaneously dilute the NO−3 concentration in the rivers.
Although we find the same negative relationship of NO−3 concentration over δ18 O-NO−3 in the Vistula and Oder rivers we assume here that 18O/16O fractionation during 15
primary production is the reason, since nitrate uptake fractionates18O/16O in the same way as it does for15N/14N (Granger et al., 2004).
Seasonal changes in monthly concentration and isotopic compositions was also ob-served in the rivers Kokemaenjoki, Paimionjoki, Neva, Peene and the Swedish Rivers (Fig. 5), but are not discussed in detail. Nevertheless, significant differences exist 20
among the rivers in annual mean isotope values. Although the river isotope signatures change with season, we assume that differences in the annual mean isotopic compo-sition of nitrate can be related to land use. Annual means should be more reliable than measurements at any single time of the year.
4.2 Comparison of GLC based land use estimates with isotope data 25
There is a highly significant relationship between GLC-derived estimates of agricultural land area and δ15N-NO−3 (Fig. 7) which spans a range from −0.1 to 8.3‰. The same
BGD
3, 475–511, 2006 Source identification of riverine nitrate M. Voss et al. Title Page Abstract Introduction Conclusions References Tables Figures J I J I Back CloseFull Screen / Esc
Printer-friendly Version
Interactive Discussion
EGU
relationship was found for a river system in Vermont, where δ15N-NO−3 values of 2.0 to 7.3‰ were measured (Harrington et al., 1998).
Nitrate leaching from over-fertilized soils is known to be high in δ15N (Aravena et al., 1993; Chang et al., 2002), for several reasons. Denitrification raises the δ15N in anoxic zones of the soils (Ostrom et al., 1998). The nitrate isotope values increase 5
with depth in the soil, suggesting a sequestering and fractionation of nitrogen bearing compounds with depth (Nadelhoffer and Fry, 1994). Mineral fertilizer is manufactured with approximately 0‰ δ15N-NO−3 (Amberger and Schmidt, 1987) but no such values are found in greater soil depth (Nadelhoffer and Fry, 1994). Ammonia volatilises under basic conditions and is fractionated which leads to increasing isotope values in the 10
remaining fraction (Flipse and Bonner, 1985). Delta15N values of >10‰ seem therefore to be typical for the contribution of manure/sewage (Aravena et al., 1993; Fogg et al., 1998; McClelland and Valiela, 1998). And this nitrogen retains a high isotope value (even though the δ15N is lowered when the compound is first nitrified), which is further increased by subsequent processing (Kendall, 1998). Therefore, not only 15
the amount of fertilizer, but also the velocity of the downward water flow decides the isotope values of the soil water and the soil runoff. Our data from the Oder, Vistula, Peene, and Paimionjoki are lower than sewage/manure but considering the variability of the isotope data we assume that this source and/or the soil runoff from farmland comprise the major riverine nitrate sources. The Kokemaenjoki has little agricultural 20
land (11%) and more forests (79%) in its catchments which is mirrored in lower δ15 N-NO−3 (5.5‰) data. The forests in the Kokemaenjoki and Kemijoki catchments can be regarded as near-pristine, and receive little or no artificial fertilisation. Accordingly, the share of forest coverage is negatively correlated with δ15N-NO−3, a result confirmed also by other studies (Harrington et al., 1998; Mayer et al., 2002).
25
The δ18O values of nitrate from our rivers fall in the range reported for the Mississippi River Basin (Chang et al., 2002). Our annual means of 12–13‰ in Vistula, Oder, Peene and Paimionjoki seem to be typical for agricultural soils, while higher δ18O values from Kokemaenjoki, Kemijoki, and Neva (15–19‰) indicate nitrate resulting from nitrification
BGD
3, 475–511, 2006 Source identification of riverine nitrate M. Voss et al. Title Page Abstract Introduction Conclusions References Tables Figures J I J I Back CloseFull Screen / Esc
Printer-friendly Version
Interactive Discussion
EGU
in forest floors (Mayer et al., 2002) and/ or a contribution from the snow melt (Burns and Kendall, 2002). The δ18O values in NO−3 generated through nitrification in the soils depends on the water source δ18O (Mayer et al., 2001). Our negative relationship between the load weighted δ18O-NO−3 and agricultural land (Fig. 7) is consistent with this conclusion. Furthermore, a plot of δ18O over the percentages of forests in the 5
catchments gives a weak positive correlation (n=7, r=0.73, p<0.1). Bare land and open water only occurs in significant shares in the northern catchments and the nitrate in the precipitation could have raised our δ18O-NO−3. Thus, δ18O values are generated through land use practices in the southern catchments and by nitrification in forest soils plus contributions from snow melt and rain in the northern catchments.
10
We conclude from this study that δ15N-NO−3 values of 6–8‰ indicate >60% arti-ficial/agricultural land in the catchment, and that >65% forests results in δ15N-NO−3 -values <6‰. Soil processing after fertilizationgives δ18O-NO−3 values of about 13‰, while values above 15‰ suggest a predominance of nitrate from nitrification in pristine forest soils and melting snow.
15
4.3 Comparison of isotope mixing and the emission model
Estimates on nitrogen sources – especially diffuse ones – are urgently needed to guide management of river catchments. Diffuse nitrogen sources comprise atmospheric de-position and soil runoff. Geographical information systems like the GLC are widely used tools for such source attribution, but independent tests of their reliability are rare 20
(Deutsch et al., 2006). IMMs are assumed to provide such independent checks on land use data. For the IMM-1 calculation we considered only major nitrate sources, omit-ting minor ones with shares between 13% and 0.01%, like surface runoff from urban areas, wetlands or lakes (Table 4, GLC data). We had to restrict ourselves to three sources because nitrate contains only two pairs of stable isotopes. Additional isotope 25
pairs would have been necessary for a finer resolution. The GLC-derived proportion of agricultural land and forests agreed reasonably with the IMM-1 data for nitrate from
BGD
3, 475–511, 2006 Source identification of riverine nitrate M. Voss et al. Title Page Abstract Introduction Conclusions References Tables Figures J I J I Back CloseFull Screen / Esc
Printer-friendly Version
Interactive Discussion
EGU
agricultural land and pristine areas, with r=0.83, n=7, p<0.02 for the first and r=0.76, n=7, p<0.05 for the second correlation, respectively. Relative contributions from these three sources according to IMM-1 are shown in Fig. 8a. The model separates two ma-jor groups of rivers – southern rivers and Nordic rivers. In other words δ15N-NO−3 of 7–8‰ indicates 60–70% of nitrate from farmland (Table 4, Fig. 8a).
5
The EM model separated the source category fertiliser into mineral fertilizers and sewage/manure. The IMM-2 model calculations, with these two fertiliser types and at-mospheric deposition as nitrate sources (Fig. 8b), still separated the Kemijoki and Neva from all other rivers, but indicated that they receive a high share of nitrogen from mineral fertilisers. This is extremely unlikely and presumably the result of the close similarity of 10
the end members for atmospheric deposition and mineral fertilizers. Another weakness of the IMM-2 model is that the sum of mineral fertilizer and sewage/manure is close to 100% for all rivers (Fig. 9a), which is highly questionable for Kemijoki, Kokemaenjoki, and Neva and probably Paimionjoki, but fits the estimate of nitrate from farmland closely for Oder, Vistula and Peene. The IMM-2 model output therefore seems applicable only 15
to highly fertilized catchments, where a source attribution for different fertilizer types is meaningful.
Model estimates of atmospheric deposition diverge widely for the Nordic rivers and Paimionjoki, but agree better for the other rivers (Fig. 9b). The EM model deviates most from the IMM-2, presumably because it lacks pristine nitrogen. We regard atmospheric 20
deposition estimates from IMM-1 as more reliable, since they compare well with GLC estimates of nitrate emission from farmland and pristine soils.
Finally, pristine sources in IMM-1 were compared with the GLC data for forest and wetland/bare/open water (Fig. 9c). Again, the largest deviations were observed for the Nordic rivers, with the same trend of pristine areas dominating the northern catch-25
ments. We assume that the IMM-1 estimates for pristine soils correspond mainly to forested areas with some contribution of wetland and open land or lakes. We have discussed this correlation between isotope values and vegetation cover previously. It should be noted that nitrate concentrations in rivers draining pristine, forested areas
BGD
3, 475–511, 2006 Source identification of riverine nitrate M. Voss et al. Title Page Abstract Introduction Conclusions References Tables Figures J I J I Back CloseFull Screen / Esc
Printer-friendly Version
Interactive Discussion
EGU
are very low compared to Vistula and Oder, below 30 µmol l−1.
We conclude that IMMs are helpful tools for verifying land use estimates made with other approaches. Careful interpretation is necessary for catchments dominated by nitrate sources not well constrained. Large catchments with little anthropogenic influ-ence like the Kemijoki and the Neva (excepting the city of St. Petersburg) need to be 5
addressed separately. In pristine areas EMs are not useful, unless they include pris-tine nitrogen. Use of a second IMM is useful for differentiating the contributions from different fertilizer types in catchments with a high proportion of farmland.
Acknowledgements. We thank the many helpful people who sampled rivers around the Baltic
Sea, with special thanks to S. Sitek from the Sea Fisheries Institute, Branch in Swinoujscie.
10
Support by the “Landesamt f ¨ur Umwelt und Geologie” in G ¨ustrow (Ms. K ¨uhn) in sampling the Peene is gratefully acknowledged. I. Liskow coordinated sampling and analyses in the Warnem ¨unde laboratory. This research was part of the SIGNAL (Significance of anthropogenic nitrogen for central Baltic Sea N-cycling) project, which is a part of the EC IMPACT cluster (Anthropogenic impacts on the marine environment), and was supported by the European
15
Commission’s Environment and Sustainable Development Programme under contract number EVK3-CT-1999-00020.
References
Amberger, A. and Schmidt, H.-L.: Nat ¨urliche Isotopengehalte von Nitrat als Indikatoren f ¨ur dessen Herkunft, Geochim. Cosmochim. Acta, 51, 2699–2705, 1987.
20
Aravena, R., Evans, M. L., and Cherry, J. A.: Stable isotopes of oxygen and nitrogen in source identification of nitrate from septic systems, Ground Water, 31(2), 180–186, 1993.
Battaglin, W. A., Kendall, C., Chang, C. C. Y., Silva, S. R., and Campbell, D. H.: Chemical and isotopic evidence of nitrogen transformation in the Mississippi River, 1997–98, Hydrol. Progress, 15, 1285–1300, 2001.
25
B ¨ottcher, J., Strebel, O., Voerkelius, S., and Schmidt, H.-L.: Using isotope fractionation of nitrate-nitrogen and nitrate-oxygen for evaluation of microbial denitrification in a sandy aquifer, J. Hydrol., 114, 413–424, 1990.
BGD
3, 475–511, 2006 Source identification of riverine nitrate M. Voss et al. Title Page Abstract Introduction Conclusions References Tables Figures J I J I Back CloseFull Screen / Esc
Printer-friendly Version
Interactive Discussion
EGU Boyer, E. W., Goodale, C. L., Jaworski, N. A., and Howarth, R. W.: Anthropogenic
nitro-gen sources and relationships to riverine nitronitro-gen export in the northeastern U.S.A., Bio-geochem., 57/58, 137–169, 2002.
Brandes, J. A. and Devol, A. H.: Isotopic fractionation of oxygen and nitrogen in coastal marine sediments, Geochim. Cosmochim. Acta, 61(9), 1793–1801, 1997.
5
Burns, D. A. and Kendall, C.: Analysis of15N and18O to differentiate NO−3 sources in runoff at two watersheds in the Ctaskill Mountains of New York, Water Resour. Res., 38, 9-1–9-11, 2002.
Chang, C. C. Y., Kendall, C., Silva, S. R., Battaglin, W. A., and Campbell, D. H.: Nitrate stable isotopes: tools for determining nitrate sources among differnt land uses in the Mississippi
10
River Basin, Can. J. Fish. Aquat. Sci., 59, 1874–1885, 2002.
Claesson, S. and Steineck, S.: V ¨axtn ¨aring, hush ˚allning och milj ¨o (in Swedish), Uppsala, 1991. Deutsch, B., Liskow, I., and Voss, M.: Identification and quantification of diffuse nitrogen inputs
into a river system using stable isotopes of oxygen and nitrogen in nitrate, Chemical Geology, accepted, 2006.
15
Elmgren, R.: Understanding Human Impact on the Baltic Ecosystem: Changing Views in Re-cent Decades, Ambio, 30(4–5), 222–231, 2001.
FAOSTAT: Agricultural data, FAO http://faostat.fao.org/faostat/collections?subset=agriculture, 2005.
Flipse, W. J. and Bonner, F. T.: Nitrogen-Isotope Ratios of Nitrate in Ground Water Under
20
Fertilized Fields, Long Island, New York, Ground Water, 23(1), 59–67, 1985.
Fogg, G. E., Rolstom, D. E., Decker, D. L., Louie, D. T., and Grismer, M. E.: Spatial variation in nitrogen isotope values beneath nitrate contamination sources, Ground Water, 36(3), 418– 426, 1998.
Galloway, J. N. and Cowling, E. B.: Reactive Nitrogen and The World: 200 Years of Change,
25
Ambio, 31(2), 64–71, 2002.
Galloway, J. N., Schlesinger, W. H., Il, H. L., Michaels, A., and Schnoor, J. L.: Nitrogen fixation: Antropogenic enhancement-environmental response, Global Biochem. Cycles, 9(2), 235– 252, 1995.
Granat, L.: Deposition of nitrate and ammonium from the atmosphere to the Baltic Sea, in: A
30
Systems Analysis of the Baltic Sea. Ecological Studies, edited by: Wulff, F. V., Rahm, L. A., and Larsson, P., Springer-Verlag, Berlin Heidelberg, pp. 133–148, 2001.
oxy-BGD
3, 475–511, 2006 Source identification of riverine nitrate M. Voss et al. Title Page Abstract Introduction Conclusions References Tables Figures J I J I Back CloseFull Screen / Esc
Printer-friendly Version
Interactive Discussion
EGU gen isotope fractionation of nitrate during assimilation by cultures of marine phytoplankton,
Limmnol. Oceanogr., 49(6), 1763–1773, 2004.
Grasshoff, K., Ehrhardt, M., and Kremling, K.: Methods of Seawater Analysis, Verlag Chemie, 419 pp., 1983.
Grimvall, A. and Stalnacke, P.: Riverine Inputs of nutrients to the Baltic Sea, in: A Systems
5
Analysis of the Baltic Sea. Ecological Studies, edited by: Wulff, F. V., Rahm, L. A., and Larsson, P., Springer-Verlag, Berlin Heidelberg, p. 113–131. 2001
Grischek, T., Hiscock, K. M., Metschies, T., Dennis, P. F., and Nestler, W.: Factors affecting den-itrification during infiltration of river water into a sand and gravel aquifer in Saxony, Germany, Water Res., 32(2), 450–460, 1997.
10
Harrington, R. R., Kennedy, B. P., Chamberlain, C. P., Blum, J. D., and Folt, C. L.: 15N enrich-ment in agricultural catchenrich-ments: field patterns and applications to tracking Atlantic salmon
(Salmo salar), Chemical Geology, 147, 281–294, 1998.
Hastings, M. G., Steig, E. J., and Sigman, D. M.: Seasonal variations in N and O isotopes of nitrate in snow at Summit, Greenland: Implications for the study of nitrate in snow and ice
15
cores, J. Geophys. Res., 109, D20306, doi:10.1029/2004JD004991, 2004.
Heaton, T. H. E.: Isotopic studies of nitrogen pollution in the hydrosphere and atmosphere: A review, Chemical Geology, 87–102, 1986.
HELCOM: Baltic Sea Environment Proceedings: Environment of the Baltic Sea area 1994– 1998, Baltic Sea Environment Proceedings Helsinki Commission, 82B, 215 pp., 2002.
20
HELCOM: Baltic Sea Environment Proceedings: The Fourth Baltic Sea Pollution Load Com-pilation, Baltic Sea Environment Proceedings, No 93, Baltic Marine Environment Protection Commission, Helsinki 2004.
Howarth, R. W., Billen, G., Swaney, D., Townsend, A., Jarowski, N., Lajtha, K., Downing, J. A., Elmgren, R., Caraco, N., Jordan, T., Berendse, F., Freney, J., Kudeyarov, V., Murdoch, P.,
25
and Zhao-Liang, Z.: Regional Nitrogen Budegts and riverine N & P fluxes for the drainage to the North Atlantic Ocean: Natural and human influences, in: Nitrogen cycling in the North Atlantic Ocean and its Watersheds, edited by: Howarth, R. W., Kluwer Academic Publishers, p. 75–139. 1996.
Humborg, C., Blomqvist, S., Avsan, E., Bergensund, Y., and Smedberg, E.: Hydrological
al-30
terations with river damming in northern Sweden: Implications for weathering and river bio-geochemistry, Global Biogeochem. Cycles, 16(3), 12-1–12-13, doi:10.1029/2000GB001369, 2002.
BGD
3, 475–511, 2006 Source identification of riverine nitrate M. Voss et al. Title Page Abstract Introduction Conclusions References Tables Figures J I J I Back CloseFull Screen / Esc
Printer-friendly Version
Interactive Discussion
EGU Humborg, C., Smedberg, E., Blomqvist, S., M ¨orth, C.-M., Brink, J., Rahm, L., Danielson, A.,
and Sahlberg, J.: Nutrient variations in boreal and subarctic Swedish rivers: Landscape control of land-sea fluxes, Limnol. Oceanogr., 49(5), 1871–1883, 2004.
Johnes, P., Moss, B., and Phillips, G.: The determination of total nitrogen and total phosphorus concentrations in freshwaters from land use, stock headage and population data: Testing
5
of a model for use in conservation and water quality management, Freshwater Biology, 36, 451–473, 1996.
Kendall, C.: Tracing nitrogen sources and cycling in catchements, in: Isotope Tracers in Catch-ment Hydrology, edited by: Kendall, C. and McDonnell, J. J., Elsevier, Amsterdam, Lausanne, New York, p. 519–576,1998
10
Kendall, C., Silva, S. R., and Chang, C. C. Y.: Use of the δ18O and δ15N of nitrate to determine sources of nitrate in early spring runoff in forested catchments, Isotopes in Water Resources Management, IAEA, Vienna, p. 167–176, 1995.
Kendall, C., Silva, S. R., and Kelly, V. J.: Carbon and nitrogen isotopic compositions of partic-ulate organic matter in four large river systems across the United States, Hydrol. Progress,
15
15, 1301–1346, 2001.
Kuuppo, P., Tamminen, T., Voss, M., and Schulte, U.: Nitrogenous discharges from River Neva and St. Petersburg: elemental flows, stable isotope signatures, and their estuarine modifica-tion in the Gulf of Finland, the Baltic Sea, J. Mar. Syst., in press, 2006.
Larsson, U., Elmgren, R., and Wulff, F.: Eutrophication and the Baltic Sea: causes and
conse-20
quences, Ambio, 14, 9–14, 1985.
Mariotti, A., Lancelot, C., and Billen, G.: Natural isotopic composition as a tracer of origin for suspended organic matter in the Scheldt estuary, Geochim. Cosmochim. Acta, 48, 549–555, 1984.
Mayer, B., Bollwerk, S. M., Mansfeldt, T., H ¨utter, B., and Veizer, J.: The oxygen isotope
com-25
position of nitrate generated by nitrification in acid forest floors, Geochim. Cosmochim. Acta, 65(16), 2743–2756, 2001.
Mayer, B., Boyer, E. W., Goodale, C., Jaworski, N. A., Breemen, N. V., Howarth, R. W., Seitzinger, S., Billen, G., Lajtha, K., Nadelhoffer, K., Dam, D. V., Hetling, L. J., Nosal, M., and Paustian, K.: Sources of nitrate in rivers draining sixteen watersheds in the northeastern
30
U.S.: Isotopic constraints, Biogeochemistry, 57/58, 171–197, 2002.
McClelland, J. W. and Valiela, I.: Linking nitrogen in estuarine producers to land-derived sources, Limnol. Oceanogr., 43(4), 577–585, 1998.
BGD
3, 475–511, 2006 Source identification of riverine nitrate M. Voss et al. Title Page Abstract Introduction Conclusions References Tables Figures J I J I Back CloseFull Screen / Esc
Printer-friendly Version
Interactive Discussion
EGU McClelland, J. W., Valiela, I., and Michener, R. H.: Nitrogen-stable isotope signatures in
estuar-ine food webs: A record of increasing urbanization in coastal watersheds, Limnol. Oceanogr., 42(5), 930–937, 1997.
Nadelhoffer, K. J. and Fry, B.: Nitrogen isotope studies in forest ecosystems, in: Stable iso-topes in Ecology and Environmental Science. Methods in Ecology, edited by: Lajtha, K. and
5
Michener, R. H., Blackwell Scientific Publications, Oxford, p. 22–44, 1994.
Nausch, G., Nehring, D., and Aertebjerd, G.: Anthropogenic nutrient load of the Baltic Sea, Limnologica, 29, 233–241, 1999.
Ostrom, N. E., Knoke, K. E., Hedin, L. O., Robertson, G. P., and Smucker, A. J. M.: Temporal trends in nitrogen isotope values of nitrate leaching from agricultural soil, Chemical Geology,
10
146, 219–227, 1998.
Phillips, D. L. and Koch, P. L.: Incorporating concentration dependence in stable isotope mixing models, Oecologia, 130, 114–125, 2002.
Sebilo, M., Billen, G., Grably, M., and Marotti, A.: Isotopic composition of nitrate-nitrogen as a marker of riparian and benthic denitrification at the scale of the whole Seine River system,
15
Biogeochemistry, 63, 35–51, 2003.
Seitzinger, S., Styles, R. V., Boyer, E. W., Alexander, R. B., Billen, G., Howarth, R. W., Mayer, B., and Breemen, N. V.: Nitrogen retention in rivers: model development and application to watersheds in the northeastern U.S.A., Biogeochemistry, 57/58, 199–237, 2002.
Sigman, D. M., Altabet, M. A., Michener, R., McCorkle, D. C., Fry, B., and Holmes, R. M.:
Natu-20
ral abundance-level measurement of the nitrogen isotopic composition of oceanic nitrate: an adaptation of the ammonia diffusion method, Mar. Chem., 57, 227–242, 1997.
Silva, S. R., Kendall, C., Wilkison, D. H., Ziegler, A. C., Chang, C. C. Y., and Avanzino, R. J.: A new method for collection of nitrate from fresh water and analysis of nitrogen and oxygen isotope ratios, J. Hydrol., 228, 22–36, 2000.
25
Stalnacke, P., Grimvall, A., Sundblad, K., and Tonderzki, A.: Estimation of riverine loads of nitrogen and phosphorous to the Baltic Sea, 1970–1993, Environmental and Monitoring As-sessment, 58, 173–200, 1999.
UNESCO: Chemical methods for the use in marine environmental monitoring, Manual and guides, Intergovernmental Oceanographic Comission, 12, 1–53, 1983.
30
Voss, M., Emeis, K.-C., Hille, S., Neumann, T., and Dippner, J. W.: The nitrogen cy-cle of the Baltic Sea from an isotopic perspective, Global Biochem. Cycy-cles, 19, 1–16, doi:10.1029/2004GB002338, 2005.
BGD
3, 475–511, 2006 Source identification of riverine nitrate M. Voss et al. Title Page Abstract Introduction Conclusions References Tables Figures J I J I Back CloseFull Screen / Esc
Printer-friendly Version
Interactive Discussion
EGU World Meteorological Organization: Guide to Hydrological Practices, WMO-No 168, World
BGD
3, 475–511, 2006 Source identification of riverine nitrate M. Voss et al. Title Page Abstract Introduction Conclusions References Tables Figures J I J I Back CloseFull Screen / Esc
Printer-friendly Version
Interactive Discussion
EGU
Table 1. Variables measured during the two years of sampling, and used in the PCA analysis.
n.a.= not available.
variable Peene Oder Vistula Neva Paimionjoki Kokemaenjoki Kemijoki
NO−3 52 47 48 15* 38* 23* 24*
NO−2 52 47 48 n.a. n.a. n.a. n.a.
NH+4 52 47 46 15 30 22 24
Ntot 43 46 48 15 33 22 25
PO3−4 52 46 48 15 31 23 25
Ptot 43 46 48 15 38 22 25
DSi 4 47 48 n.a. n.a. 7 25
PON 30 47 48 10 19 22 21 POC 9 47 48 10 19 22 21 δ15N-PON 26 47 47 15 21 22 21 δ13C-POC 9 46 47 15 21 22 21 δ15N –NO−3 * 26 47 48 15 24 23 19 δ18O –NO−3 21 42 44 9 23 20 14 δ13C-DIC 27 43 43 11 10 6 13 flow rate 25 24 24 14 25 25 25
BGD
3, 475–511, 2006 Source identification of riverine nitrate M. Voss et al. Title Page Abstract Introduction Conclusions References Tables Figures J I J I Back CloseFull Screen / Esc
Printer-friendly Version
Interactive Discussion
EGU
Table 2. Characteristic end member isotope values used in calculations with the isotope mixing
models. Values for nitrate from atmospheric deposition in the Kemijoki catchments given in brackets.
Isotope Mixing Model – 1
NO−3 from NO−3 from p NO−3 from
agricultural land ristine soils atmosph. deposition
δ15N (‰) 11.4(1) 0.6(1) 0.1(1)(-0.2(2))
δ18O (‰) 5.3(1) 1.4(1) 51.7(1)(53.1(2))
Isotope Mixing Model – 2
NO−3 from NO−3 from NO−3 from
mineral fertilzer sewage/manure atmosph. deposition
δ15N (‰) 0.0(3) 10.0(4) 0.1(1)(-0.2(2))
δ18O (‰) 23.0(3) 3.5(4) 51.7(1)(53.1(2))
(1
Deutsch et al. (2006) (2
Burns and Kendall (2002) (3
Amberger and Schmidt (1987) (4
BGD
3, 475–511, 2006 Source identification of riverine nitrate M. Voss et al. Title Page Abstract Introduction Conclusions References Tables Figures J I J I Back CloseFull Screen / Esc
Printer-friendly Version
Interactive Discussion
EGU
Table 3. Summary characteristics of the twelve rivers and their catchments, n.a.= not
avail-able, Lule-, Kalix-, Torne-, Dal- and ˚Angerman ¨alven are Swedish rivers, Kemi-, Kokem ¨aen- and Paimionjoki are Finnish, Neva Russian, Vistula is Polish, Oder is Polish/German and Peene is German. The loads are calculated from the monthly discharge multiplied with the monthly mean concentration.
load weighted data
Rivers catchments Pop. forests agricult. Runoff DIN DIP δ15N-NO−3/ δ18O-NO−3 DIN/DIP Atm.dep.
area Density and NO−2 (kg N
(km2) (km−2) (%) artif. (%) (×106m3yr−1) (µmol l−1) (µmol l−1) (‰) (‰) (ton) km−2yr−1)
Lule ¨alv 24 934 1 62.43 1.02 16 745 3.20 0.08 2.5* n.a. 18.44 164.61
Kalix ¨alv 17 674 2 72.14 1.36 9951 5.90 0.12 2.6* n.a. 22.03 187.79
Torne ¨alv 39 613 2 73.21 1.32 13 481 3.66 0.14 2.8* n.a. 12.15 155.52
Dal ¨alven 28 873 9 86.12 5.44 11 911 10.48 0.10 3.1* n.a. 48.56 526.82
˚
Angerman ¨alven 31 421 2 85.40 2.78 16 910 4.34 0.07 2.3* n.a. 29.07 255.31
Vistula 192 899 121 33.16 65.54 33,637 174.29 3.79 7.3 12.3 20.76 1117.43
Oder 117 589 138 32.61 66.06 16 872 216.45 4.40 8.3 13.4 22.22 1694.47
Peene 4944 61 17.00 81.00 582 n.a. n.a. 7.1 13.0 58.76 n.a.
Paimionjoki 1145 19 56.49 42.14 278 141.91 4.42 6.7 13.3 14.49 692.35
Kokenm ¨aenjoki 26 667 30 78.66 10.85 8078 50.05 0.85 5.5 15.5 26.74 590.81
Kemijoki 50 918 2 83.63 3.30 18 542 5.68 0.23 −0.1 19.5 11.01 207.24
Neva 285 835 23 67.70 15.12 79 665 23.56 0.29 2.4 20.9 36.25 442.75
BGD
3, 475–511, 2006 Source identification of riverine nitrate M. Voss et al. Title Page Abstract Introduction Conclusions References Tables Figures J I J I Back CloseFull Screen / Esc
Printer-friendly Version
Interactive Discussion
EGU
Table 4. Proportion of nitrate from different sources, calculated using two isotope mixing
mod-els (IMM-1 and IMM-2), an emission model (EM), and land use data from the Global Land Cover data base (GLC). For further explanation see text. n.a.= not available.
IMM-1 results IMM-2 results Emission model (EM) reults Land use in catchment, from GLC
% N from agri- cul-tural runoff % N from pris-tine soils % N from Atm. Dep. % N from sewage and ma-nure % N from min-eral fertil-izer % N from Atm. Dep. % N from sewage and ma-nure % N from min-eral fertil-izer (%) % N from Atm. Dep. Agricult. and artif. (%) Forests (%) wetland, bare, water (%) Vistula 0.63 0.20 0.17 0.73 0.14 0.12 0.32 0.49 0.19 0.66 0.33 0.01 Oder 0.73 0.09 0.18 0.80 0.00 0.20 0.33 0.45 0.22 0.66 0.33 0.01
Peene 0.61 0.20 0.19 0.71 0.15 0.14 n.a. n.a. n.a. 0.81 0.17 0.02
Paimionjoki 0.58 0.23 0.19 0.67 0.21 0.12 0.11 0.29 0.60 0.42 0.56 0.01
Kokenm ¨aenjoki 0.47 0.29 0.24 0.55 0.33 0.11 0.19 0.45 0.36 0.11 0.79 0.10
Kemijoki 0.00 0.67 0.33 0.00 1.00 0.00 0.02 0.00 0.98 0.03 0.84 0.13
BGD
3, 475–511, 2006 Source identification of riverine nitrate M. Voss et al. Title Page Abstract Introduction Conclusions References Tables Figures J I J I Back CloseFull Screen / Esc
Printer-friendly Version Interactive Discussion EGU
30
1 Peene 2 Oder 3 Vistula 4 Neva 5 Paimionjoki 6 Kokemaenjoki 7 Kemijoki 8 Torne Älven 9 Kalix Älven 10 Lule Älv 11 Angermanälven 12 DalälvenFigure 1
Fig. 1. The Baltic Sea and its catchments, with investigated rivers in black and numbered 1 to
12.
BGD
3, 475–511, 2006 Source identification of riverine nitrate M. Voss et al. Title Page Abstract Introduction Conclusions References Tables Figures J I J I Back CloseFull Screen / Esc
Printer-friendly Version Interactive Discussion EGU 31 0.0E+000 2.0E+009 4.0E+009 6.0E+009 8.0E+009 fl o w ( m ³/ m o n th ) Vistula 0 100 200 300 N O3 ( µ M o l) 0 40 80 120 160 200 D IN /P O4 4 6 8 10 12 δ 1 5N -N O3 ( ‰ ) 8 12 16 20 24 28 δ 1 8O -N O3 ( ‰ ) 0 20 40 60 80 P O N ( µ M o l) J u ly A u g u s t S e p te m b e r O c to b e r N o v e m b e r D e c e m b e r J a n u a ry F e b ru a ry M a rc h A p ri l M a y J u n e J u ly A u g u s t S e p te m b e r O c to b e r N o v e m b e r D e c e m b e r J a n u a ry F e b ru a ry M a rc h A p ri l M a y Ju n e J u ly 0 4 8 12 16 δ 1 5N -P O N ( ‰ ) 2000 2001 2002 Figure 2
Fig. 2. The two annual cycles for the Vistula River, July 2000 to June 2002. Water flow as
monthly means, nutrient data as monthly means, based on biweekly sampling, with concentra-tions flow-weighted and isotope values load-weighted.
BGD
3, 475–511, 2006 Source identification of riverine nitrate M. Voss et al. Title Page Abstract Introduction Conclusions References Tables Figures J I J I Back CloseFull Screen / Esc
Printer-friendly Version Interactive Discussion EGU 32 0.0E+000 2.0E+009 4.0E+009 6.0E+009 8.0E+009 fl o w ( m ³/ m o n th ) Oder 0 100 200 300 400 N O3 ( µ M o l) 0 100 200 300 400 D IN /P O4 6 8 10 12 14 16 δ 1 5N -N O 3 ( ‰ ) 8 12 16 20 24 28 δ 1 8O -N O3 ( ‰ ) 0 40 80 120 P O N ( µ M o l) J u ly A u g u s t S e p te m b e r O c to b e r N o v e m b e r D e c e m b e r J a n u a ry F e b ru a ry M a rc h A p ri l M a y J u n e J u ly A u g u s t S e p te m b e r O c to b e r N o v e m b e r D e c e m b e r J a n u a ry F e b ru a ry M a rc h A p ri l M a y Ju n e J u ly 4 6 8 10 12 δ 1 5N -P O N ( ‰ ) 2000 2001 2002 Figure 3
Fig. 3. The two annual cycles for the Oder River from July 2000 to June 2002. Water flow as
monthly means, nutrient data as monthly means, based on biweekly sampling, with concentra-tions flow-weighted and isotope values load-weighted.
BGD
3, 475–511, 2006 Source identification of riverine nitrate M. Voss et al. Title Page Abstract Introduction Conclusions References Tables Figures J I J I Back CloseFull Screen / Esc
Printer-friendly Version Interactive Discussion EGU 0.0E+000 2.0E+009 4.0E+009 6.0E+009 8.0E+009 fl o w ( m ³/ m o n th ) Kemijoki 0 4 8 12 N O3 ( µ M o l) 0 20 40 60 D IN /P O4 -2 -1 0 1 2 δ 1 5N -N O3 ( ‰ ) 8 12 16 20 24 28 δ 1 8O -N O3 ( ‰ ) 0 4 8 12 P O N ( µ M o l) J u ly A u g u s t S e p te m b e r O c to b e r N o v e m b e r D e c e m b e r J a n u a ry F e b ru a ry M a rc h A p ri l M a y J u n e J u ly A u g u s t S e p te m b e r O c to b e r N o v e m b e r D e c e m b e r J a n u a ry F e b ru a ry M a rc h A p ri l M a y J u n e J u ly -2 0 2 4 6 8 δ 1 5N -P O N ( ‰ ) 2000 2001 2002 Figure 4
Fig. 4. The two annual cycles for the Kemijoki from July 2000 to June 2002. Water flow as
monthly means, nutrient data as monthly means, based on monthly sampling, with concentra-tions flow-weighted and isotope values load-weighted.
BGD
3, 475–511, 2006 Source identification of riverine nitrate M. Voss et al. Title Page Abstract Introduction Conclusions References Tables Figures J I J I Back CloseFull Screen / Esc
Printer-friendly Version Interactive Discussion EGU (a) 34 4 8 12 16 δ 1 5N -N O3 ( ‰ ) 4 6 8 10 δ 1 5N -N O3 ( ‰ ) KO VI 4 8 12 16 δ 1 5N -N O3 ( ‰ ) OD J u ly A u g u s t S e p te m b e r O ct o b e r N o v e m b e r D e c e m b e r J a n u a ry F e b ru a ry M a rc h A p ri l M a y J u n e J u ly A u g u s t S e p te m b e r O c to b e r N o v e m b e r D e c e m b e r J a n u a ry F e b ru a ry M a rc h A p ri l M a y J u n e J u ly -2 0 2 4 6 δ 1 5N -N O3 ( ‰ ) NEV 4 6 8 10 δ 1 5N -N O3 ( ‰ ) PA 4 8 12 16 δ 1 5N -N O3 ( ‰ ) PE -2 0 2 4 6 δ 1 5N -N O3 ( ‰ ) KE 2000 2001 2002 Fig. 5 A 8 12 16 20 24 28 δ 1 8O -N O3 ( ‰ ) 8 12 16 20 24 28 δ 1 8O -N O3 ( ‰ ) KO VI 8 12 16 20 24 28 δ 1 8O -N O3 ( ‰ ) OD J u ly A u g u s t S e p te m b e r O ct o b e r N o v e m b e r D e c e m b e r J a n u a ry F e b ru a ry M a rc h A p ri l M a y J u n e J u ly A u g u s t S e p te m b e r O c to b e r N o v e m b e r D e c e m b e r J a n u a ry F e b ru a ry M a rc h A p ri l M a y J u n e J u ly 8 12 16 20 24 28 δ 1 8O -N O3 ( ‰ ) NEV 8 12 16 20 24 28 δ 1 8O -N O3 ( ‰ ) PA 8 12 16 20 24 28 δ 1 8O -N O3 ( ‰ ) PE 8 12 16 20 24 28 δ 1 8O -N O3 ( ‰ ) KE 2000 2001 2002 Fig. 5 B (b) 34 4 8 12 16 δ 1 5N -N O3 ( ‰ ) 4 6 8 10 δ 1 5N -N O3 ( ‰ ) KO VI 4 8 12 16 δ 1 5N -N O3 ( ‰ ) OD J u ly A u g u s t S e p te m b e r O ct o b e r N o v e m b e r D e c e m b e r J a n u a ry F e b ru a ry M a rc h A p ri l M a y J u n e J u ly A u g u s t S e p te m b e r O c to b e r N o v e m b e r D e c e m b e r J a n u a ry F e b ru a ry M a rc h A p ri l M a y J u n e J u ly -2 0 2 4 6 δ 1 5N -N O3 ( ‰ ) NEV 4 6 8 10 δ 1 5N -N O3 ( ‰ ) PA 4 8 12 16 δ 1 5N -N O3 ( ‰ ) PE -2 0 2 4 6 δ 1 5N -N O3 ( ‰ ) KE 2000 2001 2002 Fig. 5 A 8 12 16 20 24 28 δ 1 8O -N O3 ( ‰ ) 8 12 16 20 24 28 δ 1 8O -N O3 ( ‰ ) KO VI 8 12 16 20 24 28 δ 1 8O -N O3 ( ‰ ) OD J u ly A u g u s t S e p te m b e r O ct o b e r N o v e m b e r D e c e m b e r J a n u a ry F e b ru a ry M a rc h A p ri l M a y J u n e J u ly A u g u s t S e p te m b e r O c to b e r N o v e m b e r D e c e m b e r J a n u a ry F e b ru a ry M a rc h A p ri l M a y J u n e J u ly 8 12 16 20 24 28 δ 1 8O -N O3 ( ‰ ) NEV 8 12 16 20 24 28 δ 1 8O -N O3 ( ‰ ) PA 8 12 16 20 24 28 δ 1 8O -N O3 ( ‰ ) PE 8 12 16 20 24 28 δ 1 8O -N O3 ( ‰ ) KE 2000 2001 2002 Fig. 5 B
Fig. 5. (a) load weighted monthly δ15N-NO−3 values from all except the Swedish rivers (b)
load weighted monthly δ18O-NO−3 values from all rivers except the Swedish rivers. VI=Vistula, OD=Oder, PE=Peene, PA=Paimoinjoki, KO=Kokemaenjoki, KE=Kemijoki, NEV=Neva.