CALTECH/MIT
VOTING TECHNOLOGY PROJECT
A multi-disciplinary, collaborative project of
the California Institute of Technology – Pasadena, California 91125 and
the Massachusetts Institute of Technology – Cambridge, Massachusetts 02139
TITLE
Detecting Voter Fraud in an Electronic Voting Context
An Analysis of the Unlimited Reelection Vote in
Venezuela
Name
Ines Levin
University Caltech
Name
Gabe Cohen
University Caltech
Name
Peter Ordeshook
University Caltech
Name
Michael Alvarez
University Caltech
Key words:
VTP WORKING PAPER #83
Detecting Voter Fraud in an Electronic Voting Context:
An Analysis of the Unlimited Reelection Vote in Venezuela
In´es Levin
∗Gabe A. Cohn
†Peter C. Ordeshook
‡R. Michael Alvarez
‡June 23, 2009
Abstract
Between December 2007 and February 2009, Venezue-lans participated twice in constitutional referenda where the elimination of presidential term limits was one of the most salient proposals. Assuming voter preferences did not change significantly during that period, the ‘re-peated’ character of these elections provide us with an ex-cellent opportunity to apply forensic tools designed to de-tect anomalies and outliers in election returns in elections where electronic voting technologies were used. Similar tools were first applied by Myagkov et al. ([20], [21], [22], [23]) to the study of electoral fraud in Russia and Ukraine, and were effective in the isolation of potential cases of manipulation of electoral returns. The case of Venezuela is different because there exists no widespread agreement about the integrity or otherwise fraudulent na-ture of national elections, and because it is a nation where electronic voting technologies are used. Unless electoral fraud takes place in exactly the same manner in each elec-tion, an analysis of the ‘flow of votes’ between elections can be used to detect suspicious patterns in electoral re-turns. Although we do not find evidence of pervasive elec-toral fraud compared, for instance, to the Russian case, our analysis is useful to detect polling places or regions deviating considerably from the more general pattern.
1
Introduction
Having an electoral process with a high degree of integrity is important for the maintenance of a well-functioning representative democracy. All stakeholders must believe that an election was free from fraud and malfeasance in or-der for the regime that takes power after a contested elec-tion to have legitimacy. Elecelec-tions that lack integrity often
∗Graduate student, Division of Humanities and Social Sciences,
Cal-ifornia Institute of Technology, Pasadena, CA 91125, MC 228-77; cor-responding author. E-mail:[email protected]. Tel:(626)395-4289
†Undergraduate student, Division of Engineering & Applied Science,
California Institute of Technology, Pasadena, CA 91125.
‡Professor of Political Science, Division of Humanities and Social
Sciences, California Institute of Technology, Pasadena, CA 91125.
lead to internal political conflict, and to external political pressures. An example of such an election occurred in 2004 in the Ukraine, where electoral fraud produced mas-sive protests as well as pressure by foreign governments, resulting in an eventual revote.
While examples of clear and widespread electoral fraud are relatively rare, concerns have arisen in recent years regarding the detection of fraud as new voting technolo-gies and procedure are tested and deployed. These elec-toral innovations often involve relatively untested tech-nologies and procedures, which sometimes appear to in-teract to produce potentially problematic outcomes. This may have been the case in Florida’s 13th Congressional district election in 2006, when a very high undervote rate was observed in parts of the district in Sarasota County, where electronic voting machines were used. While re-cent research focuses on how the voting machines dis-played the ballot for this race, considerable debate arose about whether there were problems with the electronic de-vices themselves (see Frisina, Herron, Honaker and Lewis [12]).
The need to assure the integrity of an electoral pro-cess has produced a variety of calls for better post-election analysis of election administration, sparking a number of new research efforts regarding official post-election
audit-ing procedures.1 Our research is closely related to these
efforts, as we study the issue of post-election statistical detection of election anomalies and outliers. Of course, the statistical analysis of election returns and other elec-tion statistics has a long history, with scholars attempting to identify statistically the systematic factors impacting outcomes. Only recently, though, have scholars begun to apply their substantive and methodological tools to look not for the systematic explanatory factors of voting and election outcomes, but also for outliers and anomalies not
accounted for by a classical statistical model.2
In this paper we discuss some of these new statistical tools for post-election forensics, with an application to
re-1See, for example, Aslam, Popa and Rivest [4] or Hall [14], and the
references therein.
2See Part Three of Alvarez, Hall and Hyde [2] for discussion of many
cent elections in Venezuela. We use the Venezuelan case for a number of reasons: Recent elections have been im-portant and concern widely-followed referenda on impor-tant constitutional and political issues; we want to apply these statistical tools to a nation where electronic voting is used; finally, while there have been studies of election fraud in a number of Latin American nations, the tech-niques we present here have not been applied to Latin American cases.
This essay proceeds as follows. In the next section we discuss briefly the research literature on election fraud, and the cross-cutting research literature on electronic vot-ing. We then turn to a discussion of the Venezuelan case, as well as a general presentation of post-election statistical forensic analyses. Thereafter we examine the results from recent Venezuelan elections, and conclude with a discus-sion of the merits of these post-election statistical forensic tools for fraud detection and routine auditing of election administration practices.
2
Election Fraud and Electronic
Voting
Despite the frequent use of the term “election fraud”, there is little guidance in the research literature about exactly what constitutes “election fraud.” For example, Alvarez, Hall and Hyde [2] note that notions of fraudulent elec-toral practices vary across time and political jurisdictions, and that behaviors that in one nation at a particular time are thought of as fraudulent may be perfectly legal and acceptable in other nations at other points in time. The United States Election Assistance Commission (USEAC) recently recognized this problem in a report on “election fraud”, noting that it has“learned that these terms mean many things to many different people” ([29], page 11); as a consequence, the USEAC used the term “election crimes” in their study instead of “election fraud.”
Regardless of how one defines “election fraud” across nations or time, there are clear cases where deliberate and illegal electoral manipulation have been observed. Latin America, our region of focus, has experienced allegations of election fraud in the past, and there has been substan-tial research on these allegations in some Latin Ameri-can cases. Two Latin AmeriAmeri-can nations in particular have been widely studied. One is Costa Rica, which was ex-amined closely by Lehoucq and Molina [17]. Looking across nearly fifty years of Costa Rican history (made pos-sible in part by that country’s longstanding democracy), they found that election fraud varied depending on po-litical competition, popo-litical institutions, and sociological trends. Another Latin American case that has seen sub-stantial research is Mexico, where during the PRI’s pe-riod of one-party rule, that party’s tactics included the
manipulation of voter registries, multiple voting, ballot box stuffing and other forms of voter intimidation (Law-son [18]). Others have studied the transition from PRI-dominance to competitive elections, with a focus on how political institutions like electoral courts can help mitigate the manipulation of elections (Eisenstadt [10]). Predomi-nantly, though, research on election fraud in Latin Amer-ica focuses on systems employing “traditional” technolo-gies, usually paper-based voting registration and ballot-ing systems. As the examples from Costa Rica and Mex-ico demonstrate, paper-based registration and ballot sys-tems are not fraud-proof, instead they have many different types of vulnerabilities that have been exploited in past elections.
Missing from the literature are studies of the poten-tial for election fraud that arise from the use of elec-tronic voter registration and balloting systems (e.g., Al-varez and Hall [1]). In the United States, a widespread movement toward the greater use of electronic voting fol-lowing the 2000 presidential election has proceed with fits and starts, and at this moment in time has stalled or even reversed itself (Alvarez and Hall [1]). Much of the de-bate about electronic voting systems in the United States concerns security and reliability; specifically, allegations that malicious tampering with the software and hardware is possible and difficult to detect (e.g., Kohno et al. [16]). These allegations have been the focus of substantial popu-lar press, and a growing body of research (State of Alaska Division of Elections [27],[28]; California Secretary of State [7]; Ohio Secretary of State [24]).
The electronic voting system currently used in Venezuela was first introduced for the 2004 presidential recall referendum, and has since been employed in five national elections — three constitutional referenda, one presidential election, and one parliamentary election. In addition, it is used in regional and municipal races. The touch-screen system is manufactured by Smartmatic, and is an example of an electronic voting device commonly known as a “direct-recording electronic” (DRE) voting machine. The Carter Center [8] issued an observation report of the 2006 presidential election that contains a great deal of technical discussion of the electronic vot-ing system used by Venezuela, and we draw heavily from that report as it provides one of the best English-language sources about the technical details of the voting system in Venezuela.
The Carter Center [8] analysis covers in detail many of the security features of the Smartmatic voting devices; in fact, they devote an entire section of their report to a dis-cussion of the security features of these voting systems. Some of those features include encryption of voting infor-mation, randomization of information to deter the recon-struction of the sequence of voting, disabling unnecessary physical access ports, chain-of-custody procedures, and
the security of the system’s paper receipts. Overall, the Carter Center report positively evaluated the voting sys-tem security, though it did recommend stronger physical security and chain-of-custody measures for future elec-tions. The report specifically concluded that “The sys-tem used in Venezuela needs to be secured (and audited) it its entirety” ([8], page 29). However, following the 2006 presidential election, the Carter Center report noted a number of issues associated with the audit and it’s pro-cedures ([8], pages 40-42).
Thus, the research reported in the sections that follow offers another set of post-election tools for election of-ficials, stakeholders, and other interested parties to use, and that thereby expands the more limited post-election audit procedures employed thus far in recent Venezuelan national elections. A post-election audit of only a small random sample of voting machines from polling stations may uncover some problems with the administration or technology used in an election; the post-election forensic tools we employ here are complementary to the random audit, as they can help discover other anomalies or prob-lems with the conduct of a particular election. The ad-vantage of our tools, on the other hand, is that they are designed to operate over the complete set of election re-turns.
3
Previous Research
The forensic tools applied here to detect election fraud using aggregate official election statistics were initially developed to study election fraud in post-Soviet states, notably Russia and Ukraine (Myagkov, Ordeshook and Shakin [21], [22], [23]). Briefly, those tools seek to dis-cover the anomalies in the data occasioned by explicit forms of fraud, such as ballot box stuffing and falsified election protocols that introduce specific types of hetero-geneity into the data. Indeed, the search for ‘artificially’ created heterogeneity both defines our methodology and establishes the prerequisites for its application.
We know that election returns from any national elec-tion exhibits their own natural forms of heterogeneity. Both turnout and a candidate or party’s support will, gen-erally and quite naturally, vary with demographic param-eters such as urbanization, income levels, ethnic compo-sition and even simply region. Our tools, then, seek to control for these parameters and then to look for other, potentially suspicious, sources. Of course, whether we deem these other sources suspicious depends on what we know about the election at hand. For instance, does the election involve a ‘favorite son’ who can be expected to wholly legitimately garner special support in some re-gions but not in others? Did the election concern an is-sue that had previously been unimportant — an isis-sue that
divided the electorate differently than before? Naturally, a concern with such things requires that in the search for suspicious heterogeneity, we must also look across elec-tions so that we can answer queselec-tions such as ‘Did a pat-tern suddenly emerge in the data that cannot be explained by demographic shifts?’
In contending with these substantive issues along with the various methodological issues associated with the treatment of aggregate data, Russia and Ukraine proved a useful laboratory for the development and testing of our forensic tools. Briefly, in Russia, Myagkov, Ordeshook and Shakin [23] had reasonably good priors as to where specifically election fraud was most likely to arise — no-tably in its ethnic republics, such as Tatarstan, Bahkor-tostan, Dagestan and Ingueshtia. Each region is controlled by political bosses (republic presidents) who generally win elections with numbers mimicking a Soviet past; both turnout and support for the incumbent in excess of ninety percent. In addition, it is not unusual to find subregions (rayons) in which the majority of precincts report 100 per-cent turnout with 100 perper-cent of the vote going to the re-gional or national incumbent or to the Kremlin sanctioned party. Data from these regions should readily signal fraud and should distinguish themselves from data from other regions.
Ukraine, in turn, offered Myagkov et al. [23] nearly the perfect social science experiment in 2004 from the
perspective of testing their forensic tools. Following
an inconclusive first round presidential ballot in Octo-ber, the November runoff pitted two candidates, Viktor Yushchenko and Viktor Yanukovich, with sharply differ-ing ideologies and bases of support. Yushchenko’s sup-port, with his pro-NATO and reformist agenda, came largely from Western Ukraine, whereas Yanukovich’s support cam from the more industrialized and largely pro-Russian East (along with Crimea). Yanukovich also re-ceived the strong support of the incumbent regime along with Russia’s Vladimir Putin.
The second November runoff election, however, was marred by massive and readily documented irregulari-ties — irregulariirregulari-ties of such an extent that, in addition to a massive uprising among the population termed ‘The Orange Revolution’ that saw upwards of a half million Ukrainians permanently camped out in protest in Kyiv’s central square, Ukraine’s Supreme Court invalidated the result and called for a new runoff in December. As a consequence of the Court’s decision and the self-evident nature of the fraud (along with, doubtlessly, behind the scenes diplomatic maneuvering), Yanukovich lost the en-dorsement of then president Kuchma (thereby signal-ing to regional political bosses that ‘special efforts’ on Yanukovich’s behalf were no longer necessary), and sev-eral thousand election observers from Ukraine’s diaspora (notably, from Canada and the United States) poured into
the country to monitor the re-runoff. Ukraine, then, pre-sented the authors with a situation in which they had two elections, one month apart, contested by the same two candidates, with the same issues, among the same elec-torate but with considerably fewer opportunities and in-centives for fraud in the second runoff. And since they had good priors as to where fraud was most blatant in the November runoff, they could test their indicators with the expectation that those indicators would signal fraud in one case but not in the other and that the measures they pro-vided of the magnitude of fraud should correspond to the estimates offered by a variety of objective observers and journalistic accounts. Suffice it to say, those indicators performed as designed and suggested the presence of be-tween 2 and 3 million ‘suspect’ votes in the November
2004 Ukrainian presidential runoff.3
4
The Case of Venezuela
We started the Venezuela analysis without strong priors about the types and location of potential election anoma-lies or potential fraud, or even expectations about whether there were problems in recent elections. The electoral context in this country is considerably different from that described in the Russian and Ukrainian cases. First, in the three most recent national elections, there are few polling places with 100 percent turnout where the official posi-tion, or any other alternative, wins close to 100 percent of the vote. Even in regions with strong support for the government, the opposition wins a ‘reasonable’ positive share of the vote. Second, international observers such as the European Union Election Observation Mission (EU-EOM) positively evaluated recent electoral processes. For example, in their report on the 2006 presidential contest, the EUEOM congratulated the National Elections Coun-cil (CNE), as well political actors and social movements, for “creating conditions to hold elections that are accept-able to all stakeholders” and argued that “the electronic voting system established in Venezuela is efficient, se-cure, and auditable” (EUEOM [11], page 2). Election ob-servers pointed to minor irregularities and suggested im-provements to the electoral system, but they did not raise serious allegations of electoral malfeasance. Although lo-cal organizations — such as SUMATE, as well as the op-position — made great efforts to monitor and report inci-dents of fraud, there exists no proof of widespread irreg-ularities in recent elections. The most notable case of an election where Chavez’s position won a disproportionate share of the vote is the 2005 parliamentary contest, where the Movimiento V Repblica (MVR) obtained 116 out of
3Similar tools were applied to the 2004 Russian presidential election,
2007 Russian parliamentary election, and 2007 Ukrainian election (see Myagkov et al. [22], [23]).
167 seats in Venezuela’s National Assembly. This lop-sided victory occurred, however, because the opposition boycotted the election, alleging there were not enough guarantees for a free and fair vote. Unsurprisingly, the opposition’s participation and vote share was small and overall turnout only reached 25.3 percent.
Some of the main opposition arguments about the non-democratic character of the government relate to the con-stitutionality of the articles included in the 2007 and 2009 constitutional referenda. The 2007 referendum consisted of, among other things, the removal of presidential term limits, abolishing the autonomy of the central bank, grant-ing the president control over international currency re-serves, expropriation of large land estates, and reducing the work day from eight to six hours. People opposed to Chavez’s ‘reforms’ argued this last provision was in-troduced merely as a sweetener to attract votes. In De-cember 2007, citizens voted on two bundles of constitu-tional changes, one of them (bundle A) containing all the reforms originally proposed by Chavez, including the un-limited reelection proposal. Paradoxically, it was the op-position boycott of the 2005 election that gave Chavez an overwhelming majority in the National Assembly and al-lowed Chavez to readily include his favored proposals in the 2007 referendum. Still, Chavez’s position lost by a small margin, which shows that the Venezuelan case dif-fers significantly from the Russian or Ukrainian cases pre-viously summarized.
After the 2007 defeat, Chavez accepted the outcome but publicly warned that this was just a temporary defeat — he said “no pudimos, por ahora”, meaning “for the mo-ment, we couldn’t” making allusion to the phrase he used when surrendering after the 1992 attempted coup d’tat. After the referendum, banners appeared throughout Cara-cas showing the phrase “por ahora” (“for the moment”). Moreover, while the constitution does not allow a sim-ilar constitutional reform to be put to a vote twice dur-ing the same National Assembly period, Chavez came up with a new proposal which excluded most of the 2007 re-forms, but still included the unlimited reelection proposal, together with the elimination of reelection terms for other public offices, and managed to get approval from the Con-stitutional Court for holding a new referendum in Febru-ary 2009. In this context, it is reasonable to wonder to which extent the integrity of the electoral process would be preserved in 2009.
The data about electoral returns we use here to address this issue comes from two sources. First, we downloaded the 2007 and 2009 referendum results from the CNE web-page using a Python script to store the data in a spread-sheet. Later, we found it convenient to compare the refer-endum outcomes with those from the 2006 presidential election. The data corresponding to this last race was downloaded from the ESDATA website, which contains
spreadsheets with official election results at the lowest
level of aggregation available.4 In addition, in different
sections of our analysis we classify polling places, or con-trol for socio-demographic differences, using census in-formation. This data was downloaded from the web page
of the National Statistics Institute (INE).5
5
Methodology
Briefly, our forensic indicators fall into three categories. The first looks for anomalies in the distribution of turnout and the relationship between turnout and a candidate or party’s reported share of the eligible electorate, the sec-ond looks for anomalies in the patterns of the numbers — the digits — employed in official protocols, and the last category applies various econometric techniques to esti-mate the flow of votes between elections.
With respect to the first category, suppose we in fact have a homogeneous data set (e.g., polling stations or precincts) in the sense that turnout varies within it for purely random reasons, for reasons having little if any-thing to do with demographic parameters or with those factors that impact a candidate or party’s level of support. In this case the overall distribution of turnout across the data should be approximately normally (and in particu-lar, unimodally) distributed, with some districts reporting high turnout, some reporting low turnout, but the over-whelming majority reporting turnout rates at or near the average. Now, however, suppose we introduce a specific form of heterogeneity into the data by literally stuffing the ballot boxes of a subset of precincts with votes for a specific candidate. The turnout distribution of that sub-set will be moved to the right so as to create an elongated tail for the overall distribution. And if we stuff enough ballots into those boxes, we can actually create an over-all bimodal distribution. Bimodal distributions of turnout, then, are one of the ‘red flags’ we can use when looking for fraudulently cast votes.
Next, suppose we look at the relationship between turnout and a candidate’s share of the eligible electorate. Again, if turnout is unrelated to a party’s relative support, that relationship (i.e., the slope of the line relating turnout, T, to share of the eligible electorate, V/E) should approx-imately equal the party’s overall share of the vote in our sample of the data. In other words, suppose turnout in-creases by 100 people. Then if turnout is unrelated to the party’s support relative to the opposition, that party should enjoy a share of those 100 additional voters equal
approx-4The ESDATA web site is http://www.esdata.info/venezuela. To
check the accuracy of the data available in this location, we compared their 2009 referendum database, with the one we constructed with the data downloaded from the CNE, and results were 100% consistent.
5The INE webpage is www.ine.gov.ve, and the section we
down-loaded the data from is called “S´ıntesis Estad´ıstica Estatal 2008.”
imately to its general share of the vote. Surely it should not gain more than 100 votes, nor should it experience any loss in votes. Thus, regression estimates of the relation-ship between V/E and T in homogeneous data should fall in the interval [0,1], so once again, regression estimates outside of this interval serve as another indicator of po-tentially fraudulently reported votes.
The second category of forensic indicators examines patterns in digits in official election returns (Berber and
Scacco [5], Shpilkin [26]).6 Suppose for example that
election protocols are filled out with little or no regard for ballots actually cast. And suppose, moreover, as is actually the case in places such as Russia, that there are few penalties for committing fraud, provided only that the fraud benefits the incumbent regime. In this case we can readily imagine a heuristic for filling out protocols — say, officially reported turnout — in which numbers are simply rounded off to 0 or 5. Looking at the distribution of last digits, then, can serve as an additional piece of forensic evidence. But suppose those who would commit fraud at-tempt to be more sophisticated and deliberately avoid the over-use of 0’s and 5’s. So consider instead the last two digits of official tabulations. It is an experimentally veri-fied fact that if we ask people to write sequences of ran-dom numbers, they will tend to write down paired num-bers (e.g., 2 2 or 3 3 or 7 7) less frequently than we would actually expect in a purely random sequence (Chapanis [9], Rath [25], Boland and Hutchinson [6]). A fourth ‘red flag’, then, is a distribution of last and next-to-last digits that departs significantly from what we would expect from a purely random process.
An additional forensic indicator entails estimating the ‘flow of votes’ from one election to the next. Here, of course, we are attempting to estimate where the votes of one party or candidate (or position on a referendum) went to in successive elections with the expectation that no party or candidate should win more than 100% of the vote of some earlier candidate or party. Needless to say, treating aggregate data so as to obtain estimates of this sort encounter any number of problems associated with ecological correlation. Nevertheless, a variety of econo-metric techniques have been developed for treating such issues, and their application constitutes our final forensic indicator. Specifically, we estimate Goodman regressions of the following form:
y1i= β11x1i+ β12x2i+ β13(1 − x1i− x2i) (1)
y2i= β21x1i+ β22x2i+ β23(1 − x1i− x2i) (2)
6There are other scholars who also study patterns in digits to detect
electoral fraud. For instance, Mebane [19] looks for deviations from the ‘second-digit Benford’s law’. In this paper, we follow a different approach, by searching for patterns of non-random behavior in the dis-tribution of the last-two digits.
y3i= β31x1i+ β32x2i+ β33(1 − x1i− x2i) (3)
where each yi represents a share of the eligible
elec-torate we want to explain - yes, no and abstention
pro-portions in the case of referenda, and the xi’s indicate the
proportions of people voting for the government’s favorite alternative, for the opposition’s favorite alternative, or ab-staining in a previous election. Each β coefficient repre-sents the proportion of a previous vote share that ‘flows’ to each alternative in the most recent election. Therefore, these coefficients should lie between 0 and 1. Further, as-suming no change in the electorate, any voter must either abstain, or vote for one of the available alternatives. Thus, coefficients lying in a similar column — i.e., those
associ-ated with the same xi, should add to one across the three
equations. If this holds, the nine β coefficients should add
to three, predicted yi’s should lie between zero and one,
and the sum of the predicted yi’s should add to one.
Still, since we do not use individual level data, aggre-gation bias may lead to estimated coefficients that are out of bounds. The usual solution applied in the literature has been to use an estimation method restricting coefficients to lie within ‘theoretically prescribed’ bounds (King [15]). Myagkov et al. [23], however, argue that electoral fraud may lead to negative or above-one coefficients even in the absence of aggregation issues, so restricting the co-efficients is not desirable because it does not allow us to detect cases of electoral fraud. Still, to correctly as-sess the cause of an out-of-bounds coefficient, we need to take steps to mitigate the ecological inference problem. Myagkov et al. [23] use a semi-parametric procedure, which consists of estimating the model within clusters of similar regions, and then constructing a weighted average of the coefficients to obtain the overall results. In this pa-per, we employ a method with a similar aim. Specifically, we estimate Goodman regressions with random effects, where coefficients are allowed to vary by region, or to
vary by levels of census variables.7 This procedure can
be thought of as the intermediate step between a complete pooling approach where the model is estimated at the na-tional level without random effects, and a no-pooling ap-proach where the model is estimated independently within each region.
Finally, an additional method we use to detect anoma-lies in electoral results follows a test done by Alvarez and Katz [3]. The authors first fit a model to the 1998 gov-ernor and senate election results in the state of Georgia, using the results of the 1996 presidential election as ex-planatory variables. Then, they use the estimated coef-ficients to predict the 2002 election results. In that way, they seek to detect if outcomes deviate significantly from expectations. In the case of Venezuela we first fit the yes share of the vote in the 2007 referendum, using the
pro-7Estimations were done by MLE, using the lme4 R package.
portions of the eligible electorate abstaining or support-ing Chavez and Rosales in the 2006 presidential election as explanatory variables — controlling for a small set of socio-demographic variables, and then use the estimated coefficients and 2007 electoral results to predict the yes share of the vote in the 2009 referendum. The idea is to check whether a subset of the polling places deviates con-siderably from our forecast.
Of course, if fraud occurs in both elections in precisely the same way and in the same localities, this method will not detect anomalies. This fact, though, merely serves to emphasize that our forensic indicators, taken together or separately, are precisely that — indicators. None of them, separately or together, can be said to ‘prove’ the existence or absence of fraud. Much as in a criminal in-vestigation, they merely provide evidence, out of which we, as analysts, most form a coherent view of an election — a view that is consistent with that evidence. There is no black box into which we plug official election returns and out of which comes a determination as to whether an election was or was not tainted by significant fraud. Our indicators provide us with alternative ways of looking at official election returns and must, necessarily, be com-bined with some substantive expertise about the society and election at hand. Only the substantive expert can an-swer such questions as: Were adequate controls in place for heterogeneity in the population; are there alternative explanations for why, for instance, increases in turnout benefited only one candidate or party; did fraud take more subtle forms so as to be undetectable by our indicators; did issues arise in one election but not in others that give that election a distinctly different character; or did one candidate or another enjoy administrative advantages that occasion suspicious patterns in the data but that cannot be classified as illegal fraud? Only after these questions are asked and answered can we begin drawing definitive conclusions from our forensic indicators.
6
Results
Most of the analysis done for individual elections was done using ‘mesa’ (table) level data. However, since the number of tables changes within one same polling place from election to election, the cross-election analysis was done comparing polling-place level results. Specifically, we used polling place IDs — constant across elections, to exactly match 8,815 polling places which were open dur-ing the three elections of interest. The average number of voters and eligible voters per polling place in 2009 was 1,230 and 1,744, respectively.
It was very important for our analysis to count with 2007 turnout figures. Still, this information is not avail-able at the CNE’s web site. To solve this issue, we
esti-mated polling place level registration numbers for Decem-ber 2007 by interpolating between the DecemDecem-ber 2006 and February 2009 official registration figures for each polling place. Turnout rates were computed by taking the total number of votes — including both valid and invalid votes, as a percentage of the total number of registered voters. According to the news reports, turnout in the 2007 constitutional referendum was approximately 56 percent. Based on our own estimations, turnout in that election sit-uated at 58 percent — with average and median figures of 57 percent and 59 percent, respectively. These figures are substantively smaller than the 75 percent and 70 percent officially reported for the 2006 presidential and 2009 con-stitutional referendums, respectively — or 74 percent and 69 percent in our sample of matched polling places. Fig-ure 1 compares the distribution of turnout across the three elections. It shows that turnout was largest and had a rela-tively low variance in 2006, then it decreased considerably in 2007, and finally increased in 2009. The only slight anomaly we observed in this completely pooled data is some thickness in the right tail of the 2006 turnout distri-bution.
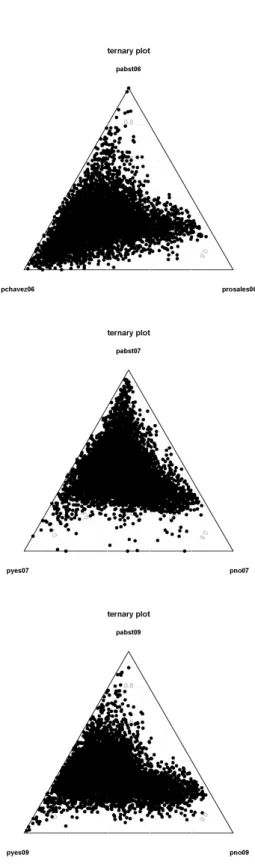
Figure 1: Distribution of Turnout in Recent Elections The official result of the 2006 presidential election was a 64.8 percent Chavez victory, relative to the total num-ber of valid votes. If instead we consider the proportion of the eligible electorate, Chavez vote share was equal to 45.6 percent. Then, in the 2007 referendum, the no option won the election corresponding to both bundles of con-stitutional articles. Specifically, the no vote share stood at 50.7 percent in the case of bundle A. If we consider the proportion of the eligible electorate, the vote share re-ceived by the no option — in bundle A, was equal to 29.7 percent. Last, the yes option won the 2009 referendum with a 54.9 percent share of the vote — or 37.4 percent in terms of the eligible electorate. Figure 2 shows the results of the 2006 presidential election, and the 2007 and 2009
constitutional referendums, using ternary plots. The upper vertices correspond to abstention, the lower left vertices correspond to the alternative supported by the Chavismo, and the lower right vertices correspond to the alternative supported by the opposition. Any point within these tri-angles indicates an election outcome — where the pro-portions associated with the different alternatives add to 1. To interpret these figures, notice that standing at any vertex, lines parallel to the opposite side represent similar vote shares associated with the vertex’s label. Also, vote shares decrease linearly as we move away from the vertex. Since the centers of the triangles are equidistant from all extremes, they represent a situation with the exact same
proportion of votes for each alternative.8 These figures
show that while the 2009 distribution of outcomes is very similar in shape to the one observed in the 2006 presiden-tial election, the 2007 constitutional referendum outcome looks like a special case of relatively low turnout.
Figure 3 shows the distribution of turnout by state. In general, state-level distributions follow the national pat-tern observed in Figure 1. The most noticeable deviations from the normal distribution occur in the 2006 presiden-tial election — consistent with the thick right tail observed in the distribution of national turnout, with some states exhibiting relatively large second modes to the right — in particular, this happens in Cojedes and Vargas. This last state shows slightly multimodal distributions in all three elections. Then, in 2007, there is a set of states whose turnout distribution does not look normal, but slightly skewed and with thick tails — we refer to Bolivar, Delta
Amacuro, Guarico and Zulia. Finally, in the case of
the 2009 referendum, most densities look unimodal and tightly clustered around some point, and are not skewed to any side — although Barinas and Ta´chira exhibit small hills to the left, and Vargas to the right.
As mentioned in the previous section, both alternatives should benefit partially from an increase in turnout — or, at least, none should get hurt. A failure of this hypoth-esis raises a ‘red flag’ about artificially inflated turnout favoring one of the alternatives. To test it we plot the re-lationship between turnout and the shares of the vote for each alternative, by state, for sufficiently similar polling places. The criteria for constructing subsets of similar polling places by state, were splitting the data in two, de-pending on whether the yes option won the previous elec-tion in that polling place (see Figure 4), or whether the opposite outcome took place (see Figure 5). In the case of those regions where the yes won in 2007, we observe slightly negative slopes in the no shares in the states of Cojedes and Delta Amacuro. Also, in those regions where
8Actually, the abstention percentage represented in the ternary plots
includes both actual abstention as well as invalid vote. In the case of the 2006 presidential election and 2009 constitutional referendum, invalid votes stood at 1.0% and 1.2%, respectively.
Figure 2: Recent Election Outcomes
the no won in 2007, we observe negative yes slopes in sev-eral states — Bolivar, Carabobo, Cojedes, Lara, Merida, Portuguesa, Trujillo and Yaracuy. The most extreme cases are Carabobo and Cojedes, where the yes share falls con-siderably as turnout increases. In general, observed fig-ures for the 2009 election are mostly consistent with our hypothesis. A similar analysis of the 2007 election results is also consistent with the hypothesis that both shares of the eligible electorate benefit partially from an increase in turnout. However, we do observe deviations from our expectation in some states, which warns about potential electoral fraud in some of the regions under considera-tion. Since our hypothesis rests on the assumption of ho-mogeneity across observations — i.e. observations which only differ in turnout, deviations may also be due to het-erogeneity not accounted for by our bivariate regressions and scatter plots.
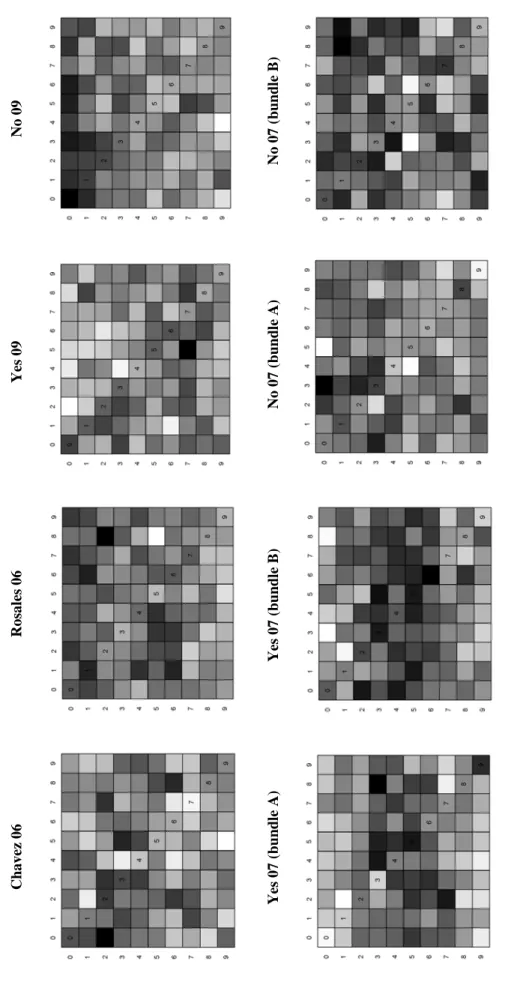
Next, we proceeded to analyze the patterns of digits of the ‘mesa’ (table) level electoral results. Figure 6 shows histograms with the density of the last digit for each alter-native in the three elections of interest — the 2006 presi-dential election, the 2007 constitutional referendum (bun-dle A), and the 2009 constitutional referendum. In addi-tion, we also include the density of the last digit corre-sponding to the outcomes of bundle B of the 2007 con-stitutional referendum. We do not observe any obvious non-random pattern — such as 0/5 rounding, or avoidance of zeros and fives. All last digits have approximately the same 10 percent incidence. Also, Figure 7 shows matrix plots of the density of the last two digits. Each cell corre-sponds to a combination of a next-to-last (row) digit, and a last (column) digit, with darker tones indicating larger incidence. If individuals unconsciously avoid paired num-bers such as 2 2, 3 3, and so on, then we should observe white diagonals. However, this pattern does not show up in any occasion — and neither does the opposite pattern where people focus on 2 2, 3 3, and so on. In general, none of the matrices shows an obvious non-random pattern in the distribution of last two digits. A shortcoming of this tool is that electronic fraud may be designed in such a way that manipulation of the last digits is completely random. If this were the case, this particular indicator would not be useful to detect fraud.
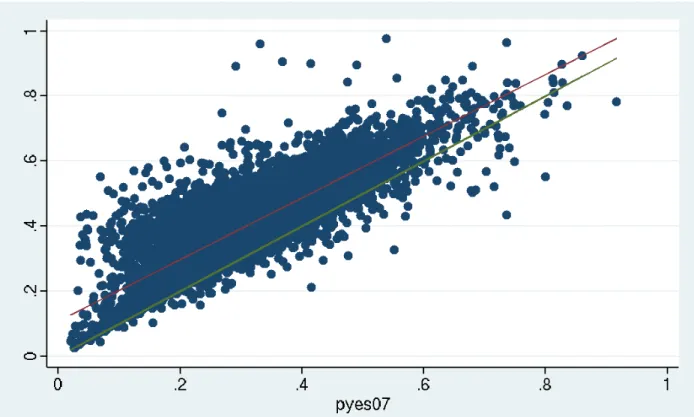
After that, we turn to the analysis of the flow of votes between different elections. Figure 8 shows the propor-tion of the yes vote in the eligible electorate in 2009, as a function of the same variable in 2007. We observe that the proportion of support for the yes increases in most polling places, especially where the yes vote was small in 2007. Even though most polling places are clustered around the regression line, some observations are far off. Since deviations may be due to the aggregations of results from dissimilar regions, we built Figure 9 showing com-parable graphs by state. Again, state-level results show
patterns similar to those observed at the national level, though outcomes are more tightly clustered around the fit-ted regression line. Some states, such as Aragua, Delta Amacuro, and Distrito Capital exhibit small clusters of polling places where the proportion of yes votes increased considerably in 2009 relative to most voting centers.
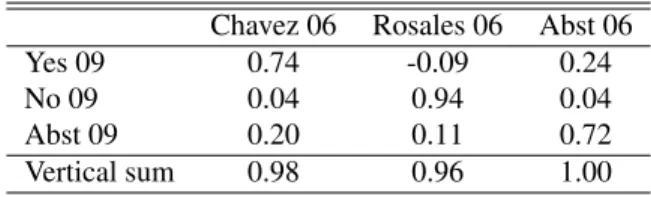
To further learn about the flow of votes between elec-tions, we estimated a set of Goodman equations similar to the one represented by equations (1) through (3). Ta-ble 1 shows the results with complete pooling, where each equation is estimated by OLS. The model fits the data well — with each equation explaining more than 95% of the variance in the dependent variable. Still, three of the co-efficients lie out of bounds. To mitigate the potential ag-gregation bias, we re-estimated similar equations specify-ing random coefficients by region. In total, we considered 366 regions — which in most states correspond to munic-ipalities, except for the Distrito Capital and Vargas, where our regions correspond to ‘parroquias.’ In this case, we still find that two of the average coefficients are negative, but closer to the [0,1] interval compared to the complete pooling approach. The main result following from this ta-ble is that voters who supported the yes option in 2007, overwhelmingly support the yes option in 2009 — this is not surprising because the 2007 reform proposal was even more radical than the 2009 reform proposal. Similarly, those voters who supported the no alternative in 2007, overwhelmingly choose the no alternative in 2009. None of these results is surprising.
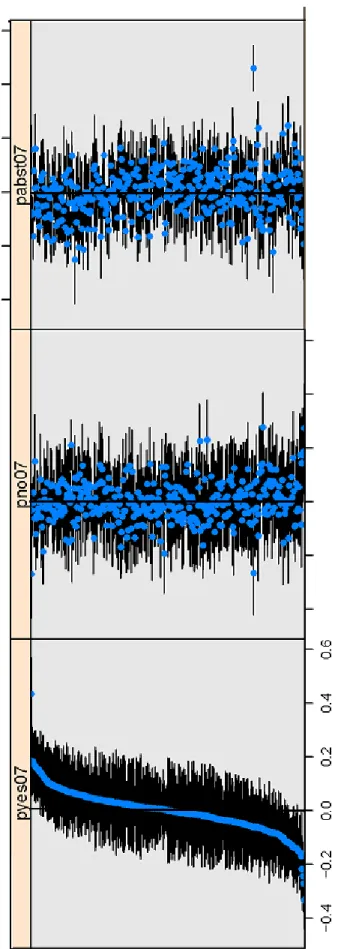
The most interesting result corresponds to the flow of votes of from those who abstained in 2007. Suppose all of the increase in turnout observed between both elections was artificial participation created by the government to inflate the yes results. Then, the coefficient in the up-per right corner should be relatively large. However, we observe a different pattern. Approximately 56 percent of those who abstained in 2007 continue to abstain in 2009. And among those who choose to participate, two thirds support the yes position, and one third support the no po-sition. Thus, even though the yes alternative was the main beneficiary of the increase in turnout, the no alternative also received a fairly large proportion of the new vote. Also, the random coefficients model is useful because it allows us to detect regions deviating significantly from av-erage estimates. Figure 10 shows that the random effects associated with some of the regions were significantly dif-ferent from the average effects. For instance, in the Ped-ernales municipality of Delta Amacuro, the proportion of the 2007 yes share received by the yes alternative in 2009 is equal to 146 percent, very out of bounds, and way above the estimates from any of the remaining regions. Also, in the case of Acevedo municipality in the state of Mi-randa, the proportion of the 2007 no vote share received by the no alternative is equal to 111%, an out-of-bounds
and relatively large estimate in comparison to other re-gions. Table 3 shows the results of a similar estimation with non-nested random effects by average age, gender and proportion of rural population, for the first equation. According to the deviance criterion — a measure of er-ror — the model with random coefficients by region fit-ted the data better than this second model. However, the non-nested alternative allows us to learn about the deter-minants of the effects. For instance, according to panel (c) in Figure 11, the proportion of the 2009 yes vote originat-ing from those abstainoriginat-ing or votoriginat-ing yes in 2007, decreases with the proportion of rural population, while the opposite happens with the proportion received from those voting no in 2007.
Table 1: Flow of Votes between 2007 and 2009 Complete pooling, OLS estimation
Yes 07 No 07 Abst 07
Yes 09 0.99 -0.09 0.27
No 09 -0.15 1.02 0.13
Abst 09 0.14 0.05 0.58
Vertical sum 0.98 0.98 0.98
Table 2: Flow of Votes between 2007 and 2009 Random effects by region, M.L.E.
Yes 07 No 07 Abst 07
Yes 09 0.97 -0.08 0.28
No 09 -0.11 0.94 0.14
Abst 09 0.13 0.10 0.56
Vertical sum 1.00 0.96 0.98
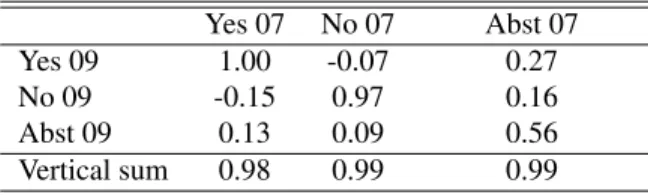
Table 3: Flow of Votes between 2007 and 2009 Random effects by demographic indicators, M.L.E.
Yes 07 No 07 Abst 07
Yes 09 1.00 -0.07 0.27
No 09 -0.15 0.97 0.16
Abst 09 0.13 0.09 0.56
Vertical sum 0.98 0.99 0.99
Table 4 shows the results of a Goodman regression analysis with random coefficients by region, to explain the flow of votes between the 2006 presidential election and the 2009 constitutional referendum. The main result is that a substantial proportion (20 percent) of those who voted for Chavez in 2006 abstained in the 2009 referen-dum. Also, 94 percent of those who voted for Rosales in 2006 choose the no alternative in the 2009 constitutional referendum, and 11 percent abstain. Second, 72 percent of those who abstained in 2006, abstain again in 2009, while the rest (20 percent), support the yes alternative. Table 5
shows the results of a similar analysis to explain the flow of votes between the 2006 and 2007 elections. In this case, we find that 36 percent of those who voted for Chavez in 2006, decide to abstain in 2007. Also, among those voting for Rosales in 2006, 87 percent vote no in 2007, while 19 percent abstain. Last, 77 percent of those who abstained in 2006, also do in 2007, while 16 percent support the yes alternative.
Table 4: Flow of Votes between 2006 and 2009 Random effects by region, M.L.E.
Chavez 06 Rosales 06 Abst 06
Yes 09 0.74 -0.09 0.24
No 09 0.04 0.94 0.04
Abst 09 0.20 0.11 0.72
Vertical sum 0.98 0.96 1.00
Table 5: Flow of Votes between 2006 and 2007 Random effects by region, M.L.E.
Chavez 06 Rosales 06 Abst 06
Yes 07 0.60 -0.08 0.16
No 07 0.03 0.87 0.08
Abst 07 0.36 0.19 0.77
Vertical sum 0.99 0.98 1.01
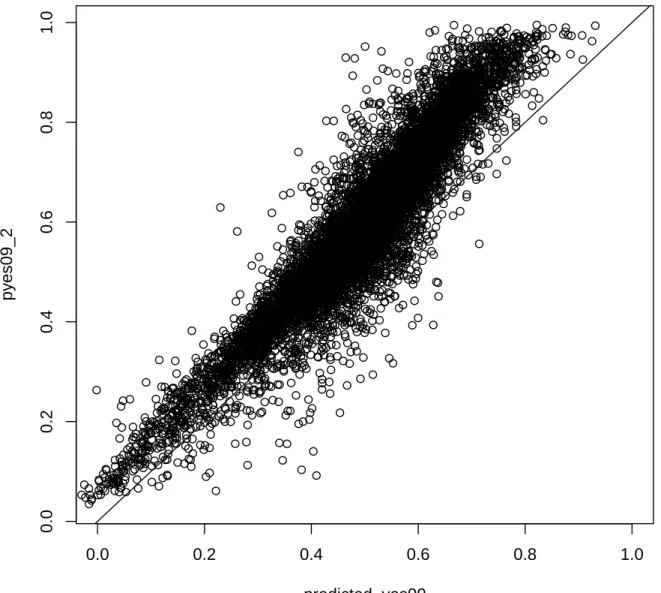
Our final indicator corresponds to a comparison of the observed yes vote share in 2009, with a forecast of the yes vote share for 2009. Predictions were computed using the estimated coefficients of a model first fitted to the 2007 election results — with predictors including the 2006 out-come, plus a set of socio-demographic control variables, which explained 98 percent of the variance in the 2007
yesvote share. Figure 13 shows the result of this
com-parison. Most of the polling places exhibit larger than expected vote shares, but we do not observe any group of polling places located away from the rest of the data — most points are clustered around a line with slope close to one and positive intercept. The model did worst among those polling places where the yes position was predicted to obtain between 60 percent and 80 percent of the vote — instead, many of those locations exhibited a yes vote share between 80 percent and 100 percent.
7
Conclusions
In this paper, we used a set of statistical tools to detect outliers and anomalies in election returns in two recent constitutional referendums in Venezuela where electronic voting technologies were used. Studying the integrity of these elections is challenging because manipulation of the software used for electronic voting could lead to types of
fraud difficult to detect with some of our forensic indica-tors. Still, the elimination of the presidential term lim-its stood out as one of the main proposals in both con-stitutional referendums. Assuming there were no consid-erable socio-demographic changes in the population be-tween both elections, it would be suspicious if the 2009 share received by the yes alternative changed dramatically in polling places where the same position lost the election in 2007. Even with a well designed electronic fraud, con-siderable changes between both elections may be detected with a careful analysis of the flow of votes.
Our main observation is that most of the new votes received by the yes position came from polling places with large abstention in 2007. Still, a third of those who abstained in the previous election participated and sup-ported the no position, implying that not all the increase in turnout was artificially created by the government to get the reform approved. Further, the new distribution of turnout, as well as the election outcome, was very simi-lar to that observed in the 2006 presidential election, sug-gesting the 2009 election was one where turnout recov-ered and people voted relatively similar to how they did in 2006. Of course, if fraud took place in 2006 and it was carried out in the same way as in 2009, then we would not be able to detect it using our flow of votes analysis. But this begs the question of why would the government replicate the same type of manipulation in 2009, and not in 2007? If they were capable of successfully conducting fraud in 2006, they could also have used it to approve the radical reforms proposed in 2007.
Even though we did not find evidence of widespread electoral fraud taking place in the last referendum, we did observe anomalies and outliers in different steps of our study. For instance, the state of Delta Amacuro showed both anomalies in the turnout distribution, as well as in the relationship between vote shares and turnout. Further, a municipality in the same state was prominent for hav-ing a very large and out of bounds coefficient associated with the share of the yes vote in 2007 ‘flowing’ to the
yesvote in 2009. However, this is no proof that electoral
fraud took place in Delta Amacuro. As we warned in the methodological section, our indicators do not constitute, by themselves, proof that electoral fraud did or did not take place in any particular region, or in the country as a whole. They should be interpreted by experts with knowl-edge about the characteristics and heterogeneities of the different areas, and employed as a complement to the in-formation arising from pre- and post-election audits, as well as reports from election observers.
References
[1] Alvarez, R.M. and T.E. Hall. 2008. Electronic elec-tions: the perils and promises of digital democracy. Princeton University Press.
[2] Alvarez, R.M., T.E. Hall, and S.D. Hyde, editors.
2008. Election Fraud: Detecting and Deterring
Electoral Manipulation. Washington, DC:
Brook-ings Institution Press, pages 149-61.
[3] Alvarez, R.M. and J.N. Katz. 2008. Detecting Elec-toral Fraud: The Case of 2002 General Election in
Georgia.In R.M. Alvarez, T.E. Hall and S.D. Hyde,
editors. Election Fraud: Detecting and Deterring
Electoral Manipulation.Washington, D.C.:
Brook-ings Institution Press, pages 162-81.
[4] Aslam, J.A., R.A. Popa and R. L. Rivest. 2008. On Auditing Elections When Precincts Have
Differ-ent Sizes.Proceedings, 2008 USENIX/ACCURATE
Electronic Voting Technology Workshop.
[5] Berber, B. and A. Scacco. 2008. What the numbers say: A digit based test for election fraud using new
data from Nigeria. Paper Presented at the Annual
Meeting of the APSA, Boston, Mass.
[6] Boland, P.J. and K. Hutchinson. 2000. Student
Selec-tion of Random Digits.Statistician 49(4): 519-29.
[7] California Secretary of State. 2007.
Top-to-Bottom Review. http://www.sos.ca.gov/
elections/elections_vsr.htm (June 22,
2009).
[8] Carter Center. 2007. Observing the 2006
Presiden-tial Elections in Venezuela.Final Report of the
Tech-nical Mission.
[9] Chapanis, A. 1953. Random-Number Guessing
Be-havior.American Psychologist 8:332.
[10] Eisenstadt, T.A. 2002. Measuring electoral court
failure in democratizing Mexico.International
polit-ical science review 23(1): 47-68.
[11] European Union Election Observation
Mis-sion. 2006. Final Report: Presidential Elections Venezuela 2006.
[12] Frisina, L, M.C. Herron, J Honaker, J.B. Lewis. 2008. Ballot formats, touchscreens, and Under-votes: A Study of the 2006 Midterm Elections in
Florida.Election Law Journal, 7(1): 25-47.
[13] Gelman, A., and J. Hill. 2007. Data Analysis Us-ing Regression and Multilevel/Hierarchical Models. New York: Cambridge University Press.
[14] Hall, J.L. 2008. Improving the Security,
Trans-parency, and Efficiency of California’s 1%
Manual Tally Procedures. Proceedings, 2008
USENIX/ACCURATE Electronic Voting Technol-ogy Workshop.
[15] King, G. 1997. A solution to the ecological inference
problem.Princeton University Press.
[16] Kohno, T. A. Stubblefield, A.D. Rubin and D.S. Wallach, 2004. Analysis of an electronic voting
sys-tem.IEEE Symposium on Security and Privacy.
[17] Lehoucq, F.E. and I. Molina Jimnez. 2002. Stuffing the ballot box: fraud, electoral reform, and
democ-ratization in Costa Rica. Cambridge: Cambridge
University Press.
[18] Lawson, J.C.H. 2000. Mexico’s Unfinished Transi-tion: Democratization and Authoritarian Enclaves. Mexican Studies/Estudios Mexicanos, 16 (2): 267-87.
[19] Mebane, W.R., Jr. 2008. Election Forensics: The Second-Digit Benfords Law Test and Recent
Amer-ican Presidential Elections. In R.M. Alvarez, T.E.
Hall and S.D. Hyde, editors, Election Fraud:
Detect-ing and DeterrDetect-ing Electoral Manipulation.
Wash-ington, D.C.: Brookings Institution Press, pages 162-81.
[20] Myagkov, M, P.C. Ordeshook and D. Shakin. 2005. Fraud or Fairytales: Russia and Ukraine’s Electoral
Experience.Post-Soviet Affairs, 21 (2):91-131.
[21] Myagkov, M, P.C. Ordeshook and D. Shakin. 2007. The Disappearance of Fraud: The Forensics
of Ukraine’s 2006 Parliamentary Elections.
Post-Soviet Affairs, 23(3): 218-39.
[22] Myagkov, M, P.C. Ordeshook and D. Shakin. 2008. On the Trail of Fraud: Estimating the Flow of Votes
between Russia’s Elections In R.M. Alvarez, T.E.
Hall and S.D. Hyde, editors. Election Fraud:
Detect-ing and DeterrDetect-ing Electoral Manipulation.
Wash-ington, D.C.: Brookings Institution Press, pages 182-200.
[23] Myagkov, M, P.C. Ordeshook and D. Shakin. 2009.
The Forensics of Election Fraud: Russia and
Ukraine.New York: Cambridge University Press.
[24] Ohio Secretary of State. 2007. EVEREST: Evalua-tion and ValidaEvalua-tion of ElecEvalua-tion-Related Equipment,
Standards and Testing. http://www.sos.
state.oh.us/SOS/upload/everest/ 14-AcademicFinalEVERESTReport.pdf (June 22, 2009).
[25] Rath, G.J. 1966. Randomization by Humans. Amer-ican Journal of Psychology 79(1): 97-103.
[26] Shpilkin, S. 2008. Analysis of Russian Elections as reported in TimesOnline, April 18. See also http: //freakonomics.blogs.nytimes.com/ 2008/04/16/russian-election-fraud/ (June 22, 2009).
[27] State of Alaska Division of Elections. 2007. State of Alaska Election Security Project Phase 1 Report. http://www.elections.alaska.gov/ Documents/SOA_Election_Security_ Project_Phase_1_Report_Final.pdf (June 22, 2009).
[28] State of Alaska Division of Elections. 2008. State of Alaska Election Security Project Phase 2 Report. http://www.elections.alaska.gov/ Documents/SOA_Election_Security_
Project_Phase_2_Report.pdf (June 22,
2009).
[29] United States Election Assistance
Commis-sion. 2006. Election Crimes: An Initial
Re-view and Recommendations for Future Study. http://www.eac.gov/program-areas/ research-resources-and-reports/ copy_of_docs/ reports-and-surveys-2006electioncrimes. pdf/attachment_download/file(June 22, 2009).
Appendices
Figure 3: Distrib ution of rurnout in recent elections. The blue, red and green densities correspond to turnout in the 2006 presi dential election, 2007 constitutional referendum and 2009 constitutional referendum, respecti v ely .
Figure 4: Relationship between turnout (horizontal axis) and v ote shares of eligible electorate (v ertical axis) in polling places with victory of the yes alternati v e in 2007. Blue dots indicate v ote shares for the yes option, and green dots indicate v ote shares for the no option. Lines correspond to fitted bi v ariate linear re gressions between turnout and v ote shares.
Figure 5: Relationship between turnout (horizontal axis ) and v ote shares of eligible electorate (v ertical axis) in polling places with victory of the no alternati v e in 2007. Blue dots indicate v ote shares for the yes option, and green dots indicate v ote shares for the no option. Lines correspond to fitted bi v ariate linear re gressions between turnout and v ote shares.
37
Figure 6: D
istributio
n of Last Digit
Ch avez 0 6 R o sal es 06 Yes 09 N o 09 Yes 07 (bun dle A) Yes 07 (bun dle B) No 0 7 (bu n d le A) N o 07 ( b un dl e B) Figure 6: Distrib ution of the last digit38
Figure 7: D
istribution
of Last Tw
o Digits
Note: In each figure, the ho
rizonta l dim ension c orres ponds to the la st
digit, and the ve
rtical dim ension corres ponds to the ne xt t o las t d ig it. Eac h cell rep rese nts the de ns ity of th e las t tw o d ig its, w ith da rke r to nes in dica ti ng lar ger in ci de nce. Ch avez 0 6 R o sal es 06 Yes 09 N o 09 Yes 07 (bun dle A) Yes 07 (bun dle B) No 0 7 (bu n d le A) N o 07 ( b un dl e B) Figure 7: Distrib ution of last tw o digits. In each figure, the horizontal dimension corresponds to the last digit, and the v ertical dimension corresponds to the ne xt to last digit. Each cell represents the density of the last tw o digits, with dark er tones indicating lar ger incidence.
Figure 8: Relationship between yes shares in 2009 and yes shares in 2007. The red line represents the fitted results of a linear regression between the proportion of yes votes in the 2007 constitutional referendum (bundle A), and the proportion of yes votes in the 2009 constitutional referendum. The green line represents a situation where the
Figure 9: Relationship between yes shares in 2009 and yes shares in 2007. The red line represents the fitted results of a linear re gression between the proportion of yes v otes in the 2007 constitutional referendum (b undle A), and the proportion of yes v otes in the 2009 constitutional referendum. The green line represents a situation where the proportion of yes v otes in both elections is the same (45 ◦ line).
41
Figure 10: Goodman Re
gression C
o
ef
fi
ci
ent
s by Muni
ci
palit
y
8(de
v
iations fr
om me
an)
8 In the case of the Ca pita l Distric t a nd Vargas sta te, re gions corres pond to “p arr oqu ia s”. Figure 10: Goodman re gression coef ficients by re gion (de viations from the mean), with dependent v ariable equal to the yes proportion of the eligible.
Figure 11: Goodman Regression Coefficients
(deviations from mean)
a-
Random coefficients by age quantiles
b-
Random coefficients by gender
9c-
Random coefficients by rurality quantiles
9
1 indicates more than 50% female.
Figure 11: Goodman regression coefficients by demographic differences (deviations from the mean), with dependent variable equal to the yes proportion of the eligible. In the second panel, ‘1’ indicates more than 50% female.