HAL Id: hal-01077475
https://hal.archives-ouvertes.fr/hal-01077475
Submitted on 24 Oct 2014HAL is a multi-disciplinary open access archive for the deposit and dissemination of sci-entific research documents, whether they are pub-lished or not. The documents may come from teaching and research institutions in France or abroad, or from public or private research centers.
L’archive ouverte pluridisciplinaire HAL, est destinée au dépôt et à la diffusion de documents scientifiques de niveau recherche, publiés ou non, émanant des établissements d’enseignement et de recherche français ou étrangers, des laboratoires publics ou privés.
Distributed under a Creative Commons Attribution| 4.0 International License
(Virola surinamensis and Eperua falcata): Is Virola
unusual as previously reported?
Ts Barigah, G Aussenac, C Baraloto, D Bonal, Hervé Cochard, Agnès
Granier, Jm Guehl, R Huc, Ma Sobrado, Mt Tyree
To cite this version:
Ts Barigah, G Aussenac, C Baraloto, D Bonal, Hervé Cochard, et al.. The water relations of two tropical rainforest species (Virola surinamensis and Eperua falcata): Is Virola unusual as previously reported?. Journal of Plant Hydraulics, INRA Science and Impact, 2014, 1 (e0006), pp.e0002. �hal-01077475�
The water relations of two tropical rainforest species
(Virola surinamensis and Eperua falcata): Is Virola
unusual as previously reported?
Têtè Sévérien Barigah
1,4, Gilbert Aussenac
2, Christopher
Baraloto
4,8, Damien Bonal
2,4, Hervé
Cochard
1, André Granier
2, Jean-Marc Guehl
2, Roland Huc
3, Mari A. Sobrado
7and Melvin T.
Tyree
4,5,61
INRA UMR-PIAF, Domaine de Crouelle, 234, avenue du Brézet, F-63100 Clermont-Ferrand, France ; 2INRA, UMR-EEF, F-54280 Champenoux, France ;3INRA UREFM F-84000 Avignon, France ; 4INRA UMR-ECOFOG, BP 709, F-97387 Kourou, French Guiana ; 5Department of Renewable Resources, Faculty of Agricultural, Life and Environmental Sciences, 442 Earth Sciences Building, University of Alberta, Edmonton, Alberta, Canada T6G 2E3; 6United States Forest Service, 709 Spear St, PO Box 968, Burlington, Vermont 05402 USA; 7Laboratorio de Biologia Ambiental de Plantas, Departamento de Biología de Organismos, Universidad Simon Bolivar, Apartado 89.000, Caracas 1080, Venezuela ; 8Department of Biology, St Mary’s College of Maryland, 18952 E. Fisher Road, St Mary’s City, MD 20686 USA
Corresponding author : Têtè S. BARIGAH Tete.barigah@clermont.inra.fr Date of submission: 24 July 2013
Abstract
The objective of this study was to examine the water relations and hydraulic architecture and vulnerability to cavitation in Virola surinamensis and V. michelii and to compare to similar measurements in Eperua falcata. In several previous reports Virola was seen to have a rather narrow range of xylem pressure potentials (Ψx) near zero in the course of a wet-season day while having water fluxes quite close to Eperua. We tested the hypothesis that the narrow range of Ψx might be consistent with very high hydraulic conductivities of stems, roots and shoots and high vulnerability to cavitation in Virola compared to Eperua. When this hypothesis proved false we concluded that the previous determinations of Ψx might be wrong in
Virola due to latex. We re-examined the
determination of Ψx in Virola by the pressure chamber technique and compared results to determination of Ψleaf by the thermocouple psychrometer technique and found that the likely range of Ψx are more negative than previously reported. Problems concerning the determination of
Ψx in species with latex are discussed.
Introduction
The water relations of Virola surinamensis Warb. (Myristicaceae) and V. michelii has been compared and contrasted to two species in the family Caesalpiniaceae,
Eperua falcata Aub. and Diplotropis purpurea (Rich.)
Amsh. (Bonal et al. 2000b, Bonal and Guehl 2001, Guehl et al. 2004). Virola surinamensis and V. michelii have quite similar water relations so references to ‘Virola’ in this paper apply to both species. All species occur in the Paracou experimental station in French Guiana. Eperua is a semi-shade tolerant species whereas the Virola and Diplotropis are light-demanding. In the wet season gas exchange rates (E and An, evaporative flux density and net assimilation
flux density, respectively) and stomatal conductances (gs) are approximately comparable between species but
in the dry season E, An, and gs is virtually zero in Virola but only somewhat reduced in Eperua and Diplotropis (Bonal et al. 2000b). Total sap-flow rates
measured by the Granier method (Granier 1985, Granier 1987) were consistent with leaf-level measures of E. Stable isotope measurements of δ18
O in soil and xylem water in the dry season revealed that Virola extracted surface water in the upper 0.2 m of the soil whereas Eperua and Diplotropis extracted water between 1.4-2.5 m and 2.9-3.0 m, respectively (Bonal et al. 2000a). However, the diurnal tempo of leaf xylem-pressure potential (Ψx, measured with a pressure
chamber) was quite different among the three species.
Eperua leaves Ψx had rather normal diurnal tempos in
the wet and dry season falling to -2 MPa in both seasons; in contrast Virola leaves exhibited very little diurnal variation in Ψx. In Virola Ψx remained constant
above -0.2 MPa independent of time and season.
the wet and dry season but fell to values of -1.6 and -0.8 MPa in the wet and dry season, respectively.
The strikingly different behaviour of Ψx in Virola
in contrast to Eperua was tentatively interpreted in terms of differences in liquid path whole-plant conductances. According to the soil-plant continuum model of water flow in plants:
L L
/
A
/
A
/
plant plant soil leafK
A
F
K
E
=
=
Ψ
−
Ψ
, (1)where F = the whole plant sap flow rate, AL = leaf area
and Kplant/AL = whole plant hydraulic conductance
scaled to leaf area. The value Ψx is approximately equal
to Ψleaf except in cases where xylem solute potentials
are a significant fraction of Ψx. Since mid-day E values
in Virola and Eperua where both around 3 mmol s-1 m-2 in the wet season whereas Ψx values were -2 and -0.2
MPa for Eperua and Virola, respectively, at the same time, it follows that Kplant in Virola ought to be
approximately 10 x the corresponding value of Eperua (Guehl et al. 2004).
Why does Virola maintain Ψx near zero? One
possible interpretation is that Virola xylem might be extremely vulnerable to cavitation and hence must have high Kplant values to avoid loss of hydraulic
conductance due to cavitation in the wet season and must close stomates to avoid cavitation in the dry season. The purpose of this study was to see if stem hydraulics and vulnerability to cavitation are consistent with the above predictions. When we later found insufficient differences in stem hydraulics and vulnerability to explain the high values of Ψx, we
revisited the issue of how to measure water potential in
Virola, which has translucent latex in stems and leaves.
The latex looks much like foamy water until it solidifies into a white mass a few minutes after contact with air. Hence the emergence of latex might be confused with water while using a pressure chamber to get balance pressure (=-Ψx).
Materials and Methods
Experimental site
The main study was conducted at Paracou (5.2°N, 52.7°W) in French Guiana on a site managed by CIRAD-Forêt (Centre de coopération Internationale en Recherche Agronomique pour le Développement, Département forêt) from September 1997 to December 1999, February 2003, and April 2005. The rainfall regime in the site presents a seasonal pattern with a short dry season in February or March and a long dry season which extends from August to mid-November. The mean annual rainfall is of 2900 mm while the maximum (day) and minimum (night) air temperatures are 33°C and 20°C. The soil was a well-drained oxisol on Precambrian bedrock with a micro-aggregated structure. The experimental site consisted of 18x18 m2 mono-specific elementary plots of selected
native tree species. The 49 trees per plot were grown in 1983 at a distance of 3 m from each other after the natural forest was clear cut and the soil mechanically prepared with the under-storey species completely removed.
A 16 m scaffolding tower was placed in the centre of each plot of Virola surinamensis Warb. (Myristicaceae) and Eperua falcata Aub., (Caesalpiniaceae). The scaffold allowed to access leaves, branches and the canopy of 4 closest trees. Both tree species are evergreen and well distributed in the Amazon basin but they differ in their morphological ontogenetical crown architecture (Edelin 1991) as well as in their ecological characteristics. Eperua falcata is a semi-shade-tolerant tree and is more common on sites with moist soils (Barthès 1991, Favrichon 1994, Sabatier et al. 1997). Virola surinamensis is a light-demanding species and is usually found on very moist soils in bottom flats (Bena 1960). Data of leaf water potential, sap flow, net assimilation rates of individuals of these two species were collected during the dry seasons of 1997 and 1998 and those of stem xylem vulnerability in 1999 wet season. A second set of data was collected in February, 2003 on patterns of hydraulic resistance distribution in whole plant of seedlings of Eperua falcata and Virola michelii a species which functionally reacts as V. surinamensis in term of diurnal Ψx (Bonal et al. 2000c, Bonal and
Guehl 2001). Three seedlings per pot were grown under a partial shade (25% of full sunlight) in a screened growth house settled on the campus of Silvolab-Guyane, Kourou (5.2°N, 52.8°W). The seedlings were allowed to grow for 2 to 3 years; they were 0.5 to 1.5 m tall.
A new series of observations on Ψx and Ψleaf were
made in March 2005 on shoot material collected from mature trees in Kourou and Paracou.
Whole-shoot hydraulic architecture
Seedlings were cut and attached to a High Pressure Flow Meter (HPFM, Dynamax Inc., Texas). The HPFM is described in detail elsewhere (Tyree et al. 1993, Yang and Tyree 1994, Tyree et al. 1995). Briefly, the HPFM is an apparatus designed to perfuse water into the base of a shoot or a root system at constant pressure (quasi-steady state mode) or changing rapidly the applied pressure (transient mode) while measuring simultaneously the corresponding water flow rate (F). The HPFM is equipped to record the applied pressure (P) and the corresponding F every 3s from 0.0 to 0.50 MPa within 90s. The root hydraulic conductance (mmol s-1 MPa-1) is calculated from the slope of the linear region of the computation of F to P and is usually scaled to leaf surface area to yield Kroot /A mmol s
-1
m-2 MPa-1).
All measurements were made in the laboratory on seedlings or saplings of 0.003 to 0.015 m basal
diameter. The stem of a plant to be sampled was excised at roughly 0.02 to 0.04 m from the ground level. The shoot is hooked to the HPFM after having trimmed the cut end with a new razor-blade under water. Deionised and degassed water filtered to 0.1 µm at a pressure of 0.3 MPa was forced into the leafy shoot to cause a rapid perfusion of the shoot and its components. After 30 min minutes of perfusion, leaf air spaces filled with water which began dripping from the stomata; this corresponded to a time when shoot resistance became relatively stable (quasi-steady-state). Three values of the whole shoot resistance (Rshoot=
P
A
F
L ) are then recorded.
Following measurements of the root hydraulic conductance, the leaf lamina area (A) of each plant was determined with a Li-Cor 3000 area meter (Li-Cor, Lincoln, Nebraska, USA).
Conductivity measurements, vulnerability curves and hydraulic maps
Native steady state embolism and the related percent loss of conductivity (PLC) were assessed by inserting excised stem segments of Virola surinamensis and Eperua falcata tree species in a conductivity apparatus (Sperry et al. 1988, Cochard et al. 1992a). A large leafy branch of each species were excised in the air in the plantation, wrapped in a wet plastic bag and brought to the laboratory. Some twigs were immediately removed and re-cut under tap water in stem segments of roughly 0.02 m long. The remaining leafy branch of Eperua falcata was assigned to bench dehydration for vulnerability curve purpose. The use of a pressure bomb method (Cochard et al. 1992b) was thought necessary to perform the vulnerability curve of
Virola surinamensis leafy branch because this species
produced a latex which generally impairs the accuracy of leaf water potential measurements typically for high water content leaves. Five randomly selected stem segments of an outer diameter in the range of 0.002 to 0.008 m and petioles of each species were fitted into water-filled lengths of plastic tubing after having both ends recut under water with a new teflon coated razor blade.
Initial hydraulic conductivity (Ki, mmol s
-1
MPa-1 m), was determined by measuring the solution flow rate (F, mmol s-1) perfused through the stem segment of length L at a pressure drop (P, MPa) of about 4 kPa with a 10-4 g analytical balance. The solution consisted of 100 mmol KCl, degassed and 0.2 µm filtered. The initial conductivity is given by
P FL Ki
∆
= (2)
Afterwards, the stem segments were perfused with the same solution at a pressure of 150 to 180 kPa for 20 to 30 min to dissolve air bubbles. The hydraulic conductivity of the stem segments was determined
again at a pressure drop of 4 kPa. Repeating the latter steps 2 to 3 times allowed the segments to reach maximum conductivity (Km). Percentage Loss of
Conductivity (PLC) was calculated from m i m K K K PLC =100 − (3)
Vulnerability curves (VCs) were built for both species by plotting PLC data to the corresponding water potential of the distal leaf of each stem segment (Cochard et al. 1992a, Cochard et al. 1992b, Pockman et al. 1995) for Eperua falcata species and using the negative applied pressure in the case of Virola
surinamensis. To analyse the data on vulnerability to
embolism, we graphed loss of conductivity (PLC) versus applied pressure (P) for each sample. All the curves were sigmoïdal making the data suitable for analysis using sigmoïdal function. The shape of the sigmoid curve was characterized by three critical points, Ψcav, Ψ50 and Ψ100 which indicated the water
potential values that induced the start of the embolism, 50% and 100% of the maximal hydraulic conductivity, respectively. Ψcav and Ψ50 were measured by
graphical-interpolation (Cochard et al. 1999) of each VC fitted to the following function:
PLC(P) = 100/[1 + (P/P50PLC)s] (4)
Where s = a parameter affecting the slope of the VC near the 50% loss point.
Two hydraulic parameters were derived from the hydraulic conductivity of the stem segments cut from shoots: (1) The hydraulic conductivity (Kh, kg s
-1
m MPa-1) is the water flow rate (F, mmol s-1) across a plant segment (L, m) divided by the pressure-gradient (P/L, MPa m-1) causing the flow (equivalent to Ki in
Eq. 1). (2) The Leaf Specific Conductivity (KL, mmol s
-1
m-1 MPa-1) is equal to Kh divided by the leaf area
distal to the segment. KL is a measure of the hydraulic
sufficiency of the stem segment to supply water to leaves distal to that segment (Tyree and Ewers 1991, Tyree and Ewers 1996).
Hydraulic maps were constructed by measuring stem segment length and diameter of internodes, usually internodes contained one or no leaves and the leaf area attached to each segment was recorded together with the information about how segments were interconnected. A computer program was written to compute Kh from stem segment diameter for each
segment from regressions in Fig. 4 and to sum the leaf area attached to and distal of each segment. The program could then compute how Ψx should change
with distance from the base of each branch. See (Tyree 1988) for details of how this is done.
For all analyses, differences were considered significant when p<0.05.
Leaf water potential
Daily time-courses of leaf water potentials were measured on September 21st, October 19th, 1997 and on July 22nd 1998 with a pressure chamber (PMS, Corvallis, Oregon, USA) (Scholander et al. 1965); additional measurements of predawn and midday leaf water potential were made on the same trees at the end of 1998 wet season. The first emergence of fluid from the petiole or stem of Eperua or Virola, respectively, was taken as the balance pressure prior to April 2005. Later, two of us (MTT & MAS) tested the hypothesis that the first emergency of fluid in Virola was, in fact, clear-latex. The following altered protocol was used for pressure chamber measurements:
(1) Shoots containing 4 to 8 leaves were excised and placed in the pressure chamber. The air pressure was increased at a rate of 10 to 20 kPa s-1.
(2) The end of the stem was observed under 100X magnification using a ‘shop microscope’ model 3894 (Cole-Parmer, city, state). When clear foam (latex plus air appeared) it was rapidly blotted away with tissue paper. The foam usually was from just 1 to 4 distinct points in the stem cross-section and when the foam was removed no liquid appeared from anywhere except the same 1 to 4 points. Sometimes foam have to be removed every 1 or 2 s to maintain a clear view of the cut surface.
(3) The balance pressure was defined as the pressure at which liquid (water) appeared everywhere across the cut surface producing a general flood as distinct from foam. The xylem pressure potential, Ψx, was equated to
minus the balance pressure.
During field measurements of Ψx, two people
independently determined the balance pressure of each shoot. Between determinations the chamber pressure was lowered 0.2 to 0.5 MPa below the previous balance point.
Laboratory experiments were performed to provide independent confirmation of the balance pressure using thermocouple psychrometers originally described by (Dixon and Tyree 1984) (temperature corrected stem hygrometers, P.W.S. Instruments Inc., Guelph, Ontario, Canada). The psychrometers were calibrated against NaCl solutions with solute potentials from 0.23 to -2.28 MPa (corresponding to 0.05, 0.1, 0.2, 0.3, and 0.4 Molal concentrations of NaCl). The psychrometers were placed in a plastic bag and immersed in an insulated container with 70 litres of water (contained in a 140 litres ice chest). The insulation and large thermal mass of water insured that the psychrometer temperature remained constant at the mean room temperature (29 oC). Although the room temperature changed ± 2 to 3 oC from day to night the bath temperature fluctuated by less than 0.1 oC. Stable temperature is essential for the equilibration of water vapour in psychrometers.
Psychrometer outputs in the psychrometric-mode were activated by a 20 s cooling current output from a Wescor water potential system based on a CR7 data logger and A3487 cooling current interface (Wescor Inc, Logan, Utah, USA). For calibration curves the psychrometer output was logged every 20 min for 3 h; equilibration usually occurred in 1 to 1.5 h. Leaf samples, in contrast, had to be equilibrated for > 12 h so psychrometer outputs were logged every hour for 20 to 24 h to insure vapour equilibrium had been reached. The approach to equilibrium was usually an exponential relaxation with a half time of 0.2 to 0.3 h for salt solutions and 1.2 to 3 h for leaf discs as evidenced by log plots of [Ψeq-Ψt] versus time where Ψt = the
‘apparent water potential’ from the plateau of the psychrometric curve at time t and Ψeq = the stable
water potential after equilibrium (see Results). Equilibration curves that did not follow an approximate log-linear decline were discarded.
The pressure chamber values of Ψx were
‘calibrated’ against the psychrometers values of Ψ as follows:
(1) A Virola shoots with 4 to 8 leaves was excised and placed in the pressure chamber and the balance pressure immediately determined; sometimes shoots were dehydrate in the pressure chamber or in the lab air to achieve desired lower Ψx values.
(2) The shoot was removed and placed in a plastic bag to reduce water loss during sampling of leaf discs. One leaf punch (6.2 mm diameter) was taken from each of 4 leaves, weighed to the nearest µg on a micro-balance (Model MX5, Mettler-Toledo, Greifensee, Switzerland), and immediately sealed in a psychrometer.
(3) After sampling 4 leaves the balance pressure was measured again, because the balance pressure usually changed during the sampling of leaf discs due to evaporation from the leaves.
(4) After the psychrometer measurements were completed (about 24 h later) the leaf discs were removed and weighed again to measure how much water had to evaporate from the discs to vapor-equilibrate in the psychrometer chambers. The discs were then dried at 50 to 53 oC for 3 to 4 days and the dry weights were measured. This allowed us to independently correlate balance pressure and psychrometer reading with a gravimetric measure of water status.
Results
Leaf water potential
The daily time course of leaf-xylem pressure-potential (Ψx) in Eperua falcata and Virola surinamensis (Figure 1B) differed substantially
between the two species when measured in 1998. The sap flow measurements in Figure 1A were measured at the same time as the Ψx measurements in Fig. 1B. A
quasi steady state Ψx of -0.18 ± 0.05 MPa was observed
all along the daytime in Virola while Eperua responded quickly to changes in E and sap flow rate in the morning. The Ψx pattern in Eperua dropped to -2.03 ±
0.17 MPa during the afternoon. From its lowest value, the Ψx increased towards the predawn leaf water
potential. In contrast, when Ψx diurnals were measured
again by MTT & MAS, quite normal curves were obtained (Fig. 1C) during a partly cloudy day in the wet season.
Figure 1: A : Daily time-course of sap flow density for Eperua and Virola measured on plantation trees in Paracou, French Guiana. Data were recorded in the wet season and points are hourly averages. B: Daily time-course of Ψx (xylem pressure potential) measured by the pressure chamber technique on the same trees and on the same day as the sap flow measurements in A. Figures 1A and B were adapted from previously published work in Figs 5 and 9 of (Bonal et al. 2000b) C: A re-determination of the daily time-course of Ψx on the same Virola trees in the wet season of 2005. The open and closed symbols give the means of Ψx determined by two observers (MTT & MAS). Error bars are standard errors of the mean (N = 4 to 6 for Ψx).
Laboratory determinations of water potential and water content
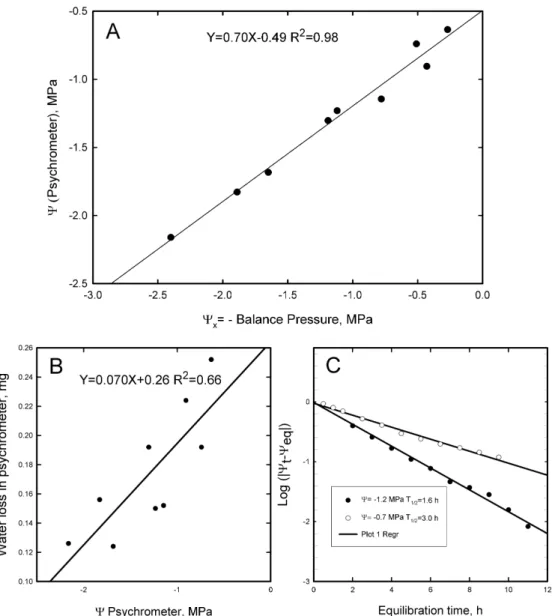
Figure 2A shows Ψx determined with the pressure
chamber vs the water potential (Ψpsy) determined by
thermocouple psychrometers. The linear relationship was described by Ψx=0.700 Ψpsy -0.447 (R2=0.94). At
high water potentials Ψpsy was more negative than Ψx
and the slope was less than expected from a 1:1 relationship. The pressure chamber does not measure water potential whereas the psychrometer does. The pressure chamber measures only xylem pressure potential. So if there were some solutes in the xylem fluid the xylem pressure potential would be less negative than the water potential (Ψpsy). Another part of
the discrepancy might be the volume of water that must evaporate from the leaf disc to equilibrate in the psychrometer. This volume is equal to the weight loss between the time when the disc is placed into the psychrometer chamber minus the weight when the disc was removed. This value increased with increasing water potential (Figure 2B). Most of the water loss required to ‘wet up’ the psychrometer chamber includes two components: water to increase the humidity of the air and water of adsorption to the walls of the chamber. The water of adsorption (the slope of the line in Fig 2B) was 0.0684 mg MPa-1, and the intercept indicated that 0.26 mg of water was lost to wet up the psychrometer chamber to Ψ = 0. The saturation vapour concentration of water in air at 29 oC = 0.029 mg cm-3 and the air-volume of the psychrometers was 0.13 cm-3, hence the amount of water that must evaporate from the leaf disc to saturate the air must be 0.0038 mg at Ψ = 0. Since
the psychrometer chambers were equilibrated under water, the water loss from the discs could not have been lost to the atmosphere outside the psychrometer chamber. Hence most of the water evaporated from the disc wetted up the walls. The number of molecular layers of water adsorption increases as water potential approaches zero, whereas the amount of water to ‘wet up’ the air changes little with water potential because the relative humidity of the air in the chamber changes only from 98% at -2.8 MPa to 100% at 0 MPa. The average leaf disc contained a total of 3.5 mg of water per disc; so in terms of percent of the total disc water, the water of adsorption is nearly 2% MPa-1 and water evaporation will result in a substantial error in the measurement of Ψpsy between -2 and 0MPa. From Fig.
2B we see that 0.24 mg of water loss occurred when
Ψpsy = -0.5MPa. The typical difference between water
content at 0MPa and the turgor-loss point of most species is just 10 to 20% of the water content. So a sample at 0MPa (Ψx) when placed in the psychrometer,
could easily loose 7% of its water making the equilibrium water potential (Ψpsy) more negative than
you would conclude from Ψx measurements with a
Figure 2: A: The calibration of Ψx measured with a pressure chamber versus Ψpsy measured on leaf punches collected from the same shoots used in the pressure chamber. Each point is the mean of 4 disc samples in 4 thermocouple psychrometer chambers. B: The relationship between water lost in the psychrometer chambers and the final equilibrium Ψpsy. Water loss was determined by the weight of the disc when placed in the chamber minus the weight when removed. C: Typical tempo of vapor equilibration of leaf discs in our psychrometer chambers. The equilibration is plotted as log (Ψeq-Ψt), where Ψt is the psychrometer reading at time t on the x-axis and Ψeq is the ultimate equilibrium value. Each point is the mean Ψt of 4 psychrometer chambers. The log-linear plot is consistent with a model of exponential relaxation to equilibrium. The half time for equilibration is = Log(2)/-slope.
Disc water content is an independent measure of leaf water stress hence we plotted Ψx and Ψpsy versus
final or initial leaf water content but found that both plots had rather high variance in water content giving rather weak correlations with Ψx and Ψpsy (data not
shown). Hence water contents did not give us any basis to accept the correctness of Ψx values over Ψpsy values. Vulnerability to cavitation, hydraulic conductivity and whole plant conductance
The VCs for petioles and stem segments of both species are displayed in Figure 3 and the
parameters of the logistic fitting are set in the figure legend. The pattern of the VCs of Virola for stems and petioles differed from those of Eperua. A significant native state embolism which reached 25% of the maximum hydraulic conductivity in the stem segments of Virola was observed. These species differed also in the water potential (Ψ50) at which they loose 50% of
their full hydraulic conductivity. The value of Ψ50 was
–2.67 MPa in Virola and -3.34 MPa in Eperua. Full loss of hydraulic conductivity occurred at a lower water potential in Eperua than in Virola.
Figure 3: Vulnerability curves determined on stem segments and petioles of Virola and Eperua. The regression equation used to fit the vulnerability curves is:
PLC = (100-PLC0)/(1+exp(s*(Ψ-P50)))+PLC0 Where Ψ = xylem pressure, PLC0 = native state PLC, P50 = xylem pressure at 50% PLC, and s = slope parameter. The open and closed symbols give the means of percent loss of conductivity in Eperua (closed) and Virola (open) while the circles stand for stems and squares for petioles. The error bars are standard deviations.
For both species, a linear relationship was observed between the Log leaf specific hydraulic conductivity (KL) and diameter of the stem segments
(figure 4A) and an approximately linear relationship was observed between the Log hydraulic conductivity (Kh) and the stem basal diameter for the same samples
(figure 4B). No relationships were found between the petioles hydraulic conductivity and either the basal diameter (Figure 4C and 4D) or the leaf area distal to each stem segment (data not shown)
The smallest diameter stem segments of Virola were about 3x less conductive (Kh) than similar
diameter Eperua stem segments (p <0.05) but Kh
increased more rapidly with diameter in Virola than in
Eperua so that Kh values were not significantly
different in 5 mm diameter stems.
However whole plant, whole shoot and whole root hydraulic conductances normalized to leaf area were found to be lower in Virola michelii than in Eperua when measured by the HPFM technique (figure 5).
However, whole shoot and whole root conductances per unit leaf area include both vascular and non-vascular components and it is currently thought that in small plants the non-vascular resistances in leaves and roots might dominate ((Tyree and Zimmermann 2002), page 175-187).
Hydraulic map data were collected on one shoot of comparable length in each of Virola and Eperua. Since the hydraulic map contains information on stem segment diameter, length and leaf area attached, one can assign to each stem segment a Kh value from Figure
4B and since we know the leaf area attached to each segment (one leaf per segment at most), it is possible to compute water flow rates in each segment and water potential gradients assuming a defined pattern of E from leaf to leaf. Assuming E is the same in each leaf of each species (3 mmol s-1 m-2) the water potential gradients shown in Figure 6 result.
Figure 4: Hydraulic parameters determined on stem segments and petioles of Virola (open symbol) and Eperua (closed symbol) plotted versus stem or petiole diameter. Kh = the hydraulic conductivity and KL = leaf specific conductivity. Regression lines (solid lines) of the plots of the stem-segment data include the 95% confidence intervals (dashed lines).
Figure 5: Whole plant, whole shoot and whole root conductances normalized to leaf area measured on Virola michelii and Eperua seedlings/saplings growing in pots. Error bars are standard errors of the mean (N= 9 for Virola
and N=7 for Eperua). Figure 6: Profiles of Ψx computed from hydraulic maps
assuming the E = 3 mmol s-1 MPa-1 in all leaves. The y-axis is the pressure difference from the base of mapped shoot to any given segment in the shoot; the x-axis is the path length from the base to any given segment in the shoot.
Discussion
Several published (Huc et al. 1994, Bonal et al. 2000b, Bonal and Guehl 2001, Guehl et al. 2004, Huc et al. 1994) and unpublished data sets of Ψx measured
by the pressure chamber method have been collected on
Virola and until this study the values of Ψx where
thought to be ≥-0.2 MPa at mid-day in both the wet and dry season. Consequently the notion was put forward that Virola might be very vulnerable to cavitation and hence might have very high hydraulic conductivity to avoid very negative Ψx values at times of high
evaporative flux density (E, see Eq. 1). This study revealed that KL values of Virola stems were the same
or lower than KL in Eperua (Fig. 4), and the whole
plant conductance normalized to leaf area was lower in
Virola than Eperua (Fig. 5). The predicted Ψx-gradients
in 1.2 m long shoots is not much different between
Virola and Eperua (Fig. 6). Also the vulnerability
curves were only slightly different in Virola and
Eperua in both stems and petiole (Fig. 3). The above
results were inconsistent with our hypothesis of very high conductance and vulnerability to cavitation in
Virola compared to Eperua, hence we were compelled
to re-examine the methods used to measure Ψx.
We reasoned that latex may have contributed to the problem of determining correct values of Ψx. The
latex is an emulsion or suspension of many solid particles and can be translucent like water or coloured (white, pink, yellow etc) but most commonly has a milky appearance. Latex may contain rubber, starch, proteins, alkaloids, waxes, resins, or various pigments, and latex tends to come out immediately upon excision of stems and also during pressurization of shoots or leaves in a pressure chamber. As a result, latex emission during pressure chamber measurements of Ψx
could easily interfere with the determination of balance pressures (Scholander et al. 1965).
In most cases, latex does not interfere with pressure chamber measurements and Ψx is determined on a
sample (shoot or leaf) in a pressure chamber by increasing the gas pressure slowly until observing the pressure at which liquid first appears at the surface of the cut stem or petiole. To obtain accurate value of Ψx
(= - balance pressure) it is advisable to keep the sample in a pressure chamber lined with wet filter paper and confirming equilibrium in two ways: (1) By reducing the chamber pressure below the balance point for 10 min and then re-determining Ψx. If the original Ψx is
not observed again then another period of waiting for equilibration is needed. Usually Ψx increases to a less
negative and stable value during equilibration. (2) Confirming that copious quantities of water appear when the chamber pressure is increased 0.05 MPa above the stable balance point. However, if the aim is to get many determinations of Ψx on different samples in
a day then people are usually satisfied with the first
appearance of liquid. This method cannot be used on species with latex rather the technique described in the Methods section is advisable.
When in doubt about the determination of Ψx in
plants with copious latex, it is advisable to cross check
Ψx values against an independent measure of leaf water
potential using thermocouple psychrometers. However, psychrometers are even more difficult to work with than the pressure chamber on latex-plants. Care must be taken to control temperature during psychrometer measurements. If temperature changes during equilibration, a temperature gradient will result between the leaf-disc sample and the thermocouple junction and a temperature difference of just 0.1 oC will cause an error of 0.7 MPa in Ψx (Dixon and Tyree 1984). Also
psychrometer readings need to be repeated over time and plotted as a log-transform (Fig. 2C) in order to confirm that half time for equilibration has been exceeded by 5 or 6 half times. Most people terminate psychrometer measurements too soon to be at equilibration. In many cases 24 h equilibration periods are needed (Talbot et al. 1975), and leaf disc equilibration times are usually 10 times longer than the equilibration times for calibration solutions on wet filter-paper discs. Most people estimate the time for equilibration by measuring psychrometer outputs at just two times and this practice never provides definitive information on equilibration time. Also the amount of water that has to evaporate from the leaf disc to ‘wet up’ the psychrometer chamber (Fig 2B) can cause an underestimation of Ψ from psychrometer readings.
(Reekie and Bazzaz 1989) reported dramatic interspecific differences in leaf Ψx. They observed Ψx ≥
-0.1 MPa in 3 out of their 5 studied tropical species (Cecropia obtusifolia, Myriocarpa longipes and Piper
auritum) at day whereas 2 other species had
mid-day Ψx ≤ -1 MPa under identical growth conditions
(Trichospermum mexicanum and Senna multijuga. Since the former 3 species have latex our suspicion is that Ψx may have been incorrectly determined.
However, Ψx values near 0 MPa are not always wrong.
For example, if Ψx are quite high and the species
proves to be extremely vulnerable to cavitation then plants must adapt to maintain high Ψx by having high Kplant values. Several species are now known to suffer >
50% loss of hydraulic conductivity in stems at Ψx ≥
-0.5 MPa (Tyree et al. 1994, Tyree 1999, Maherali et al. 2004). Another physiological adaptation of plants may also keep Ψx at relatively high values during the course
of a day: variable plant hydraulic conductance. We speculate that such adaptations may prove to be more common in light-demanding species than in shade-tolerant species. Species that are candidates for variable plant conductance can be identified from the diurnal relationship between leaf water potential and transpiration rate.
Three types of relationship between leaf water potential, Ψleaf, and transpiration rate, E, are mainly
encountered in the literature. The most common ones fit a linear model (Camacho-B et al. 1974, Landsberg et al. 1975), which indicates that the soil-plant resistance is constant and independent of the flow rate. In many cases, however, the relationship shows a marked curvature (Jones 1978) while, in extreme cases, water potential is nearly constant over a wide range of E (Camacho-B et al. 1974, Reekie and Bazzaz 1989, Bonal et al. 2000b, Bonal and Guehl 2001). In some cases this extreme behaviour might indicate errors in the measurement of Ψleaf, but these results also have
been interpreted as soil-plant resistance decreasing with flow rates (Camacho-B et al. 1974). The reason for the flow rate dependence of soil-plant resistance is still unknown, though several hypotheses have been suggested (Fiscus 1975, Passioura 1984, Boyer 1985). The tendency for resistance to decrease with increasing flow rate is mechanistically slightly surprising, since it might be expected that the soil component of the resistance would increase (Jones 1992). However more recently there has been positive evidence for non-constancy of shoot and root hydraulic conductivity in some species. For example roots and shoots show a circadian periodicity in hydraulic conductance (Henzler et al. 1999, Tsuda and Tyree 2000) and tobacco roots have been found to be 10 times more conductive at noon than at midnight (Tyree and Zimmermann 2002) p 209). More recently the liquid path conductances of leaves have been found to increase 2 to 4 times in response to normal daytime irradiance intensities (Tyree et al. 2005). The gating of aquaporins open and closed might account for large changes in hydraulic conductance on non-vascular tissues during the course of a day. Hence we might expect strange relationships between E and Ψleaf in species where whole plant
conductances are dominated by non-vascular hydraulic resistances.
Acknowledgements
The authors are grateful to Pascal Imbert, Eliane Louisanna, Saintano Dufort, Dumaine Duchant and Audin Patient for their valuable technical assistance. Thanks are due to CIRAD-Forêts for permission to do field experiments. MTT wishes to thank the INRA for financial support to operate a water relations lab in Kourou, French Guiana. MAS wishes to the Simon Bolivar University and the INRA for travel funds that made possible her research in Kourou.
References
Barthès, B. 1991. Influence des caractères pédologiques sur la répartition spatiale de deux espèces du genre
Eperua (Caesalpiniaceae) en forêt guyanaise. Rev.
Ecol. (Terre Vie). 46:303-320.
Bena, P. 1960. Essences forestières de Guyane. Imprimerie Nationale, Paris. 488 p.
Bonal, D., C. Atger, T.S. Barigah, A. Ferhi, J.-M. Guehl and B. Ferry 2000a. Water acquisition patterns of two wet tropical canopy tree species of French Guiana as inferred from H2
18
O extraction profiles. Ann. For. Sci. 57:717-724.
Bonal, D., T.S. Barigah, A. Granier and J.M. Guehl 2000b. Late-stage canopy tree species with extremely low delta 13C and high stomatal sensitivity to seasonal soil drought in the tropical rainforest of French Guiana. Plant Cell Environ. 23:445-459.
Bonal, D., D. Sabatier, P. Montpied, D. Tremeaux and J.M. Guehl 2000c. Interspecific variability of d13C among canopy trees in rainforests of French Guiana: Functional groups and canopy integration. Oecologia. 124:454-468.
Bonal, D. and J.M. Guehl 2001. Contrasting patterns of leaf water potential and gas exchange responses to drought in seedlings of tropical rainforest species. Functional Ecology. 15:490-496.
Boyer, J.S. 1985. Water Transport. Ann. Rev. Plant Physiol. 36:473-516.
Camacho-B, S.E., A.E. Hall and M.R. Kaufmann 1974. Efficiency and regulation of water transport in some woody and herbaceous species. Plant Physiol. 54:169-172.
Cochard, H., N. Breda, A. Granier and G. Aussenac 1992a. Vulnerability to Air Embolism of the Three European Oak Species (Quercus Petraea (Matt) Liebl, Q. Pubescens Willd, Q. Robur L.). Ann. Sci. For. 49:225-233.
Cochard, H., P. Cruiziat and M.T. Tyree 1992b. Use of positive pressures to establish vulnerability curves: further support for air-seeding hypothesis and implications for pressure-volume analysis. Plant Physiology. 100:205-209.
Cochard, H., D. Lemoine and E. Dreyer 1999. The effects of acclimation to sunlight on the xylem vulnerability to embolism in Fagus sylvatica L. Plant Cell Environ. 22:101-108.
Dixon, M.A. and M.T. Tyree 1984. A new temperature corrected stem hygrometer and its calibration against the pressure bomb. Plant Cell Environ. 7:693-697. Edelin, C. 1991. Nouvelles données sur l'architecture
des arbres sympodiaux : le concept de plan d'organisation. In L'arbre. Biologie et Développement Ed. C. Edelin. Naturalia Monspeliensia, pp 27-154. Favrichon, V. 1994. Classification des espèces arborées
en groupes fonctionnels en vue de la réalisation d'un modèle de dynamisme de peuplement en forêt guyanaise. Rev. Ecol. 49:379-403.
Fiscus, E.L. 1975. The interaction between osmotic- and pressure- induced water flow in plant roots. Plant Physiol. 55:917-922.
Granier, A. 1985. Une nouvelle méthode pour la mesure du flux de sève brute dans le tronc des arbres. Ann. Sci. For. 42:193-200.
Granier, A. 1987. Evaluation of transpiration in a douglas-fir stand means of sap flow measurements. Tree Physiology. 3:309-320.
Guehl, J., D. Bonal, A. Ferhi, T. Barigah, G. Farquhar and A. Granier 2004. Community level diversity of carbon-water relations in rainforest trees. In Ecology and Management of a Neotropical Rainforest Eds. S. Gourlet-Fleury, J.-M. Guehl and O. Laroussinie. Elsevier Press, Paris, pp 75-94.
Henzler, T., R.N. Waterhouse, A.J. Smyth, M. Carvajal, D.T. Cooke, A.R. Schaffner, E. Steudle and D.T. Clarkson 1999. Diurnal variations in hydraulic conductivity and root pressure can be correlated with the expression of putative aquaporins in the roots of
Lotus japonicus. Planta. 210:50-60.
Huc, R., A. Ferhi and J.M. Guehl 1994. Pioneer and late stage tropical rainforest tree species (French Guiana) growing under common conditions differ in leaf gas exchange regulation, carbon isotope discrimination and leaf water potential. Oecologia. 99:297-305.
Jones, H.G. 1978. Modelling diurnal trends of leaf water potential in transpiring wheat. J. Appl. Ecol. 15:613-626.
Jones, H.G. 1992. Plant water relations. In Plants and microclimates: a quantitative approach to environmental plant physiology Ed. H.G. Jones. University press, Cambridge, Cambridge, pp 72-105. Landsberg, J.J., C.L. Beadle, P.V. Biscoe, D.R. Butler,
B. Davidson, L.D. Incoll, G.B. James, P.G. Jarvis, P.J. Martin, R.E. Neilson, D.B.B. Powell, E.M. Slack, M.R. Thorpe, N.C. Turner, P.J. Warrit and W.R. Watts 1975. Diurnal energy, water and CO2
exchanges in an Apple (Malus pumila) orchard. J. Appl. Ecol. 12:659-684.
Maherali, H., W.T. Pockman and R.B. Jackson 2004. Adaptive variation in the vulnerability of woody plants to xylem cavitation. Ecology. 85:2184-2199. Passioura, J.B. 1984. Hydraulic resistance of plants. I.
Constant of variable ? Aust. J. Plant Physiol. 11:333-339.
Pockman, W.T., J.S. Sperry and J.W. O'Leary 1995. Sustained and significant negative water pressure in xylem. Nature. 378:715-716.
Reekie, E.G. and F.A. Bazzaz 1989. Competition and patterns of resource use among seedlings of five tropical trees grown at ambient and elevated CO2.
Oecologia. 79:212-222.
Sabatier, D., M. Grimaldi, M.F. Prevost, J. Guillaume, M. Godron, M. Dosso and P. Curmi 1997. The influence of soil cover organisation on the floristic and structural heterogeneity of a Guianan rain forest. Plant Ecology. 131:81-108.
Scholander, P.F., H.T. Hammel, E.D. Bradstreet and E.A. Hemmingsen 1965. Sap pressure in vascular plants. Science. 148:339-346.
Sperry, J.S., J.R. Donnelly and M.T. Tyree 1988. A method for measuring hydraulic conductivity and embolism in xylem. Plant Cell Environ. 11:35-40. Talbot, A.J.B., M.T. Tyree and J. Dainty 1975. Some
notes concerning the measurement of water potentials of leaf tissues with specific reference to Tsuga
canadensis and Picea abies. Can. J. Bot. 53:784-788.
Tsuda, M. and M.T. Tyree 2000. Plant hydraulic conductance measured by the high pressure flow meter in crop plants. Journal of Experimental Botany. 51:823-828.
Tyree, M.T. 1988. A dynamic model for water flow in a single tree: evidence that models must account for hydraulic architecture. Tree Physiol. 4:195-217. Tyree, M.T. and F.W. Ewers 1991. The hydraulic
architecture of trees and other woody plants. New Phytol. 119:345-360.
Tyree, M.T., B. Sinclair, P. Lu and A. Granier 1993. Whole shoot hydraulic resistance in Quercus species measured with a new high pressure flowmeter. Ann. Sci. For. 50:417-423.
Tyree, M.T., S.D. Davis and H. Cochard 1994. Biophysical perspectives of xylem evolution : is there a tradeoff of hydraulic efficiency for vulneravility to dysfunction. IAWA Journal. 15:335-360.
Tyree, M.T., S. Patino, J. Bennink and J. Alexander 1995. Dynamic measurements of root hydraulic conductance using a high-pressure flowmeter in the laboratory and field. Journal of Experimental Botany. 46:83-94.
Tyree, M.T. and F.W. Ewers 1996. Hydraulic architecture of woody tropical plants. Eds. S.S. Mulkey, R.L. Chazdon and A.P. Smith. Chapman and Hall, New York, pp 217-243.
Tyree, M.T. 1999. Water relations and hydraulic architecture. In Handbook of functional plant ecology. Eds. F.I. Pugnaire and F. Valladares. Marcel Dekker, Us, pp 222-268.
Tyree, M.T. and M.H. Zimmermann 2002. Xylem structure and the ascent of sap. Springer, New York, 283 p.
Tyree, M.T., A. Nardini, S. Salleo, L. Sack and B. ElOmari 2005. The dependence of leaf hydraulic conductance on irradiance during HPFM measurements: any role for stomatal control? J. Exp. Bot. 56:737-744.
Yang, S. and M.T. Tyree 1994. Hydraulic architecture of Acer saccharum and A. rubrum : comparison of branches to whole trees and the contribution of leaves to hydraulic resistance. Journal of Experimental Botany. 45:179-186.