Publisher’s version / Version de l'éditeur:
The Astrophysical Journal, 834, 2, p. L8, 2017-01-10
READ THESE TERMS AND CONDITIONS CAREFULLY BEFORE USING THIS WEBSITE. https://nrc-publications.canada.ca/eng/copyright
Vous avez des questions? Nous pouvons vous aider. Pour communiquer directement avec un auteur, consultez la
première page de la revue dans laquelle son article a été publié afin de trouver ses coordonnées. Si vous n’arrivez pas à les repérer, communiquez avec nous à [email protected].
Questions? Contact the NRC Publications Archive team at
[email protected]. If you wish to email the authors directly, please see the first page of the publication for their contact information.
NRC Publications Archive
Archives des publications du CNRC
This publication could be one of several versions: author’s original, accepted manuscript or the publisher’s version. / La version de cette publication peut être l’une des suivantes : la version prépublication de l’auteur, la version acceptée du manuscrit ou la version de l’éditeur.
For the publisher’s version, please access the DOI link below./ Pour consulter la version de l’éditeur, utilisez le lien DOI ci-dessous.
https://doi.org/10.3847/2041-8213/834/2/L8
Access and use of this website and the material on it are subject to the Terms and Conditions set forth at
The repeating fast radio burst FRB 121102 as seen on milliarcsecond
angular scales
Marcote, B.; Paragi, Z.; Hessels, J. W. T.; Keimpema, A.; Langevelde, H. J.
Van; Huang, Y.; Bassa, C. G.; Bogdanov, S.; Bower, G. C.; Burke-Spolaor,
S.; Butler, B. J.; Campbell, R. M.; Chatterjee, S.; Cordes, J. M.; Demorest,
P.; Garrett, M. A.; Ghosh, T.; Kaspi, V. M.; Law, C. J.; Lazio, T. J. W.;
Mclaughlin, M. A.; Ransom, S. M.; Salter, C. J.; Scholz, P.; Seymour, A.;
Siemion, A.; Spitler, L. G.; Tendulkar, S. P.; Wharton, R. S.
https://publications-cnrc.canada.ca/fra/droits
L’accès à ce site Web et l’utilisation de son contenu sont assujettis aux conditions présentées dans le site LISEZ CES CONDITIONS ATTENTIVEMENT AVANT D’UTILISER CE SITE WEB.
NRC Publications Record / Notice d'Archives des publications de CNRC:
https://nrc-publications.canada.ca/eng/view/object/?id=cfb788a3-329f-476d-92e9-fab5d194d649 https://publications-cnrc.canada.ca/fra/voir/objet/?id=cfb788a3-329f-476d-92e9-fab5d194d649The Repeating Fast Radio Burst FRB 121102 as Seen on Milliarcsecond Angular Scales
B. Marcote1, Z. Paragi1, J. W. T. Hessels2,3, A. Keimpema1, H. J. van Langevelde1,4, Y. Huang5,1, C. G. Bassa2, S. Bogdanov6,G. C. Bower7, S. Burke-Spolaor8,9,10, B. J. Butler8, R. M. Campbell1, S. Chatterjee11, J. M. Cordes11, P. Demorest8, M. A. Garrett12,4,2, T. Ghosh13, V. M. Kaspi14, C. J. Law15, T. J. W. Lazio16, M. A. McLaughlin9,10, S. M. Ransom17, C. J. Salter13,
P. Scholz18, A. Seymour13, A. Siemion15,2,19, L. G. Spitler20, S. P. Tendulkar14, and R. S. Wharton11 1
Joint Institute for VLBI ERIC, Postbus 2, NL-7990 AA Dwingeloo, The Netherlands;[email protected]
2ASTRON, Netherlands Institute for Radio Astronomy, Postbus 2, NL-7990 AA Dwingeloo, The Netherlands;[email protected] 3
Anton Pannekoek Institute for Astronomy, University of Amsterdam, Science Park 904, NL-1098 XH Amsterdam, The Netherlands
4
Sterrewacht Leiden, Leiden University, Postbus 9513, NL-2300 RA Leiden, The Netherlands
5
Department of Physics and Astronomy, Carleton College, Northfield, MN 55057, USA
6
Columbia Astrophysics Laboratory, Columbia University, New York, NY 10027, USA
7
Academia Sinica Institute of Astronomy and Astrophysics, 645 N. A’ohoku Place, Hilo, HI 96720, USA
8
National Radio Astronomy Observatory, Socorro, NM 87801, USA
9
Department of Physics and Astronomy, West Virginia University, Morgantown, WV 26506, USA
10
Center for Gravitational Waves and Cosmology, West Virginia University, Chestnut Ridge Research Building, Morgantown, WV 26505, USA
11Cornell Center for Astrophysics and Planetary Science and Department of Astronomy, Cornell University, Ithaca, NY 14853, USA 12
Jodrell Bank Centre for Astrophysics, University of Manchester, Manchester M13 9PL, UK
13
Arecibo Observatory, HC3 Box 53995, Arecibo, PR 00612, USA
14
Department of Physics and McGill Space Institute, McGill University, 3600 University Street, Montreal, QC H3A 2T8, Canada
15
Department of Astronomy and Radio Astronomy Lab, University of California, Berkeley, CA 94720, USA
16
Jet Propulsion Laboratory, California Institute of Technology, Pasadena, CA 91109, USA
17
National Radio Astronomy Observatory, Charlottesville, VA 22903, USA
18
National Research Council of Canada, Herzberg Astronomy and Astrophysics, Dominion Radio Astrophysical Observatory, P.O. Box 248, Penticton, BC V2A 6J9, Canada
19
Radboud University, NL-6525 HP Nijmegen, The Netherlands
20
Max-Planck-Institut für Radioastronomie, Auf dem Hügel 69, D-53121 Bonn, Germany
Received 2016 December 10; revised 2016 December 21; accepted 2016 December 22; published 2017 January 4
Abstract
The millisecond-duration radio flashes known as fast radio bursts (FRBs) represent an enigmatic astrophysical phenomenon. Recently, the sub-arcsecond localization (∼100 mas precision) of FRB121102 using the Very Large Array has led to its unambiguous association with persistent radio and optical counterparts, and to the identification of its host galaxy. However, an even more precise localization is needed in order to probe the direct physical relationship between the millisecond bursts themselves and the associated persistent emission. Here, we report very-long-baseline radio interferometric observations using the European VLBI Network and the 305 m Arecibo telescope, which simultaneously detect both the bursts and the persistent radio emission at milliarcsecond angular scales and show that they are co-located to within a projected linear separation of 40 pc (12 mas angular separation, at 95% confidence). We detect consistent angular broadening of the bursts and persistent radio source (∼2–4 mas at 1.7 GHz), which are both similar to the expected Milky Way scattering contribution. The persistent radio source has a projected size constrained to be 0.7 pc (0.2 mas angular extent at 5.0 GHz) and a lower limit for the brightness temperature of Tb ´5 10 K7 . Together, these observations provide strong evidence for a direct physical link between FRB121102 and the compact persistent radio source. We argue that a burst source associated with a low-luminosity active galactic nucleus or a young neutron star energizing a supernova remnant are the two scenarios for FRB121102 that best match the observed data.
Key words:radiation mechanisms: non-thermal – radio continuum: galaxies – techniques: high angular resolution
1. Introduction
Fast radio bursts (FRBs) are transient sources of unknown physical origin, which are characterized by their short (∼ms), highly dispersed, and bright (Speak~0.1 10 Jy– ) pulses. Thus far, 18 FRBs have been discovered using single-dish observa-tions (e.g., Lorimer et al. 2007; Thornton et al. 2013; Petroff et al. 2016). Unambiguous associations with multiwavelength counterparts have been extremely limited by the poor localization that such telescopes provide (uncertainty regions of at least several square arcminutes). Keane et al. (2016)
reported the first apparent localization of an FRB by associating FRB150418 with a pseudo-contemporaneous transient radio source in a galaxy at z~0.5. However, further studies have shown that the transient source continues to vary in brightness well after the initial FRB150418 burst detection, and can be explained by a scintillating, low-luminosity active galactic nucleus (AGN; e.g., Bassa et al. 2016; Giroletti et al. 2016; Johnston et al. 2017; Williams & Berger2016), which leaves limited grounds to claim an unambiguous association with FRB150418.
Thus far, FRB121102 is the only known FRB to have shown repeated bursts with consistent dispersion measure (DM) and sky localization (Spitler et al.2014, 2016; Scholz et al.2016). Recently, using fast-dump interferometric imaging with the Karl G. Jansky Very Large Array (VLA),
834:L8 (9pp), 2017 January 10 doi:10.3847/2041-8213/834/2/L8
© 2017. The American Astronomical Society. All rights reserved.
Original content from this work may be used under the terms of theCreative Commons Attribution 3.0 licence. Any further distribution of this work must maintain attribution to the author(s) and the title of the work, journal citation and DOI.
FRB121102 has been localized to ∼100 mas precision (Chatterjee et al. 2017). The precise localization of these bursts has led to associations with both persistent radio and optical sources and the identification of FRB121102ʼs host galaxy (Chatterjee et al.2017; Tendulkar et al.2017). European VLBI Network (EVN) observations, confirmed by the Very Long Baseline Array (VLBA), have shown that the persistent source is compact on milliarcsecond scales (Chatterjee et al. 2017). Optical observations have identified a faint (mr¢=25.10.1 ABmag) and extended (0.6–0.8 arcsec) counterpart in Keck and Gemini data, located at a redshift
z=0.192730.00008—i.e., at a luminosity distance of
DL »972 Mpc, and implying an angular diameter distance of DA»683 Mpc(Tendulkar et al.2017). The centroids of the persistent optical and radio emission are offset from each other by ∼0.2 arcsec, and the observed optical emission lines are dominated by star formation, with an estimated star formation rate of~0.4Myr-1(Tendulkar et al.2017). In X-rays,
XMM-Newtonand Chandra observations provide a 5σ upper limit in the 0.5–10 keV band of LX< ´5 1041erg s-1 (Chatterjee et al.2017).
In the past few years, significant efforts have been made to detect and localize millisecond transient signals using the EVN (Paragi 2016). This was made possible by the recently commissioned EVN Software Correlator (SFXC; Keimpema et al. 2015) at the Joint Institute for VLBI ERIC (JIVE; Dwingeloo, the Netherlands). Here, we present joint Arecibo and EVN observations of FRB121102 that simultaneously detect both the persistent radio source as well as four bursts from FRB121102, localizing both to milliarcsecond precision. In Section2, we present the observations and data analysis. In Section3, we describe the results, and in Section4, we discuss the properties of the persistent source and its co-localization with the source of the bursts. A discussion of the constraints that these data place on the physical scenarios is also provided. Finally, we present our conclusions in Section 5.
2. Observations and Data Analysis
We have observed FRB121102 using the EVN at 1.7 and 5 GHz central frequencies (with a maximum bandwidth of 128 MHz in both cases) in eight observing sessions that span 2016 February 1 to September 21 (Table1). These observations included the 305 m William E. Gordon Telescope at the Arecibo Observatory (which provides raw sensitivity for high signal-to-noise burst detection) and the following regular EVN stations: Effelsberg, Hartebeesthoek, Lovell Telescope or Mk2 in Jodrell Bank, Medicina, Noto, Onsala, Tianma, Toruń, Westerbork (single dish), and Yebes. Of these antennas, Hartebeesthoek, Noto, Tianma, and Yebes only participated in the single 5 GHz session.
We simultaneously acquired both EVN VLBI data products (buffered baseband data and real-time correlations) as well as wideband, high-time-resolution data from Arecibo as a stand-alone telescope. The Arecibo single-dish data provide poor angular resolution (∼3 arcmin at 1.7 GHz), but unparalleled sensitivity in order to search for faint millisecond bursts. By first detecting bursts in the Arecibo single-dish data, we could then zoom in on specific times in the multi-telescope EVN data set where we could perform high-angular-resolution imaging of the bursts themselves.
2.1. Arecibo Single-dish Data
For the 1.7 GHz observations, Arecibo single-dish observa-tions used the Puerto-Rican Ultimate Pulsar Processing Instrument (PUPPI) in combination with the L-band Wide receiver, which provided ~600 MHz of usable bandwidth between 1150 and 1730 MHz. The PUPPI data were coherently dedispersed to a DM=557 pc cm-3, as previously done by
Scholz et al. (2016). Coherent dedispersion removes the dispersive smearing of the burst width within each spectral channel. The time resolution of the data was 10.24 μs, and we recorded full Stokes parameters. At 5 GHz, the Arecibo single-dish observations were recorded with the Mock Spectrometers Table 1
Properties of the Persistent Radio Source and Detected FRB 121102 Bursts from the Arecibo+EVN Observations
Session Epoch ν Da Dd Sn x
(YYYY Month DD) (GHz) (mas) (mas) (μJy) (Jy ms1/2)
RP024B 2016 Feb 10 1.7 1.5±2 −2±3 200±20 L RP024C 2016 Feb 11 1.7 −4±2 −5±3 175±14 L RP024D 2016 May 24 1.7 1±3 −5±4 220±40 L RP024E 2016 May 25 1.7 1±3 2±4 180±40 L RP026B 2016 Sep 20 1.7 1.9±1.8 −0.4±2.3 168±11 L RP026C 2016 Sep 21 5.0 0.0±0.6 0.0±0.7 123±14 L
(YYYY Month DD hh:mm:ss.sss) (Jy)
Burst #1 2016 Sep 20 09:52:31.634 1.7 −14±3 −1.4±1.8 0.46±0.02 ∼0.8
Burst #2 2016 Sep 20 10:02:44.716 1.7 −3.3±2.5 4.3±1.6 3.72±0.12 ∼5
Burst #3 2016 Sep 20 10:03:29.590 1.7 −10±5 0.8±3 0.22±0.03 ∼0.4
Burst #4 2016 Sep 20 10:50:57.695 1.7 3±6 6±4 0.17±0.03 ∼0.2
Avg. burst pos. 2016 Sep 20 1.7 −5±4 3.5±2.2 L L
Note. All positions are referred to the 5 GHz detection of the persistent source (RP026C epoch):aJ2000=5 31 58. 70159h m s ,dJ2000=33 8 52. 5501 ¢ . The observations
conducted on 2016 February 1 (RP024A) and 2016 September 19 (RP026A) did not produce useful data and are not included here (see the main text). The arrival times of the bursts are UTC topocentric at Arecibo at the top of the observing band (1690.49 MHz). All these bursts had gate widths of 2–3 ms, and the quoted flux densities are averages over these time windows. We note that the larger error on the flux density of burst#2 is due to the fact that the image is dynamic-range limited because of the burstʼs brightness. The last row shows the average position obtained from the four bursts weighted by the detection statisticx =F w (fluence divided by the square root of the burst width).
in combination with the C-band receiver, which together provided spectral coverage from 4484 to 5554 MHz. The Mock data were recorded in seven partially overlapping subbands of 172 MHz, with 5.376 MHz channels and 65.476 μs time resolution. In addition to the PUPPI and Mock data, the autocorrelations of the Arecibo data from the VLBI recording were also available (these are restricted to only 64 MHz of bandwidth; see below).
The Arecibo single-dish data were analyzed using tools from the PRESTO21 suite of pulsar software (Ransom 2001) and searched for bursts using standard procedures (e.g., Scholz et al. 2016). The data were first subbanded to 8´ lower time and frequency resolution and were then dedispersed using prepsubband to trial DMs between 487 and 627 pc cm−3in order to search for pulses that peak in signal-to-noise ratio (S/N) at the expected DM of FRB121102. This is required to separate astrophysical bursts from radio frequency interference (RFI). For each candidate burst found using single_pulse_search.py (and grouping common events across DM trials), the astrophysical nature was confirmed by producing a frequency versus time diagram to show that the signal is (relatively) broadband compared to the narrowband RFI signals that can sometimes masquerade as dispersed pulses.
2.2. Arecibo+EVN Interferometric Data
EVN data were acquired in real time using the e-EVN setup, in which the data are transferred to the central processing center at JIVE via high-speed fiber networks and correlated using the SFXC software correlator. The high data rate of VLBI observations requires visibilities to be typically averaged to 2 s intervals during correlation, which is sufficient to study persistent compact sources near the correlation phase center, like the persistent radio counterpart to FRB121102. However, we also buffered the baseband EVN data to produce high-time-resolution correlations afterward for specific times when bursts have been identified in the Arecibo single-dish data.
We used J0529+3209 as phase calibrator in all sessions (1°.1 away from FRB121102). In the first five sessions (conducted in February and May), we scheduled phase-referencing cycles of 8 minutes on the target and 1 minute on the phase calibrator. Whereas this setup maximized the on-source time for burst searches, it provided less accurate astrometry due to poorer phase solutions. The pulsar B0525+21 was also observed in one of these sessions following the same strategy (phase referenced using J0521+2112), in order to perform an empirical analysis of the derived astrometry in interferometric single-burst imaging. In the following three sessions in September, however, we conducted 5 minute cycles with 3.5 minutes on the target and 1.5 minutes on the phase calibrator, improving the phase referencing, and hence providing more accurate astrometry. Two sessions failed to produce useful calibrated data on the faint target and are not listed in Table1. The first session (2016 February 1) was used to explore different calibration approaches, whereas the 2016 September 19 session was unusable because the largest EVN stations were unavailable and the data could not be properly calibrated without them. An extragalactic ∼2mJy compact source (VLA2 in Kulkarni et al. 2015) was identified in the same primary beam as FRB121102 (with coordinatesaJ2000=
5 31 53. 92244,h m s 33 10 20. 0739
J2000
d = ¢ ). This source has
been used to acquire relative astrometry of FRB121102 during all the sessions and to provide a proper motion constraint.
The 2 s integrated data were calibrated using standard VLBI procedures within AIPS22 and ParselTongue (Kettenis et al.
2006), including a priori amplitude calibration using system temperatures and gain curves for each antenna, antenna-based delay correction, and bandpass calibration. The phases were corrected by fringe-fitting the calibrators. The phase calibrator J0529+3209 was then imaged and self-calibrated using the Caltech Difmap package (Shepherd et al. 1994). These corrections were interpolated and applied to FRB121102, which was finally imaged in Difmap.
The arrival times of the bursts were first identified using Arecibo single-dish data and then slightly refined for applica-tion to the EVN data. First using coherently dedispersed Arecibo autocorrelations from the EVN data, we performed a so-called gate search by creating a large number of short integrations inside a 50 ms window around the nominal Arecibo single-dish arrival times. A pulse profile was then created for each of the bursts by plotting the total power in the cross-correlations as a function of time. We then used this pulse profile to determine the exact time window for which the correlation function was accumulated, i.e., the “gate.” We dedispersed and correlated the EVN data to produce visibilities for windows covering only the times of detected bursts. We applied the previously described calibration to the single-pulse data and imaged them. The final images were produced using a Briggs robust weighting of zero (Briggs1995)as it produced the most consistent results (balance between the longest baselines to Arecibo and the shorter, intra-European baselines). Images with natural or uniform weighting did not produce satisfactory results due to the sparse uv-coverage. The flux densities and positions for all data sets were measured using Difmap and CASA23by fitting a circular Gaussian component to the detected source in the uv-plane.
3. Results
3.1. Burst Detections
The EVN observations detect the compact and persistent source found by Chatterjee et al. (2017) with a synthesized beam size (FWHM) of »21 mas´2 mas at 1.7 GHz and
4 mas 1 mas
» ´ at 5 GHz, with position angle »- in55
both cases.
On 2016 September 20, we detected four individual bursts in the Arecibo single-dish PUPPI data that overlap with EVN data acquisition (Table1). No bursts were detected in the Arecibo PUPPI (1.7 GHz) or Mock (5 GHz) data from other sessions in which there are simultaneous EVN observations that can be used for imaging the bursts. We formed images from the calibrated visibility data for each burst and measured their positions with respect to the persistent radio source. Figure1
shows these positions together with the persistent source at 1.7 and 5.0 GHz. The nominal positions measured for the four bursts are spread15 masaround the position of the persistent source, and we discuss this scatter in Section3.2.
21
Available athttps://github.com/scottransom/presto.
22
The Astronomical Image Processing System (AIPS) is a software package produced and maintained by the National Radio Astronomy Observa-tory (NRAO).
23
The Common Astronomy Software Applications (CASA) is software produced and maintained by the NRAO.
Figures 2 and 3 show data corresponding to the strongest burst (burst#2)—in the time domain and in the image plane, respectively. We have characterized the bursts using the detection statistic x =F w (fluence divided by the square root of the burst width; e.g., Cordes & McLaughlin2003; Trott et al. 2013). When matched filtering is done to detect a pulse (as we have done, starting with the single-dish PUPPI data), then the S/N of the detection statistic, i.e., the output of the correlation, is proportional to ξ. Localization of the source in an image (whether in the image or in the uv-domain) will tend to have the same scaling if the uv-data are calculated with a tight gate (time window) around the pulse so that it also scales as w. Using only fluence as a detection statistic is not appropriate because a high-fluence, very wide burst can still be buried in the noise, whereas a narrower burst with equivalent fluence is more easily discriminated from noise. Burst#2 was roughly an order of magnitude brighter than the other three bursts and shows a detection statistic ξ that is also a factor of> higher6 than the other bursts. This brightest burst is separated by only
7 mas
~ from the centroid of the persistent source at the same epoch and is positionally consistent at the ∼2σ level. We thus find no convincing evidence that there is a significant offset between the source of the bursts and the persistent source. Since burst#2ʼs detection statistic, ξ, is significantly larger than for any of the other three bursts, its apparent position is least affected by noise in the image plane, as we explain in the following section, Section3.2. As such, in principle, it provides the most accurate position of all four detected bursts and the strongest constraint on the maximum offset between bursts and the compact, persistent radio source.
3.2. Astrometric Accuracy
The astrometric accuracy of full-track (horizon-to-horizon observations) EVN phase-referencing is usually limited by systematic errors due to the poorly modeled troposphere, ionosphere, and other factors. These errors are less than a milliarcsecond in ideal cases (Pradel et al.2006), but in practice they can be a few milliarcseconds. Given the short duration of the bursts (a few milliseconds), our interferometric EVN data only contain a limited number of visibilities for each burst, which results in a limited uv-coverage and thus very strong, nearly equal-power sidelobes in the image plane (see Figure3, bottom panel). In this case, we are no longer limited only by the low-level systematics described above. The errors in the visibilities, either systematic or due to thermal noise, may lead to large and non-Gaussian uncertainties in the position, especially for low S/N, because the response function has many sidelobes. It is not straightforward to derive the astrometric errors for data with just a few-milliseconds integration. Therefore, we conducted the following procedure to verify the validity of the observed positions and to estimate the errors.
First, we independently estimated the approximate position of the strongest burst by fringe-fitting the burst data and using Figure 1. EVN image of the persistent source at 1.7 GHz (white contours)
together with the localization of the strongest burst (red cross), the other three observed bursts (gray crosses), and the position obtained after averaging all four bursts detected on 2016 September 20 (black cross). Contours start at a 2σ noise level of 10μJy and increase by factors of 21 2. Dashed contours represent
negative levels. The color scale shows the image at 5.0 GHz from 2016 September 21. The synthesized beam at 5.0 GHz is represented by the gray ellipse at the bottom left of the figure and for 1.7 GHz at the bottom right. The lengths of the crosses represent the 1σ uncertainty in each direction. Crosses for each individual burst reflect only the statistical errors derived from their S/N and the beam size. The size of the cross for the mean position is determined from the spread of the individual burst locations, weighted by ξ (see the text), and is consistent with the centroid of the persistent source to within< .2s
Figure 2. Top: dynamic spectrum of the strongest burst detected on 2016 September 20 (burst #2 in Table1)from Arecibo autocorrelations, showing the dispersive sweep across the observing band. Bottom: coherently dedispersed and band-integrated profiles of the same burst as observed in the cross-correlations for Arecibo–Effelsberg (Ar-Ef), Arecibo–Medicina (Ar-Mc), and Effelsberg–Onsala (Ef-O8) after only applying a priori calibration. The measured peak brightnesses are 11.9, 10.7, and 10.9 Jy, respectively, where the error is typically 10%–20% for a priori calibration. The rms on each baseline is 12, 80, and 300 mJy, respectively.
only the residual delays (delay mapping; Y. Huang et al. 2017, in preparation). With this method we have obtained an approximate position of aJ2000=5 31 58. 698h m s (-+0.0060.004),dJ2000=
33 8 52. 586 ¢ (-+0.0440.040), where the quoted errors are at the 3σ
level. This method provides additional confidence that the image-plane detection of the bursts is genuine, since the positions obtained with the two methods are consistent at the 3σ level.
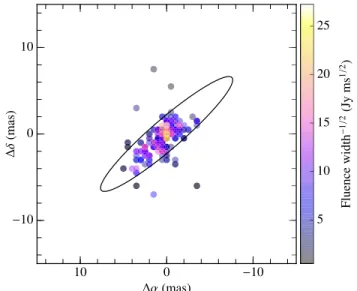
Next, we carried out an empirical analysis of single-burst EVN astrometry by imaging 406 pulses recorded from the pulsar B0525+21, which was used as a test source in the 2016 February 11 session. PSRB0525+21 has typical pulse widths of roughly 200ms and peak flux densities of ∼70–900 mJy. This corresponds to a range of measured detection statistics
0.5
x ~ –27Jyms1/2, compared to the range x ~0.2– 5Jyms1/2measured for the four detected FRB121102 bursts. Figure 4 shows the obtained positions for the different PSRB0525+21 pulses along with the synthesized beam FWHM for comparison. This demonstrates that the positional accuracy of the bursts increases for larger ξ. It shows that pulses withx5Jyms1/2are typically offset by less than the beam FWHM, whereas forx ~0.5–1Jyms1/2the scatter can be closer to 10mas. This matches well with what we have observed in the four detected FRB121102 bursts (Table 1; Figure1).
While burst#2 is thus expected to provide the most accurate position, a more conservative way to estimate the positional error on the burst source is to consider the scatter in all four
detections, which is ∼10mas around the average position. In Figure1, we show the average position from the four observed bursts, weighted by their detection statistic ξ (Table 1). This average position (separated ~8 mas with respect to the persistent source) shows that the average burst position and the persistent source position are coincident within 2s. We therefore claim no significant positional offset between the persistent radio source and the source of the FRB121102 bursts.
Finally, we place limits on the angular separation between the source of the bursts and the persistent radio source by sampling from Gaussian distributions with centers and widths given by the source positions and uncertainties listed in Table1
and deriving a numerical distribution of offsets. Using the average burst position compared to that of the persistent source, this results in a separation of 12 mas (40 pc) at the 95% confidence level (or 50 pc at 99.5% confidence level). Although the positional uncertainties on individual bursts are likely underestimated and non-Gaussian, as discussed pre-viously, the effect of this should be mitigated somewhat by using the average burst position, which includes an uncertainty determined by the scatter in the separate burst detections, as also seen in Figure 4 for B0525+21. We note that nearly identical separation limits are obtained if we consider instead the position of only the strongest burst, burst#2.
3.3. Measured Properties
Fitting the uv-plane data with a circular Gaussian component shows that both the bursts and persistent radio source appear to be slightly extended. We measure a source size of~ 2 1 mas at 1.7 GHz in the detected bursts in the uv-plane. In the persistent source, we measure a similar value of 2–4 mas at 1.7 GHz in all sessions, whereas at 5.0 GHz we measure an angular size of ∼0.2–0.4 mas. Measurements in the image plane (after deconvolving the synthesized beam) result in similar values. The measured source sizes for the persistent source are consistent with the ones obtained in Chatterjee et al. (2017).
Figure 3. Top: amplitudes and phases of the obtained visibilities for the strongest burst observed on 2016 September 20 (burst #2 in Table1)as a function of the uv-distance. Bottom: dirty (left) and cleaned (right) image for the same burst. The cleaned image has been obtained by fitting the uv-data with a circular Gaussian component. The synthesized beam is shown by the gray ellipse at the bottom right of the figure. The coordinates are relative to the position of the persistent source obtained in the same epoch.
Figure 4. Pulse localizations from the pulsar B0525+21 observed on 2016 February 11 at 1.7 GHz. A total of 406 pulses were imaged. Systematic uncertainties inversely proportional to the detection statistic ξ are observed. We note that only pulses withx5Jyms1/2are robustly localized to within the FWHM, and for pulses withx ~0.5–1Jyms1/2the scatter can be closer to 10mas.
Notably, burst#2 shows two pulse components, separated by approximately 1ms (Figure2). Complex profile structure is commonly seen in the brightest FRB121102 bursts observed to date, many of which show two or more pulse components (Spitler et al.2016; J. W. T. Hessels et al. 2017, in preparation). Furthermore, as can be seen in the dynamic spectrum of the burst, there is fine-scale frequency structure (∼MHz) in the intensity, which in principle could be due to scintillation or self-noise. This will be investigated in more detail in a forthcoming paper.
The different epochs at which the persistent radio source was observed allow us to obtain the light curve of the compact source. Figure5shows the flux densities measured for the five sessions at 1.7 GHz, which are compatible with an average flux density of S1.7=17718mJy. The only session at 5.0 GHz
shows a compact source with a flux density of
S5=12314mJy. Assuming that the source exhibited a similar flux density at 1.7 GHz compared with the day before, we infer a two-point spectral indexa = -0.270.24, where
Snµna, for the source. Table 1 summarizes the obtained
results.
4. Discussion
Chatterjee et al. (2017)have shown that the persistent radio source is associated with an optical counterpart, which Tendulkar et al. (2017)show is a low-metallicity, star-forming
dwarf galaxy at a redshift of z=0.192730.00008. In the following, we use the luminosity and angular diameter distance of DL »972 Mpc and DA»683 Mpc, respectively,
deter-mined by Tendulkar et al. (2017). We show that the VLBI data alone provide further support to the extragalactic origin of both radio sources. Furthermore, we argue that the bursts and the persistent radio source must be physically related because of their close proximity to each other. We assume such a direct physical link in the following discussion.
4.1. Persistent Source and Burst Properties
The results from all the EVN observations conducted at 1.7 GHz show a compact source with a persistent emission of
180 mJy
~ , which is consistent with the flux densities inferred at ~100´ larger angular scales with the VLA (Chatterjee et al. 2017). No significant, short-term changes in the flux density are observed after the arrival of the bursts or otherwise (Figure 5). The average flux density of the persistent source implies a radio luminosity of L1.7» ´3 1038erg s-1. The single measured flux density at 5.0 GHz corresponds to a similar luminosity of L5.0» ´7 1038erg s-1 ( Ln n, with a bandwidth of 128 MHz at both frequencies). Additionally, the 5.0 GHz data allow us to set a constraint on the brightness temperature of the persistent source of Tb ´5 10 K7 . Considering the measured radio luminosities and the current 5σ X-ray upper limit in the 0.5–10keV band of 5 ´10-15erg s-1cm-2(Chatterjee et al.2017; which implies
LX< ´5 1041erg s-1), we infer a ratio between the 5.0 GHz radio and X-ray luminosities of logRX> -2.4, where
RX=nLn(5 GHz) LX( –2 10 keV) as defined by Terashima & Wilson (2003). The strongest observed burst exhibits a luminosity of ~ ´6 1042 erg s-1 at 1.7 GHz in the 2 ms
integrated data. These values imply an energy of 1040 4p erg
~ (DW ) , whereDW is the emission solid angle. With the EVN sessions spanning a period of approximately 7 months, we derived a constraint on the proper motion of the persistent source of -6.4<m <1.4 mas yr 1
a - and
2.8 m 6.2 mas yr 1
- < d< - at a 3σ confidence level. These
values have been obtained after removing the offsets measured in the in-beam calibrator source (VLA2; see Section2). Since most of our short observations were not ideal for astrometry, this is a preliminary result, to be further improved on by follow-up observations, which will also have the advantage of spanning a longer period of time. Nonetheless, these results already rule out the presence of parallax 3 mas at a 3σ confidence level, setting a distance for the persistent source 0.3 kpc.
The compactness of the source at 5.0 GHz allows us to set an upper limit on its projected physical size of 0.7 pc (1.4´10 au5 , given the distance of the source). The angular
size measured for the source at 1.7 and 5.0 GHz (∼2 and ∼0.2 mas, respectively) is consistent with the angular broad-ening expected in the direction to FRB121102 for extra-galactic sources due to local scattering (multi-path propagation) of the signal by the intervening Galactic material between the source and the observer (predicted by the NE2001 model to be
2 mas
~ at 1.7 GHz; Cordes & Lazio 2002). Angular broad-ening scales as µn-2, and thus we would expect a size of
0.4 mas
~ at 5.0 GHz, also roughly consistent with the measured value at that frequency.
The obtained angular sizes are thus likely to be produced by angular broadening and not by the fact that we are resolving the Figure 5. Top: light curve of the persistent source at 1.7 GHz during all the
EVN epochs. The horizontal line represents the average flux density value and its 1σ standard deviation. Bottom: light curve of the source within the 2016 September 20 epoch (last epoch in the top figure). The vertical red lines represent the arrival times of the four detected bursts. We do not detect brightening of the persistent source on these timescales after the bursts.
source. The angular broadening measured in the bursts (∼2 mas) supports this statement as this broadening must be produced extrinsically to the bursts, given that their millisecond duration implies that the emitting region must be smaller than the light-crossing time, i.e.,1000 km, and thus must appear to be point-like. A caveat here is that the measured source size depends strongly on the gain of the telescope providing the longest baselines (Natarajan et al.2017), in our case Arecibo at 1.7 GHz. We exclude the possibility that the Arecibo baselines have a lower amplitude (due to a large gain error), because the measured persistent source size agrees with that obtained with the VLBA independently (Chatterjee et al. 2017). At 5.0 GHz the presence of three telescopes with similar baseline lengths (Arecibo, Hartebeesthoek, and Tianma) also assures the consistency of the measured source size.
The intrinsic source size of the persistent source could be as small as 7 asm n1-5 4, the limit implied by synchrotron self-absorption for a frequency of optical depth unityn ~1 1 GHz (Harris et al. 1970). Or if Tb1012 K by synchrotron self-Compton radiation, the size is m n20 as -1. These angles are
too small to resolve with VLBI but could be probed with interstellar scintillations.
We have constrained the projected separation between the source of the bursts and the persistent radio source to be 40 pc. Such a close proximity strongly suggests that there is a direct physical link between the bursts and the persistent source, as we now discuss in more detail.
4.2. Possible Origins of FRB121102
The data presented here, in addition to the results presented by Chatterjee et al. (2017)and Tendulkar et al. (2017), allow us to constrain the possible physical scenarios for the origin of FRB121102. While the fact that the bursts are located within
40 pc
of the persistent radio source strongly suggests a direct physical link, the persistent radio source and the source of the FRB121102 bursts do not necessarily have to be the same object. We primarily consider two classes of models that could explain FRB121102 and its multiwavelength counterparts: a highly energetic, extragalactic neutron star in a young super-nova remnant (SNR) or an AGN (or analogously a black hole related system with a jet).
4.2.1. Young Neutron Star and Nebula
As previously shown by Spitler et al. (2016), the repeat-ability of FRB121102 rules out an origin in a cataclysmic event that destroyed the progenitor source, e.g., the collapse of a supramassive neutron star (Falcke & Rezzolla 2014). The repetition and energetics of the bursts from FRB 121102 have been used to argue that it comes from a young neutron star or magnetar (Cordes & Wasserman 2016; Lyutikov et al. 2016; Popov & Pshirkov 2016). At birth, the rapid spin of such (potentially highly magnetized) objects can power a luminous nebula from the region evacuated by its SNR.
The measured luminosity for the persistent radio source cannot be explained by a single SNR or a pulsar wind nebula similar to those discovered thus far in our Galaxy. A direct comparison with one of the brightest SNRs known, CasA (300 years old; Baars et al.1977; Reed et al.1995), shows that we would expect an emission which is ∼4 orders of magnitude fainter at the given distance of DL »972 Mpc. In the case of the Crab Nebula, the expected flux density would be even
fainter ( 0.5 nJy~ )if placed in the host galaxy of FRB121102. Compact star-forming regions, such as seen in Arp220, have collections of SNRs that have a luminosity and Tb consistent
with the persistent radio source. However, neither the SFR of
M
240 1000 yr 1
~ – - nor the size of the region of 250–360 pc
of Arp220 (Anantharamaiah et al. 2000) agrees with the properties of the persistent source associated with FRB121102 (0.4M yr-1
and0.7 pc).
Murase et al. (2016)and Piro (2016)discuss the properties of a young ( 1000 years< )SNR that is powered by the spin-down power of a neutron star or white dwarf. The SNR expands into the surrounding medium and evacuates an ionized region that can be seen as a luminous synchrotron nebula. This model is also constrained by the observation that radio bursts of FRB121102 are not absorbed by the nebula and that its DM has not evolved significantly over the last few years. Considering all these effects, in this scenario, FRB121102 is likely to be between 100 and 1000 years old, and the persistent radio source is powered by the spin down of a rapidly rotating pulsar or magnetar. In this case, the previously shown persistent radio source variability (Chatterjee et al.2017; where the higher cadence of observations allowed variability to be studied in more detail) could be induced by scintillation, which is consistent with the compact (sub-milliarcsecond) SNR size at this age. Lunnan et al. (2014)and Perley et al. (2016)show that superluminous supernovae (SLSNe) are typically hosted by low-metallicity, low-mass galaxies and are possibly powered by millisecond magnetars. Additionally, it is shown that SLSNe and long gamma-ray bursts could share similar environments. We note that these conditions are in agreement with the optical galaxy associated with FRB121102 (Tendulkar et al.2017).
4.2.2. AGN/Accreting Black Hole
Models have been proposed in which the bursts are due to strong plasma turbulence excited by the relativistic jet of an AGN (Romero et al.2016)or due to synchrotron maser activity from an AGN (Ghisellini2017). It is also conceivable to have an extremely young and energetic pulsar and/or magnetar near to an AGN (Pen & Connor2015; Cordes & Wasserman2016) —either interacting or not.
The persistent radio source is offset by ∼0.2 arcsec (0.7 kpc) from the apparent center of the optical emission of the dwarf galaxy (Tendulkar et al.2017). Therefore, it is not completely clear whether the radio source can be associated with the galactic nucleus or not, but an offset AGN is plausible as reported in other galaxies (Barth et al.2008). If the persistent source is indeed an AGN in the right accretion state, we can infer the mass of the black hole assuming the Fundamental Plane of black hole activity (Merloni et al. 2003; Falcke et al. 2004; Körding et al. 2006; Miller-Jones et al. 2012; Plotkin et al.2012). Given the measured radio luminosity and the upper limit on the X-ray value, we estimate a lower limit on the mass of the putative black hole of ´2 109M
. This value
would be hard to reconcile with the fact that the stellar mass of the host galaxy is likely at least an order of magnitude less than that, and its optical spectrum shows no signatures of AGN activity (Tendulkar et al.2017).
Alternatively, we could be witnessing a radio-loud, but otherwise low-luminosity, AGN powered by a much less massive black hole that accretes at a very low rate. This population is poorly known, but EVN observations of the brightest low-luminosity AGNs (LLAGNs) in a sample of
Fundamental Plane outliers (i.e., radio-loud, with RX~ - )2 show that some of these have extended jets/lobes and the radio excess may come from strong interaction with the surrounding gas in the galaxy; others appear very compact like our persistent radio source, and the reason for their high RX
remains a mystery (Paragi et al.2012). We note that there are other recent examples of LLAGNs identified based on their VLBI properties coupled with low levels of X-ray emission and no signs of nuclear activity from the optical emission lines (Park et al.2016).
Other possible associations, like a single X-ray binary (such as CygX-3; Merloni et al. 2003; Reines et al. 2011) or an ultraluminous X-ray nebula (such as S26 and/or IC342X-1; Soria et al. 2010; Cseh et al.2012), do not fit to the measured flux density of the persistent radio emission and/or the observed size by several orders of magnitude.
5. Conclusions
The bursts of FRB121102 have recently been associated with a persistent and compact radio source (Chatterjee et al. 2017) and a low-metallicity star-forming dwarf galaxy at a redshift of z=0.192730.00008 (Tendulkar et al.
2017). The EVN data presented in this work show for the first time that the bursts and the persistent source are co-located with an angular separation12 mas(40 pcgiven the distance to the host galaxy). This tight constraint—roughly an order of magnitude more precise localization compared to that achieved with the VLA in Chatterjee et al. (2017)—strongly suggests a direct physical link, though the persistent radio source and the source of the FRB121102 bursts do not necessarily have to be the same object. Although the origin of FRBs remains unknown, the data presented here are consistent in many respects with either an interpretation in terms of a low-luminosity AGN or a young SNR powered by a highly energetic neutron star/magnetar.
We thank the directors and staff of all the EVN telescopes for making this series of target of opportunity observations possible. We thank the entire staff of the Arecibo Observatory, and in particular A.Venkataraman, H.Hernandez, P.Perillat, and J.Schmelz, for their continued support and dedication to enabling observations like those presented here. We thank B.Stappers and M.Mickaliger for their support with simulta-neous pulsar recording using the Lovell Telescope. We thank E.Adams, K.Kashiyama, N.Maddox, and E.Quataert for useful discussions on plausible scenarios as well as O.Wuck-nitz and A.Deller for reviewing a draft of the Letter. We thank F.Camilo for access to computing resources. The Arecibo Observatory is operated by SRI International under a cooperative agreement with the National Science Foundation (AST-1100968), and in alliance with Ana G.Méndez-Uni-versidad Metropolitana, and the Universities Space Research Association. The European VLBI Network is a joint facility of independent European, African, Asian, and North American radio astronomy institutes. Scientific results from data presented in this publication are derived from the following EVN project codes: RP024 and RP026 (PI: J.Hessels). This research made use of Astropy, a community-developed core Python package for Astronomy (Astropy Collaboration et al. 2013) and APLpy, an open-source plotting package for Python hosted athttp://aplpy.github.com. B.M. acknowledges support by the Spanish Ministerio de Economía y
Competitividad (MINECO) under grants AYA2013-47447-C3-1-P, AYA2016-76012-AYA2013-47447-C3-1-P, and MDM-2014-0369 of ICCUB (Unidad de Excelencia “María de Maeztu”). J.W.T.H. is an NWO Vidi Fellow. J.W.T.H. and C.G.B. gratefully acknowledge funding from the European Research Council under the European Unionʼs Seventh Framework Programme (FP/2007-2013)/ERC Grant Agreement No. 337062 (DRAG-NET). Y.H. would like to acknowledge the support of the ASTRON/JIVE International Summer Student Programme. ASTRON is an institute of the Netherlands Organisation for Scientific Research (NWO). The Joint Institute for VLBI ERIC, is a European entity established by 6 countries and funded by 10 agencies to support the use of the European VLBI Network. S.C., J.M.C., P.D., M.A.M., and S.M.R. are partially supported by the NANOGrav Physics Frontiers Center (NSF award 1430284). Work at Cornell (J.M.C., S.C.) was supported by NSF grants AST-1104617 and AST-1008213. M.A.M. is supported by NSF award #1458952. L.G.S. gratefully acknowledges financial support by the European Research Council for the ERC Starting Grant BEACON under contract No. 279702, and the Max Planck Society. V.M.K. holds the Lorne Trottier Chair in Astrophysics and Cosmology and a Canadian Research Chair in Observational Astrophysics and received additional support from NSERC via a Discovery Grant and Accelerator Supplement, by FQRNT via the Centre de Recherche Astrophysique de Québec, and by the Canadian Institute for Advanced Research. S.B.-S. is a Jansky Fellow of the National Radio Astronomy Observatory. Part of the research was carried out at the Jet Propulsion Laboratory, California Institute of Technology, under a contract with the National Aeronautics and Space Administration. P.S. is a Covington Fellow at the Dominion Radio Astrophysical Observatory. S.P.T. acknowledges support from a McGill Astrophysics postdoctoral fellowship.
Facilities:EVN, Arecibo Observatory.
Software: AIPS, Difmap, ParselTongue, CASA, Astropy, APLpy, PRESTO.
References
Anantharamaiah, K. R., Viallefond, F., Mohan, N. R., Goss, W. M., & Zhao, J. H. 2000,ApJ,537, 613
Astropy Collaboration, Robitaille, T. P., Tollerud, E. J., et al. 2013,A&A,
558, A33
Baars, J. W. M., Genzel, R., Pauliny-Toth, I. I. K., & Witzel, A. 1977, A&A,
61, 99
Barth, A. J., Bentz, M. C., Greene, J. E., & Ho, L. C. 2008,ApJL,683, L119
Bassa, C. G., Beswick, R., Tingay, S. J., et al. 2016,MNRAS,463, L36
Briggs, D. S. 1995, BAAS,27, 1444
Chatterjee, S., Law, C. J., Wharton, R. S., et al. 2017, Natur, doi:10.1038/ nature20797
Cordes, J. M., & Lazio, T. J. W. 2002, arXiv:astro-ph/0207156
Cordes, J. M., & McLaughlin, M. A. 2003,ApJ,596, 1142
Cordes, J. M., & Wasserman, I. 2016,MNRAS,457, 232
Cseh, D., Corbel, S., Kaaret, P., et al. 2012,ApJ,749, 17
Falcke, H., Körding, E., & Markoff, S. 2004,A&A,414, 895
Falcke, H., & Rezzolla, L. 2014,A&A,562, A137
Ghisellini, G. 2017,MNRAS,465, L30
Giroletti, M., Marcote, B., Garrett, M. A., et al. 2016,A&A,593, L16
Harris, D. E., Zeissig, G. A., & Lovelace, R. V. 1970, A&A,8, 98
Johnston, S., Keane, E. F., Bhandari, S., et al. 2017,MNRAS,465, 2143
Keane, E. F., Johnston, S., Bhandari, S., et al. 2016,Natur,530, 453
Keimpema, A., Kettenis, M. M., Pogrebenko, S. V., et al. 2015,ExA,39, 259
Kettenis, M., van Langevelde, H. J., Reynolds, C., & Cotton, B. 2006, in ASP Conf. Ser. 351, Astronomical Data Analysis Software and Systems XV, ed. C. Gabriel et al. (San Francisco, CA: ASP),497
Körding, E., Falcke, H., & Corbel, S. 2006,A&A,456, 439
Kulkarni, S. R., Ofek, E. O., & Neill, J. D. 2015, arXiv:1511.09137
Lorimer, D. R., Bailes, M., McLaughlin, M. A., Narkevic, D. J., & Crawford, F. 2007,Sci,318, 777
Lunnan, R., Chornock, R., Berger, E., et al. 2014,ApJ,787, 138
Lyutikov, M., Burzawa, L., & Popov, S. B. 2016,MNRAS,462, 941
Merloni, A., Heinz, S., & di Matteo, T. 2003,MNRAS,345, 1057
Miller-Jones, J. C. A., Wrobel, J. M., Sivakoff, G. R., et al. 2012, ApJL,
755, L1
Murase, K., Kashiyama, K., & Mészáros, P. 2016,MNRAS,461, 1498
Natarajan, I., Paragi, Z., Zwart, J., et al. 2017,MNRAS,464, 4306
Paragi, Z. 2016, arXiv:1612.00508
Paragi, Z., Shen, Z. Q., de Gasperin, F., et al. 2012, in 11th European VLBI Network (EVN) Symposium and the EVN Users Meeting, ed. P. Charlot, G. Bourda, & A. Collioud (Trieste: SISSA),8
Park, S., Yang, J., Oonk, J. B. R., & Paragi, Z. 2016, MNRAS, in press (arXiv:1611.05986)
Pen, U.-L., & Connor, L. 2015,ApJ,807, 179
Perley, D. A., Quimby, R. M., Yan, L., et al. 2016,ApJ,830, 13
Petroff, E., Barr, E. D., Jameson, A., et al. 2016,PASA,33, e045
Piro, A. L. 2016,ApJL,824, L32
Plotkin, R. M., Markoff, S., Kelly, B. C., Körding, E., & Anderson, S. F. 2012, MNRAS,419, 267
Popov, S. B., & Pshirkov, M. S. 2016,MNRAS,462, L16
Pradel, N., Charlot, P., & Lestrade, J.-F. 2006,A&A,452, 1099
Ransom, S. M. 2001, PhD thesis, Harvard Univ.
Reed, J. E., Hester, J. J., Fabian, A. C., & Winkler, P. F. 1995,ApJ, 440, 706
Reines, A. E., Sivakoff, G. R., Johnson, K. E., & Brogan, C. L. 2011,Natur,
470, 66
Romero, G. E., del Valle, M. V., & Vieyro, F. L. 2016, PhRvD, 93, 023001
Scholz, P., Spitler, L. G., Hessels, J. W. T., et al. 2016,ApJ,883, 177
Shepherd, M. C., Pearson, T. J., & Taylor, G. B. 1994, BAAS,26, 987
Soria, R., Pakull, M. W., Broderick, J. W., Corbel, S., & Motch, C. 2010, MNRAS,409, 541
Spitler, L. G., Cordes, J. M., Hessels, J. W. T., et al. 2014, ApJ, 790, 101
Spitler, L. G., Scholz, P., Hessels, J. W. T., et al. 2016,Natur,531, 202
Tendulkar, S. P., Bassa, C. G., Chatterjee, S., et al. 2017,APJL, 834, L7 Terashima, Y., & Wilson, A. S. 2003,ApJ,583, 145
Thornton, D., Stappers, B., Bailes, M., et al. 2013,Sci,341, 53
Trott, C. M., Tingay, S. J., Wayth, R. B., et al. 2013,ApJ,767, 4