HAL Id: cea-02491654
https://hal-cea.archives-ouvertes.fr/cea-02491654
Submitted on 26 Feb 2020
HAL is a multi-disciplinary open access
archive for the deposit and dissemination of
sci-entific research documents, whether they are
pub-lished or not. The documents may come from
teaching and research institutions in France or
abroad, or from public or private research centers.
L’archive ouverte pluridisciplinaire HAL, est
destinée au dépôt et à la diffusion de documents
scientifiques de niveau recherche, publiés ou non,
émanant des établissements d’enseignement et de
recherche français ou étrangers, des laboratoires
publics ou privés.
Wear induced by stochastic sliding impacts
T. Souilliart, E. Rigaud, A. Le Bot, C. Phalippou
To cite this version:
T. Souilliart, E. Rigaud, A. Le Bot, C. Phalippou. Wear induced by stochastic sliding impacts. ASME
2015 Pressure Vessels and Piping Conference, Jul 2015, Boston, United States.
�10.1115/PVP2015-45811�. �cea-02491654�
WEAR INDUCED BY STOCHASTIC SLIDING IMPACTS
Thibaut Souilliart
Laboratoire de Tribologie et Dynamique des Systèmes, UMR CNRS 5513, Ecole Centrale de Lyon, Université de Lyon,
36, avenue Guy de Collongue, F-69134 Ecully, France
Commissariat à l'Energie Atomique et aux Energies Alternatives CEA-Saclay, DEN, DM2S, SEMT, DYN, F-91191 Gif-sur-Yvette, France.
Emmanuel Rigaud
Laboratoire de Tribologie et Dynamique des Systèmes, UMR
CNRS 5513, Ecole Centrale de Lyon, Université de Lyon, 36, avenue Guy de Collongue,
F-69134 Ecully, France
Alain Le Bot
Laboratoire de Tribologie et Dynamique des Systèmes, UMR
CNRS 5513, Ecole Centrale de Lyon, Université de Lyon, 36, avenue Guy de Collongue,
F-69134 Ecully, France
Christian Phalippou
Commissariat à l'Energie Atomique et aux Energies Alternatives CEA-Saclay, DEN,
DM2S, SEMT, DYN, F-91191 Gif-sur-Yvette, France.
ABSTRACT
Vibrations of the steam generator tubes in nuclear power plants induce stochastic impacts between the tubes and their supports. As a consequence, wear is generated. A test rig is designed and used to perform impacts between two metal crossed cylinders with various incidence angles and impact velocities. The normal and tangential components of the contact load are measured during the tests. Rate and duration of impacts, instantaneous ratio between normal and tangential loads for each impact are deduced. Influence of incidence angle and impact velocity on impact duration, ratio between tangential and normal loads during impact and wear volume is highlighted.
NOMENCLATURE
𝑒𝑒 Restitution coefficient of impact 𝑓𝑓 Excitation frequency
𝑓𝑓0 First natural frequency of impactor
𝑘𝑘 Stiffness of impactor 𝑚𝑚 Impacting mass
𝑡𝑡 Time
𝑡𝑡𝑖𝑖𝑖𝑖𝑖𝑖; 𝑡𝑡������ Duration of impact 𝚤𝚤𝑖𝑖𝑖𝑖
𝐸𝐸∗ Equivalent Young modulus
𝐹𝐹𝑛𝑛 ; 𝐹𝐹�𝑛𝑛 Maximum of the normal component of load
measured during impact
𝐹𝐹𝑡𝑡 ; 𝐹𝐹� 𝑡𝑡 Maximum of the tangential component of
load measured during impact 𝑅𝑅∗ Equivalent radius
𝑇𝑇∗ Normalized shear energy
𝑉𝑉 Impacting velocity 𝑊𝑊𝑖𝑖𝑖𝑖𝑖𝑖 Wear volume per impact
𝑊𝑊𝑡𝑡𝑡𝑡𝑡𝑡 Wear volume for an entire test
𝛼𝛼 ; 𝛼𝛼� Incidence angle of impactor
𝜇𝜇 ; 𝜇𝜇̅ Instantaneous ratio between normal and tangential loads during impact
𝛿𝛿𝑛𝑛 Depth of indentation (approach)
𝛿𝛿𝑡𝑡 Sliding distance
𝜆𝜆 Particle shape coefficient 𝜇𝜇𝑐𝑐 Critical friction coefficient
𝑋𝑋� Average value of X for an entire test
INTRODUCTION
Heat exchangers of Pressurized Water Reactor (PWR) are composed of thousands of tubes supported by baffles and Anti-Vibration Bars (AVB). Functional clearances are needed between tubes and bars because of thermal expansion and assembly purposes. In steam generators, tubes are excited by high flow rates. This excitation could lead to a dynamic response characterized by sliding impacts between tubes and AVB and generate wear [1].
For mechanical systems subjected to sliding impacts, several types of wear exist according to the motions and the bodies involved [2]. Sliding impacting is usually studied as an erosive and percussive process which leads to both surface and volume degradation. Surface degradation can be associated with adhesion [3] (metal transfer due to sheared asperities junctions) and abrasion [4] (cutting of the rubbing surface by hard asperities). Volume degradation is often described as the formation and propagation of subsurface fatigue cracks in the material (delamination) [5,6].
Engel [7–9] develops a model to predict impact wear based on surfaces conformance in terms of wear formation and a strong dependence with shear stress concerning wear evolution during time. Levy [10] proposes a model based on a proportionality with load and sliding distance during impact. Connors [11], Frick [12]
and Hoffman [13] also propose impact wear models derived from Archard equation. The wear law proposed by Lewis includes both a term derived from Engel model and a dependency with sliding distance [14].
Erosion results from the impact of streams of solid particles on a surface and not from the impact of two macroscopic bodies. Nevertheless, asperities which constitute the contact have a size similar to erosive particles and kinetic energy of the solid impactor and an erosive particle have the same order of magnitude. Therefore, erosive models can be relevant to describe wear of macroscopic bodies [15,16].
An experimental work is performed in order to confirm this hypothesis and to highlight influence of test parameters on wear volume. The first section presents the test rig that have been designed and used to generate impacts with various incidence angles and velocities. Load and wear measurement protocols, wear conditions and testing parameters are explained. The second section goes through the obtained impact characteristics in terms of load evolution during impact and generated wear. Experimental results are shown in the third section. Influence of incidence angle and impact velocity on impact duration, ratio between tangential and normal loads during impact and wear volume is highlighted and discussed.
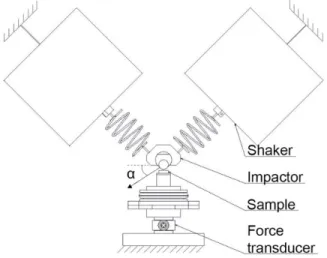
PRINCIPLE OF EXPERIMENT Test rig
The test rig is shown in Figure 1. Two shakers are placed at ±45° to the vertical and excite a hard steel cylinder sample. Two identical springs with the same stiffness (k = 590 N/m) provide the connection between the shaker and the sample holder (m = 0.17 kg). Thus, the natural frequency f0 of the impactor is 9.5 Hz.
The incidence angle α to the horizontal is obtained by setting a specific ratio between the amplitudes of each of the two shakers sinusoidal inputs. Therefore, any test with an incidence angle between 10° and 90° can be performed.
During its motion, the impactor hits a mild steel cylinder sample that is expected to wear. Cylinders are crossed so that a point contact is obtained.
FIGURE 1. TEST RIG.
Test samples
The impactor cylinder (Ø = 7 mm, L = 7 mm) has a Vickers hardness of 820 Hv whereas the target (Ø = 7 mm, L = 7 mm) has a Vickers hardness of 145 Hv. Both have a Young modulus of 200 GPa.
Load measurement protocol and signal processing
The three components of the contact load are measured by a 3-axis piezoelectric load transducer placed behind the sample. Its stiffness is equal to 740 N/µm for the Z component and 170 N/µm for the X and Y components. The mass supported by the load transducer is about 0.1 kg (sample and sample holder), so the measure of the contact load is accurate up to 7 kHz for the tangential components and 14 kHz for the normal component. Signals are acquired with a dynamic signal acquisition card and a high sampling rate of 50 kHz in order to correctly measure the contact load during impact.
A complete acquisition of the contact load during the full length of the test is impossible due to storage space limitations. Therefore, signals are acquired during 1500 evenly distributed acquisition windows of 1 second.
Signals are processed in order to automatically find each impact and retrieve the impact rate, flight and contact durations, normal and tangential components of the contact load during impact. Ratio between maxima of tangential and normal loads µ is then calculated for each impact.
Wear conditions and testing parameters
All tests are performed with the following characteristics. The test duration is 17 h, the excitation frequency f is chosen about 30 Hz and the excitation levels of the shakers are adjusted in order to obtain a maximal normal load during impact of 12 N in average. The Hertz theory applied to an equivalent static contact predicts a maximal contact pressure about 1.5 GPa, a contact diameter of 120 µm and a depth of indentation 𝜹𝜹𝒏𝒏 of 2.1 µm. As the actual contact area is smaller than the apparent one, pressure would be concentrated at the top of surface asperities and could generate local plastic deformation.
Moderate contact loads are applied to focus more on erosive wear than on fatigue or delamination. The set of parameters is chosen to get a substantial amount of wear in a relative short time.
Wear volume analysis
At the end of a test, worn sample is removed from test rig and wear scars are analyzed with an optical interferometer (Figure 2). Negative, positive and natural volumes of wear are then retrieved.
Uncertainty on volume is calculated based on uncertainties of the interferometer measurement and the surface adjustment. Minimal wear volume that can be measured is estimated at 10-3
FIGURE 2. INTERFEROGRAM OF A WEAR SCAR IMPACTS CHARACTERISTICS
Large time scale
Figure 3 shows the time evolution of normal load during 1 s. Impacts are clearly distinguishable as quick variations of the contact load. A free flight period separate two successive main impacts which usually last about 50 ms. Some main impacts are followed by multiple lower amplitude impacts during a short period (about 30 ms). It can be understood as successive rebounds of the impactor that occur after the main impact. The dynamics of the system is highly nonlinear due to impacts. The resulting trajectory may therefore be periodic, aperiodic or even chaotic. In this case, the trajectory is clearly not periodic and therefore the magnitude of impacts is not constant. The impact rate also differs from the excitation frequency for the same reason. During a 17 hours duration test, the total number of impacts typically ranges from 1.8 to 3.7 million that is to say from 30 to 60 impacts per second.
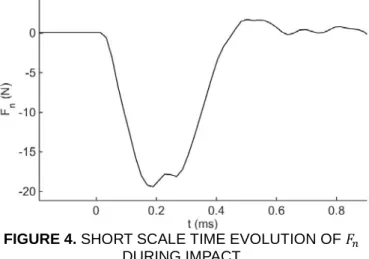
FIGURE 3. LARGE TIME SCALE EVOLUTION OF 𝐹𝐹𝑛𝑛 Short time scale
Figure 4 shows the time evolution of normal load during a single impact. This curve has a bell shape like expected for a typical shock [15]. Contact duration is retrieved from the main peak of normal load and usually ranges from 0.4 to 0.8 ms. The maximal value of load during this particular impact is about
20 N. The free oscillation of the sample is observable after the impact and its frequency is about 2 kHz. The slight perturbation of the bell shape near the maximal value is also due to the influence of this eigenmode. This free response is supposed to have a minimal influence on the value of the maximal load amplitude.
FIGURE 4. SHORT SCALE TIME EVOLUTION OF 𝐹𝐹𝑛𝑛
DURING IMPACT
Wear characteristics
Observed wear scars are typically oval and their shapes give information about the mechanical processes that take place during impacts. Material is either removed as wear debris or displaced by plastic deformation. Thus, positive volumes correspond to displaced material and natural volumes correspond to removed material.
In the following, wear volumes 𝑊𝑊𝑡𝑡𝑡𝑡𝑡𝑡 and 𝑊𝑊𝑖𝑖𝑖𝑖𝑖𝑖 are defined as natural volume and natural volume per impact, that is to say difference between positive and negative measured volumes. In this way, only removed material is taken into account.
EXPERIMENTAL RESULTS AND DISCUSSION Impact duration and 𝝁𝝁�
The observed impact durations range from 0.4 to 0.9 ms and the corresponding load curve is systematically bell-shaped.
Figure 5 shows average impact duration 𝑡𝑡������ versus 𝜇𝜇̅ 𝚤𝚤𝑖𝑖𝑖𝑖 defined as the average of instantaneous ratio between 𝐹𝐹𝑡𝑡 and 𝐹𝐹𝑛𝑛 during a complete test. 𝑡𝑡������ increases with 𝜇𝜇̅, from 0.4 ms for 𝚤𝚤𝑖𝑖𝑖𝑖 normal impacts to 0.9 ms for impacts with a high tangential component. This increase of 𝑡𝑡������ may highlight an increase of 𝚤𝚤𝑖𝑖𝑖𝑖 the sliding distance 𝛿𝛿𝑡𝑡 during contact.
FIGURE 5. IMPACT DURATION VERSUS 𝜇𝜇̅ Instantaneous ratio 𝝁𝝁� and incidence angle
Experiments with various incidence angles are performed. Whereas 𝜇𝜇̅ and 𝛼𝛼� are usually independent, 𝜇𝜇̅ is here observed to be inversely proportional to incidence angle in the explored range (Figure 6). The linear dependence between 𝜇𝜇̅ and 𝛼𝛼� is expressed in equation (1) and is consistent with previous observations [15] under the similar experimental conditions.
𝜇𝜇̅ = −0.02𝛼𝛼� + 1.9 (15° ≤ 𝛼𝛼� ≤ 70°) (1)
FIGURE 6. 𝜇𝜇
�
VERSUS INCIDENCE ANGLEIncidence angle and wear
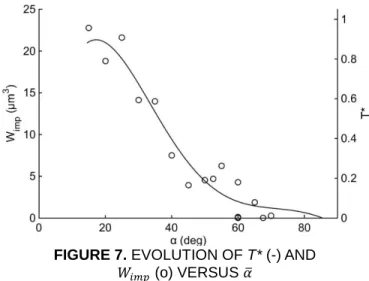
Wear volume is compared with 𝛼𝛼� to make the connection with erosive wear models (Figure 7). Indeed, most of these models relate wear with incidence angle [17–21].
Experimental results show that wear increases as the incidence angle is more and more grazing. These experimental values are compared to the erosive wear model of Brach [20,22] and Sundararajan [21] in which a normalized shear energy 𝑇𝑇∗ is introduced (equations (2) and (3)). In this model, wear volume is assumed to be proportional to this shear energy.
𝑇𝑇∗= 1 (1+𝜆𝜆) 𝜇𝜇� µ𝑐𝑐�2 − 𝜇𝜇� µ𝑐𝑐� cos 2𝛼𝛼� (2) µ𝑐𝑐=(1+𝜆𝜆)(1+𝑒𝑒) tan 𝛼𝛼�1 (3)
𝑇𝑇∗ is defined as a dimensionless energy transferred to target
during an impact. This definition takes two sources of energy dissipation into account: an energy associated with the impactor rebound (through 𝑒𝑒) and an energy associated with friction (through 𝜇𝜇̅ and 𝛼𝛼�). Considering asperities as spherical erosive particles treated as point masses, it is assumed that 𝜆𝜆 = 0. Furthermore, 𝑇𝑇∗ can be expressed only with 𝜇𝜇̅ considering the experimental law between 𝜇𝜇̅ and 𝛼𝛼� (equation 1). 𝜇𝜇̅ is obtained from load measurements during the test. The definition of the restitution coefficient 𝑒𝑒 is chosen as the ratio between rebound velocity and incident velocity. It is measured with a laser vibrometer on several impacts and we obtain in average 𝑒𝑒 = 0.85.
Figure 7 shows a very fine agreement between measured wear volumes per impact and the normalized shear energy as predicted by Brach in the range [15° 70°]. No experimental investigation has been made for incidence angle under 15°.
This result confirms that erosive models can be relevant to describe wear of macroscopic bodies [16].
FIGURE 7. EVOLUTION OF T* (-) AND
𝑊𝑊𝑖𝑖𝑖𝑖𝑖𝑖 (o) VERSUS 𝛼𝛼�
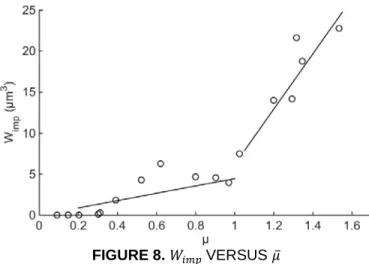
Instantaneous ratio 𝝁𝝁� and wear
Wear is compared with 𝜇𝜇̅ (Figure 8). As 𝜇𝜇̅ and 𝛼𝛼� are found to be related with a nearly linear relation (equation (2)), it is consistent to find that wear increases with 𝜇𝜇̅. It is interesting to note that 𝜇𝜇̅ = 1 seems to be a transitional value between two wear modes. Observed wear for 𝜇𝜇̅ > 1 is much more important than for 𝜇𝜇̅ < 1.
FIGURE 8. 𝑊𝑊𝑖𝑖𝑖𝑖𝑖𝑖VERSUS 𝜇𝜇̅
CONCLUSION
Impact wear between two steel crossed cylinders is studied. Experiments are performed and influence of 𝜇𝜇̅ on impact duration is highlighted as well the linear dependence between 𝜇𝜇̅ and 𝛼𝛼�. The influence of 𝜇𝜇̅ on wear is highlighted and experimental results are compared to an erosive wear model. These results confirm the importance of shear stress on wear formation.
Further work is in progress and aims at adapting the test rig in order to make impacts between real heat exchanger tubes and AVB instead of steel cylinders. In this way, experimental contact geometry and materials will be more consistent with the real ones. Displacement of the impactor will also be measured in order to obtain information about incidence and rebound velocities and angles and about sliding distance during impact.
REFERENCES
[1] Phalippou, C., Herms, E., and Ruffet, F., 2013, “PWR steam generator tube and AVB wear under perpendicular impacting,” Proc. ASME 2013 Press. Vessel. Pip. Conf.
[2] Ko, P., 1987, “Metallic wear—a review with special references to vibration-induced wear in power plant components,” Tribol. Int., 20(2), pp. 66–78.
[3] Bowden, F. P., and Tabor, D., 1954, The Friction and Lubrication of Solids.
[4] Rabinowicz, E., 1965, “Friction and Wear of Materials.”
[5] Suh, P. N., 1973, “The delamination theory of wear,” Wear, 25(1), pp. 111–124.
[6] Rice, S. L., Nowotny, H., and Wayne, S. F., 1981, “Characteristics of metallic subsurface zones in sliding and impact wear,” Wear, 74, pp. 131–142.
[7] Engel, P. A., 1978, Impact Wear of Materials.
[8] Engel, P. A., 1978, “Percussive impact wear: A study of repetitively impacting solid components in engineering,” Tribol. Int., 11(June), pp. 169–176.
[9] Engel, P. A., Lyons, T. H., and Sirico, J. L., 1973, “Impact wear model for steel specimens,” Wear, 23(2), pp. 185–201.
[10] Levy, G., and Morri, J., 1985, “Impact fretting wear in CO2-based environments,” Wear, 106(1-3), pp. 97–138.
[11] Connors, H., 1981, “Flow-induced vibration and wear of steam generator tubes,” Nucl. Technol.
[12] Frick, T. M., 1997, “An empirical wear projection technology with steam generator tube applications and relations to work-rate and wear simulations/tests,” ASME, 2, pp. 275–282.
[13] Hofmann, P., Schettler, T., and Steininger, D. A., 1992, “PWR steam generator tube fretting and fatigue wear phenomena and correlations,” ASME Vib. Noise, 1, pp. 211–236.
[14] Lewis, R., 2007, “A modelling technique for predicting compound impact wear,” Wear, 262(11-12), pp. 1516– 1521.
[15] Rigaud, E., and Le Bot, A., 2013, “Influence of incidence angle on wear induced by sliding impacts,” Wear, 307(1-2), pp. 68–74.
[16] Kaiser, A.-L., Bec, S., Vernot, J.-P., and Langlade, C., 2006, “Wear damage resulting from sliding impact kinematics in pressurized high temperature water: energetical and statistical approaches,” J. Phys. D. Appl. Phys., 39(15), pp. 3193–3199.
[17] Finnie, I., 1960, “Erosion of surfaces by solid particles,” Wear, 3, pp. 87–103.
[18] Bitter, J. G. a., 1963, “A study of erosion phenomena,” Wear, 6, pp. 169–190.
[19] Tilly, G., 1973, “A two stage mechanism of ductile erosion,” Wear, 23(1), pp. 87–96.
[20] Brach, R. M., 1988, “Impact dynamics with applications to solid particle erosion,” Int. J. Impact Eng., 7(1), pp. 37–53.
[21] Sundararajan, G., 1991, “A comprehensive model for the solid particle erosion of ductile materials,” Wear, 149, pp. 111–127.
[22] Brach, R. M., 1993, “Classical planar impact theory and the tip impact of a slender rod,” Int. J. Impact Eng.,