HAL Id: in2p3-00080766
http://hal.in2p3.fr/in2p3-00080766
Submitted on 20 Jun 2006HAL is a multi-disciplinary open access
archive for the deposit and dissemination of sci-entific research documents, whether they are pub-lished or not. The documents may come from teaching and research institutions in France or abroad, or from public or private research centers.
L’archive ouverte pluridisciplinaire HAL, est destinée au dépôt et à la diffusion de documents scientifiques de niveau recherche, publiés ou non, émanant des établissements d’enseignement et de recherche français ou étrangers, des laboratoires publics ou privés.
based on solenoid focusing decay straights
F. Méot, G. Rees
To cite this version:
F. Méot, G. Rees. NuFact muon storage ring : study of a triangle design based on solenoid focusing decay straights. 2006, pp.1-18. �in2p3-00080766�
NuFact muon storage ring : study of a triangle design based on solenoid
focusing decay straights
F. M´eot
∗and G. Rees
†June 20, 2006
Abstract
Properties of acceptance and beam transmission in a triangle design of the neutrino factory muon decay ring, with decay straights based on solenoidal focusing, are reported.
∗DAPNIA&IN2P3, LPSC †Rutherford Appleton Laboratory
Contents
1 Introduction 3
2 Working hypothesis 3
3 Building-up ray-tracing data 3
3.1 Arcs . . . 5 3.2 Solenoid straight . . . 7 3.3 Tuning/Collimation/RF straight . . . 8 3.4 Full ring . . . 8 3.4.1 Beam envelopes . . . 8 3.4.2 Closed orbits . . . 9
3.4.3 Momentum dispersion (to be revisited) . . . 9
3.5 Large amplitude tracking, preliminary tests . . . 10
4 Tracking, linear machine 11 4.1 Large amplitude tracking . . . 11
4.1.1 2-D horizontal initial conditions . . . 12
4.1.2 2-D vertical initial conditions . . . 13
4.1.3 4-D + δp/p initial conditions . . . 14
4.2 Transmission, 4-D + δp/p, no sextupoles . . . 15
4.2.1 ²x = ²z= 3 π cm (norm.), δp/p = ±1%. . . 15
4.2.2 ²x = ²z= 6 π cm (norm.), δp/p = ±4%. . . 16
5 Transmission, 4-D + δp/p, chromaticity corrected 17 5.1 Chromaticity correction . . . 17
5.2 Transmission . . . 17
6 Conclusion 18
Appendix 18
Closed orbit induced by chromaticity sextupoles 18
1 Introduction
The muon storage ring in the neutrino factory (NuFact in the following) is located at the high energy end of the muon acceleration chain. It delivers the µ+
/µ−decay neutrinos to physics detectors [1].
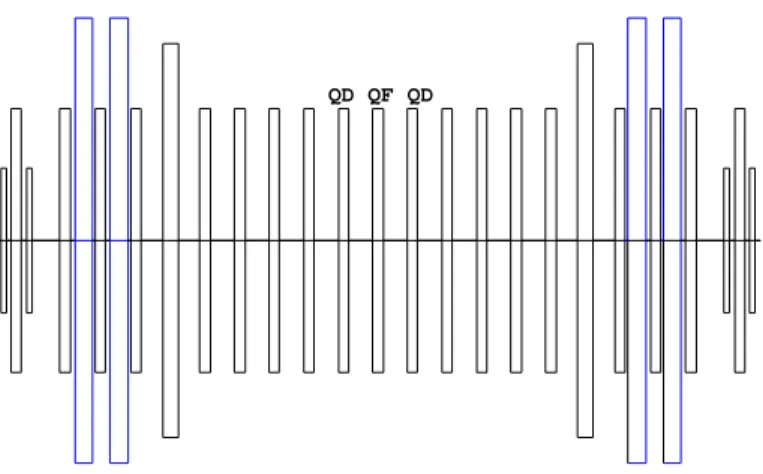
The design of concern here, is a triangle geometry 20 GeV storage ring (upgradable to 50 GeV) (Fig. 1), parameters in Tab. 1, which features two decay straight sections, each one aiming at a distant detector. The third straight section of the ring is devoted to tuning, collimation and RF.
A particularity of the proposed design, is in its being based on solenoid focusing decay straights, which has the virtue of minimizing the betatron amplitudes, compared to equivalent quadrupole focusing. The solenoidal focusing ensures the requested ratio, for the r.m.s. divergences of the 20 GeV muon and the neutrino beam, of 0.1 for an assumed muon normalized r.m.s. emittance of 4800 π mm mr (3 π cm, total). The goal of the present work is to show the viability of this design, in particular as concerns the impact of the solenoid focusing on machine behavior. It addresses the questions of residual coupling, machine acceptance, and concludes with a computation of beam transmission over 1000 turns.
2 Working hypothesis
A description of the design principles and of the lattice can be found in Ref. [2]. Unless otherwise men-tioned, working conditions, design parameters, etc., refer to it. The present study is based on stepwise ray-tracing [3], for the sake of accuracy in the representation of magnetic fields (combined function dipoles, solenoids, fringe fields, etc.), given the very large beam emittances of concern, however two matrix optics codes are used in addition for building the ray-tracing data files, and for cross-checks, namely, BETA [4] and MAD [5].
The report is organized as follows :
Section 3 establishes the basic optical properties of the storage ring, on the basis of ray-tracing methods, with cross-checks using matrix codes, and establishes the accuracy of the thousand turns range multiturn stepwise ray-tracing. Section 4.1 describes the machine behavior in presence of largest amplitude motion. Transmission simulation results are given in Section 4.2.
Various Appendices give additional details concerning the optics, numerical data, methods.
3 Building-up ray-tracing data
Goals, methods
This preliminary Section 3 has various aims :
- ensure the correctness of the ray-tracing data and data files
- maximize the integration step sizes so to maximize the tracking speed while preserving sufficient symplecticity over about 104turns in the ring (which is more than one order of magnitude larger than the
storage duration).
- set up ray-tracing data that yield first order quantities : phase advances, betatron amplitudes, disper-sions, etc., which stick as much as feasible to the matrix transport outputs.
Various hypothesis concerning the tracking data
- The arc dipoles are combined function magnets. This raises the question of the respective values of the dipole field and of the radial magnet positioning. These quantities can be arbitrarily chosen with the sole constraint of yielding zero closed orbit and the correct dispersion. Therefore our hypothesis in the present work is the following : the bending strength B0/Bρ = 1/ρis taken equal to that of the reference ring [2],
Table 1 : Muon storage ring parameters.
The right column gives, where worth, the stepwise ray-tracing data.
Matrix Ray-tracing
Energy (GeV) 20
Circumference (m) 1170.764
Requested transverse acceptance (π cm, norm.) 3
Requested δp/p acceptance (%) ±1 Total tunes νx/νz 10.790 / 11.151 10.791 / 11.147 Total chromaticities ξx/ξz -14.45 / -14.67 -14.35 / -14.92 Arcs 10-cell arcs (2) : Length (m) 78 Deviation (deg) 96.73 Phase advance (µx/µz) (2π) 2 / 2 ξx/ξz -2.01 / -2.27 -2.15 / -2.30 16-cell arc (1) : Length (m) 124.8 Deviation (deg) 154.766 Phase advance (µx/µz) (2π) 3.2 / 3.2 ξx/ξz -3.21 / -3.60 -3.44 / -3.67 Arc cell : Length (m) 7.8
Phase advance (µx/µz) (deg) 72
βx,zmax m 12.6
Dxmax m 1.08
Arc cell combined function dipole :
Length (m) 1.25 Deviation (deg) 4.836 Curvature (1/m) 0.337647 Foc. strength (m−2) ±0.16 Production Straight Length (m) 126
Number of solenoids (/straight) 8
Solenoid field, length (T, m) 4, 4
Phase advance (µx/µz) (2π) 0.5 / 0.5
βx,zmax (m) 100
Tuning/Collimation/RF straight Straight
Length (m) 148.364 Quad. strengths (m−2) < 0.11 Quad. lengths (m) 110, 200, 300, 340 Phase advance (µx/µz) (2π) 1.62 / 2.05 βx/zmax (m) 103 / 58 Dxmax (m) 0.7 Matching sections Phase advance (µx/µz) (2π) 0.97 / 0.9
Figure 1: Muon storage ring. The Tuning/Collimation/RF is placed vertical, on the left. The 8-solenoid decay straights are the two others. The left two arcs have ten cells, the right one has 16.
QD QF QD
Figure 2: Tuning/Collimation/RF straight, located between the two 10-cell arcs. The section comprises 4 dipoles
(blue), and quadrupoles with three different lengths. The four central cells (1
2QF − QD −
1
2QF) are used for tune
adjustment.
question of the exact reference field and positioning of these magnets.
- In this process of dipole positioning, the quadrupole components (K1) need slight readjusting so to obtain
phase advances value of Ref. [2].
- Bends are all assumed sector in Ref. [2], whereas they all are taken parallel face in the ray-tracing. However, (i) this only has very little effect on K1, (ii) for various reasons, such as the presence of fringe
fields, the phase advances of the ring pieces (arcs, decay straights, etc.) in the ray-tracing case need however be slightly readjusted so to identify with the matrix transport data ; this will take care of that sector/rectangle difference.
- Fringe fields are set in all dipoles, quadrupoles and solenoids, typical shapes are shown in Figs. 3, 5.
Choice of tunes, adjustment
They should be kept away from 3rd to 5th order resonances. Alternate values to the present ones, 10.79/11.15 (Tab. 1), can be, 10.83/11.17, 10.62/11.38, or, furthest from 5th order resonance, 10.71/11.29.
Tune adjustments are realized using the two pairs of cells (1
2QF − QD − 1
2QF) located on both sides
of the tuning straight section center, Fig. 2. Adaptation to the arc conditions is realized by buffer cells, the process requires a couple of iterations.
3.1 Arcs
The arc cell has the form
[D8, BF A, D8, BDA] optical functions are shown in Fig. 3. The arcs have the form
0 1 2 3 4 5 6 7 0 2 4 6 8 10 12
14 ARC CELL, OPTICAL FUNCTIONS (m)
NUX = 0.200 NUZ = 0.200 BFA BDA/2 BDA/2 β β z x 0.0 0.5 1. 1.5 2. 2.5 0.005 0.01 0.015 0.02 0.025 0.03 0.035 0.04 Bz/Brho (/m) vs. s (m)
Figure 3: Left : arc cell, optical functions and periodic dispersion. Right : typical field at traversal of a combined function BFA-type dipole, including fringe fields, in the stepwise ray-tracing method.
-.06 -.04 -.02 0.0 0.02 0.04 0.06 -.01 -.005 0.0 0.005 0.01 x’, z’ (rad) vs. x, z (m) (x) (z)
Figure 4:(x, x0)and (z, z0)motions, single particle, 105
passes in a cell, observed at ends of arc cell. Invariant
values ²x= ²z= 6 πcm.
wherein N = 9 or N = 15 for respectively the two 10-cell and the single 16-cell arcs, BDE=1
2BDA, D8
is a 1.4 m drift, and with other characteristics as described below.
Satisfactory degree of symplecticity over 105
passes on the maximum invariant 6 πcm in the cell is ensured using respectively 120/160/120 integra-tion steps in the about 40 cm / 210 / 40 cm long en-trance/body/exit regions of the BFA and BDA com-bined function dipoles. This is shown in Fig. 4. For comparison, taking 30/40/30 integration steps instead would yield horizontal phase space similar to that in Fig. 4, yet with noticeable smear in the vertical invariant.
Table 1:Ray-tracing data concerning the arc cell, together with matrix method hypothesis for comparison.
Magnet type length 1/ρ K1 angle shift
(m) (m−1) (m−2) (rad) (10−2m)
BFA Matrix method sbend 2.50 0.0337647 0.1580318 0.0844117 0
Ray-tracing sbend 2.50 id. 0.15917403 id. 1.78275 BDA Matrix method sbend 2.50 0.0337647 -0.1592295 0.0844117 0
Ray-tracing sbend 2.50 id. -0.15817843 id. 1.72389 BDE Matrix method sbend 1.25 0.0337647 -0.1592295 0.0844117 0
Ray-tracing sbend 1.25 id. -0.15817843 id. 0.4334
Chromaticity
We estimate the chromaticity using (y standing for x or z) ξy ≈ −
Z
βyKyds / 4π ≈ −NQ(βy|max− βy|min)KyL / 4π
From what precedes we have Kx,z ≈ 0.16m−2 (Tab. 1), βx,z|max ≈ 10.5m (Fig. 3), βx,z|min ≈ 3.5m,
(see parameter Table, page 4). The total chromaticities induced by the arcs are ξx/ξz ≈ −7.8/ − 8.3,
about half the ring values. Sextupoles located in the arc magnets will thus have to compensate twice the arc chromaticities. The correction can be estimated from K x
z
∓ S x z
Dx = 0, however the decoupling
between βx and βz in not so strong, so that the estimate is loose. A few iterations yield Sx ≈ 12 m−3,
Sz ≈ 20m−3.
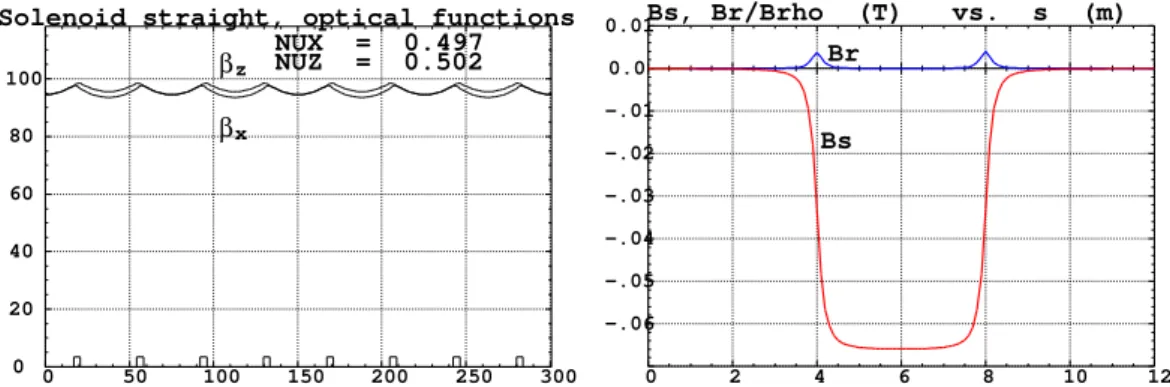
3.2 Solenoid straight
The solenoidal focusing assumes that, the ratio for the r.m.s. divergences of the 20 GeV muon and the neutrino beam is set at 0.1 for an assumed muon, normalized, r.m.s. emittance of 4800 π mm mr.
0 50 100 150 200 250 300 0 20 40 60 80 100
Solenoid straight, optical functions (m) NUX = 0.497 NUZ = 0.502β β z x 0 2 4 6 8 10 12 -.06 -.05 -.04 -.03 -.02 -.01 0.0 0.01Bs, Br/Brho (T) vs. s (m) Br Bs
Figure 5:Left : optical functions in the solenoid straight. Right : typical field components at traversal of a solenoid, off-axis, in the stepwise ray-tracing model.
-.1 -.05 0.0 0.05 0.1 -.001 -.0005 0.0 0.0005 0.001 x’, z’ (rad) vs. x, z (m) ( ) x, z
Figure 6: (x, x0)and (z, z0)motions, single
par-ticle, stepwise tracked over 2000 passes through the solenoid straight, observed at the straight end.
The solenoid straight ends feature series of weak bends, not shown here, the role of which is to remove the neutrinos originating from the muons which decay in the ring matching sections, of larger divergence angles.
The focal length in the solenoids satisfies 1/fs==
Z
(Bs/2Bρ)2ds ≈ L(Bs/2Bρ)2
with L=length, Bs=longitudinal field, yielding rotation
of the decoupling-free frame Ω = R(Bs/2Bρ)ds ≈
BsL/2Bρ. Again, fringe fields cause some slight
differ-ence between both with results as follows :
length Bs/2Bρ fall-off extent
(m) (m−1) (m)
M atrix method 4 0.0318503 0
Ray − tracing 4 0.0331322 4
Fig. 5-left gives the beta functions along the decay straight. Fig. 5-right shows typical longitudinal (Bs) and radial (Br) field component as experienced by a particle at traversal of a solenoid, off-axis. Fig. 6
shows the good behavior of a 2000-pass tracking through the solenoid straight. The particle has been launched on ²x/π = ²z/π = 3 πcm invariants, the phase advance is 0.4976 × 2π per pass. An ellipse
fitting yields βx = βz = 94.4m, α ≈ 0, as expected. The integration step size is 1 cm, the fringe field
3.3 Tuning/Collimation/RF straight
The optical characteristics are given in Fig. 7-left. Fig. 7-right shows the good behavior of the multiturn stepwise tracking ; matching to these ellipse yields βx = 3.65m, βz = 11.60m, αx,z ≈ 0, as expected ;
integration step size in quadrupole fringe field and body regions are respectively about 0.5 cm and 5 cm.
0 10 20 30 40 50 60 70 0 20 40 60 80 100 120
1/2-tuning straight, optical functions (m) β x β z -.04 -.02 0.0 0.02 0.04 -.006 -.004 -.002 0.0 0.002 0.004 0.006 x’, z’ (rad) vs. x, z (m) (x) (z)
Figure 7: Left : optical functions in half the collimation/tuning/RF straight (from arc to straight center). Right :
104-pass tracking, single particle launched on ²
x= ²z= 3 πcm (norm.), through the collimation straight ; x and z
phase space motions are observed at straight end.
3.4 Full ring
The goal of this Section is, prior to further large amplitude and DA tracking, to show the correct behavior of the stepwise ray-tracing and multiturn tracking over the ring, in terms of first order invariants, envelopes, etc.
3.4.1 Beam envelopes
A set of 50 particles is launched, these particles are evenly spread on ² = 3 π cm invariant, either pure (x,x’) or pure (z,z’) (Fig. 8), while δp/p ≡ 0. This set is tracked for a single turn. This yields the excursions along the ring, the extreme ones coinciding with the horizontal and vertical envelopes. Results are given in Fig. 8, together with envelopes obtained from matrix transport for comparison. It can be verified that the agreement is good (regardless of the slight β-beat from the matrix code in the solenoid straights).
0 200 400 600 800 1000 -.15 -.1 -.05 0.0 0.05 0.1 0.15 (x) x, z (m) vs. s (m) 0 200 400 600 800 1000 .15 .1 .05 0.0 0.05 0.1 0.15 (z) z (m) vs. s (m)
3.4.2 Closed orbits
The residual geometrical closed orbits, as induced in the horizontal plane by the combined function dipoles and coupled into the vertical plane by the solenoids, are shown in Fig. 9. It can be seen that these are small, with maximum amplitude less than 0.04 mm in x and less than 0.07 mm in z.
X-co
50 100 150 200 250 300 350 -0.03 -0.02 -0.01 0.0 0.01 0.02 0.03 x (mm) vs. elmnt #Z-co
50 100 150 200 250 300 350 -0.02 0.0 0.02 0.04 0.06 z (m) vs. elmnt #Figure 9: Residual geometrical closed orbits (horizontal axis gives optical element number).
3.4.3 Momentum dispersion (to be revisited)
Dispersion functions are obtained by tracking the closed orbit of a chromatic particle, after normalization by δp/p. They are shown in Fig. 10, they reach maximum values Dx,max ≈ 1.1m, and, due to coupling
Dz,max≈ 1mm. The agreement with matrix methods is good.
Dx
0 200 400 600 800 1000 0.2 0.4 0.6 0.8 1 x / dp/p (m) vs. s (m)Dz
0 200 400 600 800 1000 -0.6E-2 -0.5E-2 -0.4E-2 -0.3E-2 -0.2E-2 -0.1E-2 0.0 0.1 E-2 z / dp/p (m) vs. s (m)3.5 Large amplitude tracking, preliminary tests
The results below have the mere goal of giving a rapid idea of expectable acceptances. They are clearly satisfactory and justify further inspection, next Sections.
In case of purely 2D initial beam coordinates, multiturn stepwise ray-tracing yields the following maximum stable amplitudes :
Maximum stable
starting invariant induced emittance corresponding
(normalized) tunes νx/νz
²x/π = 2.64 × 3 πcm ²z/π = 0.01 × 3 πcm 0.799 / 0.182
²z/π = 2.63 × 3 πcm ²x/π = 0.03 × 3 πcm 0.825 / 0.155
If now non-zero δp/p is introduced, the maximum stable amplitudes are sensibly decrease compared to the above, due to the absence of chromaticity corrections in the present optics. This is illustrated in Fig. 11 with δp/p = 0.5%. The corresponding tunes are shown in Fig. 12, they differ from the δp/p = 0 ones (νx= 10.79, νz = 11.15, Tab. 1) by the amount ∆νx,z = ξx,zδp/p, with ξx,z≈ −15.
Horizontal motion Vertical motion
-.03 -.02 -.01 0.0 0.01 0.02 0.03 -.004 -.003 -.002 -.001 0.0 0.001 0.002 0.003 0.004 x’ (rad) vs. x (m)
Min-max. Hor.: -3.6205E-02 3.7506E-02; Ver.: -4.5865E-03 4.5310E-03 Part# 1-40000 (*) ; Lmnt# 1; pass# 1- 1000; 1000 points
-.06 -.04 -.02 0.0 0.02 0.04 0.06 -.003 -.002 -.001 0.0 0.001 0.002 0.003 z’ (rad) vs. z (m)
Min-max. Hor.: -6.7184E-02 6.7257E-02; Ver.: -3.2687E-03 3.2601E-03 Part# 1-40000 (*) ; Lmnt# 1; pass# 1- 1000; 1000 points
Figure 11:A particle launched on ²x= ²z= 3.6 πcm invariants and with δp/p = 0.5%. 1000 turns in the ring.
0.5 0.6 0.7 0.8 0.9 1. 0.2 0.4 0.6 0.8 1. X FREQUENCY NuX = 0.740090 amplitude = 321.6 0.0 0.1 0.2 0.3 0.4 0.5 0.2 0.4 0.6 0.8 1. Z FREQUENCY NuZ = 0.090282 amplitude = 1034.
4 Tracking, linear machine
4.1 Large amplitude trackingHere, we first perform a series of tests aimed at controlling the large amplitude behavior, both of the tracking method and of the ring itself. We limit the investigations to the ²x/π = 3 πcm, ²z/π = 3 πcm,
δp/p = ±1% ranges, these will be pushed further in Section 4.2.2.
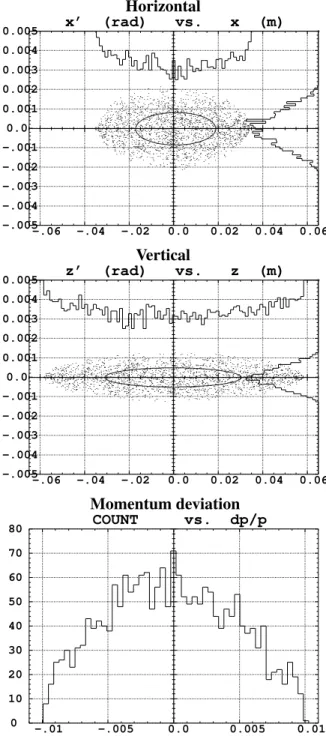
Initial conditions
Fig. 13 shows the initial distributions used in the following. They represent the beam at the middle of the tuning straight section.
Horizontal -.06 -.04 -.02 0.0 0.02 0.04 0.06 -.005 -.004 -.003 -.002 -.001 0.0 0.001 0.002 0.003 0.004 0.005 x’ (rad) vs. x (m)
Min-max. Hor.: -6.5000E-02 6.5000E-02; Ver.: -5.0000E-03 5.0000E-03 Part# 1- 9999 (*) ; Lmnt# * all; pass# 1- 1; 2000 points Eps/pi, Beta, Alpha: 1.5054E-05 21.5 -4.768E-03 (MKSA) Vertical
-.06 -.04 -.02 0.0 0.02 0.04 0.06 -.005 -.004 -.003 -.002 -.001 0.0 0.001 0.002 0.003 0.004 0.005 z’ (rad) vs. z (m)
Min-max. Hor.: -6.5000E-02 6.5000E-02; Ver.: -5.0000E-03 5.0000E-03 Part# 1- 9999 (*) ; Lmnt# * all; pass# 1- 1; 2000 points Eps/pi, Beta, Alpha: 1.5128E-05 62.3 2.216E-03 (MKSA) Momentum deviation
-.01 -.005 0.0 0.005 0.01 0 10 20 30 40 50 60 70 80 COUNT vs. dp/p
Min-max. Hor.: -1.1000E-02 1.1000E-02; Ver.: 0.000 80.00 Part# 1-10000 (*) ; Lmnt# * all; pass# 1- 1; 50 points Mean:-2.23744E-04; Sigma: 4.75465E-03; X(max): 1.67310E-04; Counts: 2000
4.1.1 2-D horizontal initial conditions
An initial 200-particle beam with zero vertical initial amplitudes, initial (x, x0)as shown in Fig. 13, δp/p =
0, is tracked for a few hundred turns. The transmission is 100%. Fig. 14 shows the tracking results : - the horizontal motion (i) is highly linear, up to ²x= 3πcm here,
- the coupling is very weak given here νx/νz = 10.79/11.15on-momentum tune values, as a consequence
the vertical motion induced (ii) is very small,
- corresponding Fourier spectra are shown in Figs. 14-(iii,iv), the vertical one is very weak as expected from what precedes, and shows a side peak due to (negligible) x − z coupling,
- the beam extent in the tune diagram (v) is mostly due to the chromaticities,
- in the amplitude-detuning plot, Fig. (vi), the ²x/πvalue for each particle is drawn from elliptical fit of the
particle motion in phase-space, which is justified, following Fig. 14-(i). The amplitude-detuning appears to be very weak, this is due to the absence of strong field non-linearities,
(i)
-.03 -.02 -.01 0.0 0.01 0.02 0.03 -.004 -.003 -.002 -.001 0.0 0.001 0.002 0.003 0.004 x’ (rad) vs. x (m)(ii)
-0.2E-5 -0.1E-5 0.0 0.1E-5 0.2E-5 -0.8E-7 -0.6E-7 -0.4E-7 -0.2E-7 0.0 0.2 E-7 0.4 E-7 0.6 E-7 0.8 E-7 z’ (rad) vs. z (m)
(iii)
0.5 0.6 0.7 0.8 0.9 1. 0.5 1. 1.5 2. 2.5 3. 3.5 X SPECTRUM(iv)
0.0 0.1 0.2 0.3 0.4 0.5 0.2 E-8 0.4 E-8 0.6 E-8 0.8 E-8 0.1 E-7 Z SPECTRUM(v)
10.5 10.6 10.7 10.8 10.9 11. 11. 11.1 11.2 11.3 11.4 11.5 Tune diagram(vi)
0.1E-4 0.2E-4 0.3E-4 0.4E-4 0.5E-4 0.6E-4 0.7E-4
10.79 10.79 10.79 10.79 10.79
H tune vs. H emittance (m.rad)
Figure 14:(i) Horizontal motion of sample particles, up to about 3 π cm. (ii) Corresponding small vertical motion,
induced by solenoidal coupling. (iii, iv) Specimen νxand νzspectra. (v) Tune diagram for the 200 particles, obtained
4.1.2 2-D vertical initial conditions
An initial 200-particle mono-energetic beam, with zero horizontal initial amplitude, δp/p = 0, initial (z, z0)distributed as shown in Fig. 13, ²
z = 3πcm (norm.), is tracked for a few hundred turns over the
ring. The transmission is 100%. Fig. 15 shows the tracking results : - the vertical motion (ii) is highly linear, up to ²z = 3πcm here,
- the coupling is very weak given here νx/νz = 10.79/11.15on-momentum tune values, as a
conse-quence the horizontal motion induced (i) is very small,
- corresponding Fourier spectra (iii,iv) : the horizontal one is very weak, and shows a side peak on the left, due to the x − z coupling,
- the beam extent in the tune diagram (v) is mostly due to the chromaticities,
- in the amplitude-detuning plot in Fig. 14-vi, the ²z/πvalue for each particle is drawn from elliptical
fit of the particle motion in phase-space, which is justified, see Fig. (ii). The amplitude-detuning appears to be very weak, this is due to the absence of strong field non-linearities,
(i)
-0.6E-4 -0.4E-4 -0.2E-4 0.0 -0.8E-5 -0.6E-5 -0.4E-5 -0.2E-5 0.0 0.2 E-5 0.4 E-5 0.6 E-5 0.8 E-5 x’ (rad) vs. x (m)
(ii)
-.06 -.04 -.02 0.0 0.02 0.04 0.06 -.004 -.003 -.002 -.001 0.0 0.001 0.002 0.003 0.004 0.005 z’ (rad) vs. z (m)(iii)
0.5 0.6 0.7 0.8 0.9 1. 0.2 E-4 0.4 E-4 0.6 E-4 0.8 E-4 0.0001 X SPECTRUM(iv)
0.0 0.1 0.2 0.3 0.4 0.5 0 50 100 150 200 250 300 350 400 Z SPECTRUM(v)
10.5 10.6 10.7 10.8 10.9 11. 11. 11.1 11.2 11.3 11.4 11.5 Tune diagram(vi)
0.1E-4 0.2E-4 0.3E-4 0.4E-4 0.5E-4 0.6E-4 0.7E-4 11.15
11.15 11.15 11.15 11.15
V tune vs. V emittance (m.rad)
Figure 15: (i) Small induced horizontal motion of sample particles, due to the solenoids. (ii) Vertical motion, up
to about 3 π cm. (iii, iv) Specimen νxand νz spectra. (v) Tune diagram for the 200 particles, obtained by Fourier
4.1.3 4-D + δp/p initial conditions
An 200-particle beam with initial ²x = ²z = 3 πcm and −1% < δp/p < 1%, with distributions as shown
in Fig. 13, is tracked for a few hundred turns. The transmission is close to 100%. Figs. 16-18 give the tracking results.
(i)
-.03 -.02 -.01 0.0 0.01 0.02 0.03 -.003 -.002 -.001 0.0 0.001 0.002 0.003 0.004 x’ (rad) vs. x (m)(ii)
-.04 -.02 0.0 0.02 0.04 -.002 -.001 0.0 0.001 0.002 0.003 z’ (rad) vs. z (m)Min-max. Hor.: -5.2000E-02 5.2000E-02; Ver.: -3.0000E-03 3.0000E-03 Part# -1- 20 (*) ; Lmnt# 1; pass# 1- 169; 1528 points
Figure 16:(i) Horizontal motion of sample particles. (ii) Vertical motion. The apparent mismatch of some ellipses stems from betatron mismatch of off-momentum particles.
(iii)
0.5 0.6 0.7 0.8 0.9 1. 0.5 1. 1.5 2. 2.5 3. 3.5 NuY = 0.778422 amplitude = 3.397 0.0 0.1 0.2 0.3 0.4 0.5 0 2 4 6 8 10 12 14 16 18 Postprocessor/Zgoubi NoDate... TUNES NuZ = 0.130142 amplitude = 18.65 Part 80 at Lmnt * all 0.5 0.6 0.7 0.8 0.9 1. 0.2 0.4 0.6 0.8 1. 0.0 0.1 0.2 0.3 0.4 0.5 0.2 0.4 0.6 0.8 1. Qz(iv)
10.5 10.6 10.7 10.8 10.9 11. 11. 11.1 11.2 11.3 11.4 11.5 Tune diagramFigure 17: (iii) Sample spectra, respectively x/z/x/z from left to right, all showing a single peak, proof of negligible
coupling. (iv) Tune diagram footprint, from Fourier analysis. The extent satisfies ∆νx,z = ξx,zδp/pgiven ξx ≈
ξz≈ −15.
(v)
0.1
E-4 0.2E-4 0.3E-4 0.4E-4 0.5E-4 0.6E-4 0.7E-4
10.5 10.6 10.7 10.8 10.9
11.H tune vs. H emittance (m.rad)
(vi)
0.0 0.2E-4 0.4E-4 0.6E-4 0.8E-4
11. 11.1 11.2 11.3 11.4
11.5V tune vs. V emittance (m.rad)
Figure 18: (v) Amplitude detuning, horizontal, νxas a function of ²x/π(drawn from elliptical fit of each particle
4.2 Transmission, 4-D + δp/p, no sextupoles
4.2.1 ²x= ²z = 3 πcm (norm.), δp/p = ±1%.
A 2000 particle beam is launched for 1000 turns around the ring. The initial conditions are those of Fig. 13, reproduced in of Fig. 19 for easier comparison with the tracking results. The transmission is 1942/2000 particles. In other words, the acceptance of the defect-free ring, chromaticity non corrected, is larger than 3 π cm transverse, ±1% δp/p. The transmitted beam, after 1000 turns, is shown in Fig. 20, the momentum distribution remains that of Fig. 19, unchanged. Figs. 21, 22 show the satisfactory behavior of the horizontal and vertical phase-space motions and of the numerical tracking.
-.06 -.04 -.02 0.0 0.02 0.04 0.06 -.005 -.004 -.003 -.002 -.001 0.0 0.001 0.002 0.003 0.004 0.005 x’ (rad) vs. x (m)
Min-max. Hor.: -6.5000E-02 6.5000E-02; Ver.: -5.0000E-03 5.0000E-03 Part# 1- 9999 (*) ; Lmnt# * all; pass# 1- 1; 2000 points Eps/pi, Beta, Alpha: 1.5054E-05 21.5 -4.768E-03 (MKSA)
-.06 -.04 -.02 0.0 0.02 0.04 0.06 -.005 -.004 -.003 -.002 -.001 0.0 0.001 0.002 0.003 0.004 0.005 z’ (rad) vs. z (m)
Min-max. Hor.: -6.5000E-02 6.5000E-02; Ver.: -5.0000E-03 5.0000E-03 Part# 1- 9999 (*) ; Lmnt# * all; pass# 1- 1; 2000 points Eps/pi, Beta, Alpha: 1.5128E-05 62.3 2.216E-03 (MKSA)
-.01 -.005 0.0 0.005 0.01 0 10 20 30 40 50 60 70 80 COUNT vs. dp/p
Min-max. Hor.: -1.1000E-02 1.1000E-02; Ver.: 0.000 80.00 Part# 1-10000 (*) ; Lmnt# * all; pass# 1- 1; 50 points Mean:-2.23744E-04; Sigma: 4.75465E-03; X(max): 1.67310E-04; Counts: 2000
Figure 19: Initial conditions for transmission simulations. The local betatron functions are βx = 7.73m, βz =
22.7m, αx,z = 0, Dx,z≈ 0, D0x,z≈ 0. -.06 -.04 -.02 0.0 0.02 0.04 0.06 -.005 -.004 -.003 -.002 -.001 0.0 0.001 0.002 0.003 0.004 0.005 x’ (rad) vs. x (m)
Min-max. Hor.: -6.5000E-02 6.5000E-02; Ver.: -5.0000E-03 5.0000E-03 Part# 1- 9999 (*) ; Lmnt# * all; pass# 100- 100; 1943 points Eps/pi, Beta, Alpha: 2.3354E-05 7.94 -5.899E-03 (MKSA) Eps/pi, Beta, Alpha: 2.3403E-05 8.17 -1.876E-02 (MKSA) Eps/pi, Beta, Alpha: 2.3542E-05 7.79 2.455E-03 (MKSA)
-.06 -.04 -.02 0.0 0.02 0.04 0.06 -.005 -.004 -.003 -.002 -.001 0.0 0.001 0.002 0.003 0.004 0.005 z’ (rad) vs. z (m)
Eps/pi, Beta, Alpha: 2.4686E-05 21.5 5.363E-03 (MKSA) Eps/pi, Beta, Alpha: 2.4675E-05 21.7 -1.607E-03 (MKSA) Eps/pi, Beta, Alpha: 2.4851E-05 21.5 -1.066E-02 (MKSA)
0 200 400 600 800 1000 1900 1920 1940 1960 1980 2000 COUNT vs. Pass#
Figure 20: Left and middle : a superposition of (resp. H and V) phase spaces and projected densities at turns # 100, 500 and 1000 ; it can be observed that the emittance and densities practically do not change as turns proceed, meaning absence of sensible (numerical or real) diffusion effect. Right : number of particles transmitted vs turn number. Note : the apparent emittance increase, compared with Fig. 19, is the effect of momentum spread, in the absence of chromaticity corrections (adapted ellipse depends on δp/p).
-.06 -.04 -.02 0.0 0.02 0.04 0.06 -.005 -.004 -.003 -.002 -.001 0.0 0.001 0.002 0.003 0.004 0.005 x’ (rad) vs. x (m) -.06 -.04 -.02 0.0 0.02 0.04 0.06 -.005 -.004 -.003 -.002 -.001 0.0 0.001 0.002 0.003 0.004 0.005 z’ (rad) vs. z (m)
Figure 21:Sample multiturn tracking, some arbitrary particles with var-ious H and V conditions. This shows the good behavior of the numerical integration (no evidence for non-symplectic behavior).
10.5 10.6 10.7 10.8 10.9 11. 11. 11.1 11.2 11.3 11.4 11.5 Tune diagram * * Y-Min, max plotted : 8.2866E-03 0.3017
X-Min, max plotted : 0.6654 0.9450 1943 points plotted
Figure 22:Beam footprint in the tune diagram, with extent due to the
4.2.2 ²x= ²z = 6 πcm (norm.), δp/p = ±4%.
A 104 particle beam is launched for 1000 turns around the ring, initial conditions schemed in Fig. 23.
The transverse 6 π cm (norm.) emittance value twice the requested one, the momentum bite is about four times larger than requested. The transmission is 5500/10000 particles, Fig. 24-left ; most of the losses occur during the first tens of turns, they are due to δp/p induced resonant conditions (those parts of the beam that straddle harmful resonance lines). The transmitted beam, after 1000 turns, is shown in Fig. 24. It can be observed on Figs. 23 and Fig. 24, that the (x, x0)and (z, z0)transverse densities change
their initial parabolic shape to an equilibrium bell shape, this is due to the dβx,z/dp/p in the absence
of chromaticity correction, which also result in an apparent emittance increase. Figs. 25, 26 shows the satisfactory behavior of the horizontal and vertical phase-space motions and of the numerical tracking.
-.1 -.05 0.0 0.05 0.1 -.008 -.006 -.004 -.002 0.0 0.002 0.004 0.006 0.008
0.01 x’_o (rad) vs. x_o (m)
Min-max. Hor.: -0.1200 0.1200 ; Ver.: -1.0000E-02 1.0000E-02 Part# 1- 3000 (*) ; Lmnt# 1; pass# 1- 1; 3000 points Eps/pi, Beta, Alpha: 3.0621E-05 21.2 -4.551E-03
-.1 -.05 0.0 0.05 0.1 -.008 -.006 -.004 -.002 0.0 0.002 0.004 0.006 0.008
0.01 z’_o (rad) vs. z_o (m)
Eps/pi, Beta, Alpha: 3.0255E-05 64.0 4.601E-03
-.03 -.02 -.01 0.0 0.01 0.02 0.03 0 20 40 60 80 100 120 140 160 COUNT vs. dp/p COUNT vs. dp/p
Figure 23: Initial conditions for transmission simulations, and transmitted momentum density (red histogram on
the right). The local betatron functions are βx= 7.73m, βz= 22.7m, αx,z= 0, Dx,z≈ 0, D0x,z≈ 0.
-.1 -.05 0.0 0.05 0.1 -.008 -.006 -.004 -.002 0.0 0.002 0.004 0.006 0.008
0.01 x’_o (rad) vs. x_o (m)
Min-max. Hor.: -0.1200 0.1200 ; Ver.: -1.0000E-02 1.0000E-02 Part# 1- 3000 (*) ; Lmnt# 1; pass# 650- 650; 1741 points Eps/pi, Beta, Alpha: 4.4647E-05 6.81 -3.180E-02 Eps/pi, Beta, Alpha: 4.5395E-05 6.43 -1.930E-03
-.1 -.05 0.0 0.05 0.1 -.008 -.006 -.004 -.002 0.0 0.002 0.004 0.006 0.008
0.01 z’_o (rad) vs. z_o (m)
Min-max. Hor.: -0.1200 0.1200 ; Ver.: -1.0000E-02 1.0000E-02 Part# 1- 3000 (*) ; Lmnt# 1; pass# 300- 300; 1744 points Eps/pi, Beta, Alpha: 3.9550E-05 26.3 4.883E-02 Eps/pi, Beta, Alpha: 4.0203E-05 26.0 8.191E-03
100 200 300 400 500 600 0 1000 2000 3000 4000 5000 6000 7000 8000 9000 COUNT vs. Pass#
Figure 24: Left and middle : a superposition of (resp. H and V) phase spaces and projected densities at turns # 300 and 650 ; it can be observed that the emittance and densities practically do not change, meaning absence of sensible (numerical or real) diffusion effect. Right : number of particles transmitted vs turn number. Note : the apparent emittance increase, compared with Fig. 23, is the effect of momentum spread, in the absence of chromaticity corrections (adapted ellipse depends on δp/p).
-.1 -.05 0.0 0.05 0.1 -.008 -.006 -.004 -.002 0.0 0.002 0.004 0.006 0.008
0.01 x’_o (rad) vs. x_o (m)
-.1 -.05 0.0 0.05 0.1 -.008 -.006 -.004 -.002 0.0 0.002 0.004 0.006 0.008
0.01 z’_o (rad) vs. z_o (m)
Min-max. Hor.: -0.1200 0.1200 ; Ver.: -1.0000E-02 1.0000E-02 Part# 30- 30 (*) ; Lmnt# 1; pass# 1- 654; 654 points
Zgoubi|Zpop NoDate...
* Track ring ellipse * P (rad) vs. Z (m)
Min-max. Hor.: -0.1200 0.1200 ; Ver.: -1.0000E-02 1.0000E-02 Part# 29- 29 (*) ; Lmnt# 1; pass# 1- 654; 654 points
Zgoubi|Zpop NoDate...
* Track ring ellipse * P (rad) vs. Z (m)
Min-max. Hor.: -0.1200 0.1200 ; Ver.: -1.0000E-02 1.0000E-02 Part# 28- 28 (*) ; Lmnt# 1; pass# 1- 654; 654 points
Zgoubi|Zpop NoDate...
* Track ring ellipse * P (rad) vs. Z (m)
Min-max. Hor.: -0.1200 0.1200 ; Ver.: -1.0000E-02 1.0000E-02 Part# 25- 25 (*) ; Lmnt# 1; pass# 1- 654; 654 points
Zgoubi|Zpop NoDate...
* Track ring ellipse * P (rad) vs. Z (m)
Min-max. Hor.: -0.1200 0.1200 ; Ver.: -1.0000E-02 1.0000E-02 Part# 23- 23 (*) ; Lmnt# 1; pass# 1- 654; 654 points
Zgoubi|Zpop NoDate...
* Track ring ellipse * P (rad) vs. Z (m)
Min-max. Hor.: -0.1200 0.1200 ; Ver.: -1.0000E-02 1.0000E-02 Part# 21- 21 (*) ; Lmnt# 1; pass# 1- 654; 654 points
Zgoubi|Zpop NoDate...
* Track ring ellipse * P (rad) vs. Z (m)
Min-max. Hor.: -0.1200 0.1200 ; Ver.: -1.0000E-02 1.0000E-02 Part# 19- 19 (*) ; Lmnt# 1; pass# 1- 654; 654 points
Zgoubi|Zpop NoDate...
* Track ring ellipse * P (rad) vs. Z (m)
Min-max. Hor.: -0.1200 0.1200 ; Ver.: -1.0000E-02 1.0000E-02 Part# 18- 18 (*) ; Lmnt# 1; pass# 1- 654; 654 points
Figure 25:Sample multiturn tracking, height arbitrary particles with var-ious H, V and δp/p conditions, showing the good behavior of numerical integration (no evidence for prohibitive non-symplectic effects).
10.5 10.6 10.7 10.8 10.9 11. 11. 11.1 11.2 11.3 11.4 11.5 Tune diagram
Figure 26:Beam footprint in the tune diagram, with extent due to chromatic-ity and coupling.
5 Transmission, 4-D + δp/p, chromaticity corrected
5.1 Chromaticity correctionSextupole components are now introduced in the combined function dipoles of 10 arc cells in the 10 cell arcs, and in 15 cells in the 16 cell arc. This arrangement matches the 2π/5 phase advance per cell, for cancellation of geometrical aberrations. They are tuned to reduce the total linear chromaticity in both planes (about twice the value stemming from the sole arcs) from -15 down to -1.
This correction scheme is simplistic, being comprised of only two families of sextupoles for compensation of ξxand ξz, regardless of possible improvements, by using a more sophisticated implementation. This is
left to further more detailed investigations.
The effect of these sextupoles on closed orbit (up to ±3 mm in the horizontal plane, see App. 6) and its feed down on machine tunes are not corrected, they are left as they come.
5.2 Transmission
The initial conditions are, total emittances ²x = ²z = 6 π cm (norm.), δp/p = ±4% (Fig. 23).
-.03 -.02 -.01 0.0 0.01 0.02 0.03 0 500 1000 1500 2000 2500 3000 3500 4000 COUNT vs. dp/p
Figure 27: Momentum densities, initial (blue) and transmitted (red).
630/1000 particles are transmitted, Fig. 28-right, most of the losses occur during the first tens of turns, rejection is both in δp/pand emittance. The transmitted beam, after 1000 turns, is shown in Figs. 27 (momentum, red curve) and 28 (phase spaces). Comparison of Figs. 23-right and 27 shows the improvement in transmitted momentum bite resulting from the chromaticity cor-rection. However the overall effect is limited, probably due to geometrical aberrations so introduced (reduction of DA). Fig. 29 shows the satisfactory behavior of the horizontal and ver-tical phase-space motions and of the numerical tracking. Fig. 30 shows the beam footprint in the tune diagram, with extent due to chromaticity. -.1 -.05 0.0 0.05 0.1 -.008 -.006 -.004 -.002 0.0 0.002 0.004 0.006 0.008 0.01 x’ (rad) vs. x (m)
Min-max. Hor.: -0.1100 0.1100 ; Ver.: -1.0000E-02 1.0000E-02 Part# 1- 9999 (*) ; Lmnt# 1; pass# 128- 128; 639 points Eps/pi, Beta, Alpha: 3.4533E-05 7.85 5.586E-02
-.1 -.05 0.0 0.05 0.1 -.008 -.006 -.004 -.002 0.0 0.002 0.004 0.006 0.008 0.01 z’ (rad) vs. z (m)
Eps/pi, Beta, Alpha: 3.5993E-05 21.5 -1.263E-02
20 40 60 80 100 120 500 600 700 800 900 1000 COUNT vs. Pass#
Figure 28:Left and middle : a superposition of (resp. H and V) phase spaces and projected densities at turns # 300 and 650 ; it can be observed that the emittance and densities practically do not change, meaning absence of sensible (numerical or real) diffusion effect. Right : number of particles transmitted vs turn number.
-.1 -.05 0.0 0.05 0.1 -.008 -.006 -.004 -.002 0.0 0.002 0.004 0.006 0.008 0.01 x’ (rad) vs. x (m)
Min-max. Hor.: -0.1100 0.1100 ; Ver.: -1.0000E-02 1.0000E-02 Part# 1- 9999 (*) ; Lmnt# 1; pass# 128- 128; 639 points Eps/pi, Beta, Alpha: 3.4533E-05 7.85 5.586E-02
-.1 -.05 0.0 0.05 0.1 -.008 -.006 -.004 -.002 0.0 0.002 0.004 0.006 0.008 0.01 z’ (rad) vs. z (m)
Eps/pi, Beta, Alpha: 3.5993E-05 21.5 -1.263E-02
Figure 29: Sample multiturn tracking, arbitrary particles with various H, V and δp/p conditions. It shows the good behavior of the numerical integration (no evidence for prohibitive non-symplectic behavior).
10.5 10.6 10.7 10.8 10.9 11. 11. 11.1 11.2 11.3 11.4 11.5 Tune diagram
Figure 30:Beam footprint in the tune diagram, with extent due to chromatic-ity and coupling.
6 Conclusion
This tracking study shows that the principle of a triangle muon storage ring based on solenoidal focusing, and with apex angle consistent with two baselines, fulfills acceptance requirements.
Detailed investigations need be pursued, though, for instance on principle chromaticity corrections. This is left to further work and publications.
Appendix
Closed orbit induced by chromaticity sextupoles
50 100 150 200 250 300 350 -.002 -.001 0.0 0.001 0.002 X_co (m) vs. lmnt# 50 100 150 200 250 300 350 -.0002 -.0001 0.0 0.0001 0.0002 0.0003 Z_co (m) vs. lmnt#
Extreme horizontal c.o. amplitudes of 2.4 mm and -2.8 mm are attained respectively in the decay straights and at ends of the collimation/tuning/RF straight (left Figure). In the absence of any correction.
The slight coupling introduced by the solenoids entails a c.o. excursion of ±0.3 mm about, in the decay straights (right Figure).
References
[1] C. Johnstone et als., Muon storage rings for the neutrino factory, EPAC 2006.
[2] G. Rees, Stormu20 (20 GeV, µ+ and µ-, Isosceles Triangle, Storage Rings.), RAL, unpublished (2005). [3] F. M´eot, The ray-tracing code Zgoubi, NIM A 427 (1999) 353-356.
[4] The BETA code, J. Payet, F. M´eot et als., CEA/DAPNIA, Saclay.
[5] H. Grote, F. C. Iselin, The MAD Program, User’s Reference Manual, CERN/SL/90-13 (AP) (Rev. 5), CERN, 29 April 1996.
[6] G. Leleux, Compl´ements sur la physique des acc´el´erateurs, DEA de Physique et Technologie des Grands Instruments, rapport CEA/DSM/LNS/86-101, CEA, Saclay (1986).
[7] H.A. Enge, Deflecting magnets, in Focusing of charged particles, volume 2, A. Septier ed., Academic Press, New-York and London (1967).
[8] G. Leleux, Influence of quadrupole fringe fields on wave numbers, Tech. report 6-67/GL-FB, LAL, Orsay (2 Feb. 1967).