HAL Id: hal-01994645
https://hal.archives-ouvertes.fr/hal-01994645
Submitted on 28 Feb 2020
HAL is a multi-disciplinary open access
archive for the deposit and dissemination of sci-entific research documents, whether they are pub-lished or not. The documents may come from teaching and research institutions in France or abroad, or from public or private research centers.
L’archive ouverte pluridisciplinaire HAL, est destinée au dépôt et à la diffusion de documents scientifiques de niveau recherche, publiés ou non, émanant des établissements d’enseignement et de recherche français ou étrangers, des laboratoires publics ou privés.
Nicola Kuczewski
To cite this version:
Karima Ait Ouares, Corinne Beurrier, Marco Canepari, Gwenaelle Laverne, Nicola Kuczewski. Opto nongenetics inhibition of neuronal firing. European Journal of Neuroscience, Wiley, 2019, 49 (1), pp.6-26. �10.1111/ejn.14251�. �hal-01994645�
For Peer Review
Opto non-genetics inhibition of neuronal firing
Journal: European Journal of Neuroscience Manuscript ID EJN-2018-08-25818.R1
Manuscript Type: Registered Report (Stage 2) Date Submitted by the Author: n/a
Complete List of Authors: Ait Ouares, Karima; Université Grenoble Alpes et CNRS UMR 5588, Laboratoire Interdisciplinaire de Physique (LIPhy).Laboratories of Excellence, Ion Channel Science and Therapeutics, France
Beurrier, Corinne; UMR7288 (CNRS/Aix-Marseille Université), Institut de Biologie du Développement de Marseille (IBDM)
Canepari, Marco; Université Grenoble Alpes et CNRS UMR 5588, Laboratoire Interdisciplinaire de Physique (LIPhy), Laboratories of
Excellence, Ion Channel Science and Therapeutics, France.Institut National de la Santé et Recherche Médicale, France
laverne, gwenaelle; UMR7288 (CNRS/Aix-Marseille Université), Institut de Biologie du Développement de Marseille (IBDM)
Kuczewski, Nicola; Université Claude Bernard , Centre de Recherche en neuroscience de Lyon
Key Words: mice, optogenetics, brain slices, light stimulation
For Peer Review
1
Opto non-genetics inhibition of neuronal firing
K. Ait Ouares1*, C. Beurrier2*, M. Canepari1,3 *, G.Laverne2*, N. Kuczewski4
(* equal contribution)
1
Univ. Grenoble Alpes, CNRS, LIPhy, F-38000 Grenoble, France. Laboratories of Excellence, Ion Channel Science and Therapeutics, France. 2Aix Marseille University, CNRS, IBDM, Marseille, France. 3Univ. Grenoble Alpes, CNRS, LIPhy, F-38000 Grenoble, France. Laboratories of Excellence, Ion Channel Science and Therapeutics, France.Institut National de la Santé et Recherche Médicale, France. 3CNRS, UMR 5292; INSERM, U1028; Lyon Neuroscience Research Center, Neuroplasticity and neuropathology of olfactory perception Team, Lyon, F-69000, France; University Lyon,
F-69000, France; University Lyon1, Villeurbanne, F-69000, France.
Corresponding author:
Nicola Kuczewski
Centre de Recherche en Neurosciences de Lyon UMR CNRS 5292 INSERM 1028 Université Lyon1 50 Avenue Tony Garnier
F-69007 LYON, FRANCE Tel: (+33) 4 37 28 74 62 Fax: (+33) 4 37 28 76 01
e-mail:nicola.kuczewski@univ-lyon1.fr
Running title: Neuronal sensitivity to visual light stimulation Total number of pages:39
Total number of figures:16 Total number of tables: 3
The total number of words in the whole manuscript: 12,775 The total number of words in the Abstract:192
For Peer Review
2
Abstract
Optogenetics is based on the selective expression of exogenous opsins by neurons allowing
experimental control of their electrical activity using visible light. The interpretation of the
results of optogenetic experiments is based on the assumption that light stimulation
selectively acts on those neurons expressing the exogenous opsins without perturbing the
activity of naive ones. Here, we report that light stimulation, of wavelengths and power in the
range of those normally used in optogenetic experiments, consistently reduces the firing
activity of naive Mitral Cells (MCs) and Tufted Neurons in the olfactory bulb as well as in
Medium Spiny Neurons (MSNs) in the striatum. No such effect was observed for cerebellar
Purkinje and hippocampal CA1 neurons. The effects on MC firing appear to be mainly due to
a light-induced increase in tissue temperature, between 0.1 and 0.4°C, associated with the
generation of a hyperpolarizing current and a modification of action potential (AP) shape.
Therefore, light in the visible range can affect neuronal physiology in a cell-specific manner.
Beside the implications for optogenetic studies, our results pave the way to investigating the
use of visible light for therapeutic purposes in pathologies associated with neuronal
hyperexcitability.
Introduction
Since its conception and development at the beginning of this century, optogenetics have
rapidly gained prominence in neuroscience research (Williams & Deisseroth,
2013)(Deisseroth, 2015). This technique uses genetic engineering to selectively express, in
specific neuronal populations, light-sensitive proteins (opsins) initially obtained from
non-mammalian species (Banghart et al., 2004; Boyden et al., 2005). Exposure of the brain tissue
For Peer Review
3
membrane; it then modifies the membrane potential by activating or inhibiting the
opsin-expressing neurons. The most widely used exogenous opsins in optogenetic experiments are
channelrhodopsin 2 (ChR2) and halorhodopsin (NpHR). The first is a cation permeable
channel that can be activated by visible light in the 350-550 nm range (experimentally
activated mostly around 480 nm, blue light); stimulation of ChR2 produces membrane
depolarization and neuronal firing (Gradinaru et al., 2010). The second, NpHR, is a
light-activated ionic pump selective for chloride ions that can be turned on by visible light in the
500-600 nm range (generally activated experimentally around 560 nm, yellow light);
stimulation of NpHR produces membrane hyperpolarization and prevents neuronal firing
(Gradinaru et al., 2010). Light-controlled firing of neuronal cells using optogenetics is
therefore an extremely powerful tool to precisely determine the role of specific neuronal
populations in brain physiology, brain pathology and behavior (Fenno et al., 2011;
Deisseroth, 2015). The interpretation of optogenetic experiments is based on the assumption
that light stimulation selectively acts on those neurons expressing the exogenous opsins;
however, several reports have shown that light can, in some cases, affect the physiology of
naive neurons. While the action of infrared light (wavelength >700 nm) on neuronal
physiology has been known since the early sixties (Arvanitaki & Chalazonitis, n.d.) and is
well documented (Shapiro et al., 2013; Deng et al., 2014), few investigations have examined
the effects of light in the visible spectrum on naive brain physiology. Christie et al. (Christie
et al., 2013) showed that blue laser light stimulation produces an fMRI signal in a rat cortex;
an effect that has been attributed to direct vascular dilatation (Rungta et al., 2017). Moreover,
a recent report showed that in mice, laser stimulation at 532 nm increased the firing activity of
prefrontal cortex neurons, in vivo (Stujenske et al., 2015), depending on light power (~43%
for 10 mW, ~31% for 5 mW and no modification for 1 mW). In both cases, the effect of the
For Peer Review
4
temperature increases depend on wavelength, power and duration and could be attenuated by
reducing the duty cycle of pulse light stimulation (Stujenske et al., 2015). Finally, our pilot
experiments showed that LED stimulation (1 second stimulation with light in 470-570 nm
range, with a power of 13 mW) consistently reduced the firing activity of Mitral Cells (MCs)
recorded in vitro from olfactory bulb (OB) slices (see pilot data at https://osf.io/4fbpt/).
Hence, light in the wavelength and power ranges used for optogenetic experiments appears to
affect neuronal activity even in the absence of exogenous opsins. Investigating this
phenomenon is important for at least two reasons. First, characterization of the action of
visible light on naive neurons is crucial for the interpretation of optogenetic experiments, in
order to exclude non-specific effects. Second, optogenetics requires gene transfection,
limiting its potential therapeutic utilization in humans, for example to prevent or reduce
epileptic seizures(Bentley et al., 2013). This limitation would be avoided if the activity of
naive neurons could be controlled using light and this would open the way to investigating
using visible light for therapeutic purposes.
The goals of the proposed research were the following:
- Reproduce the results reported in the pilot experiment
- Investigate whether and how light-induced inhibition of MC firing is affected by the light’s power, wavelength and duration in in vitro conditions.
- Determine the extent of any temperature modifications produced by light stimulation and so get information on potential correlations between this parameter and
light-induced modifications of firing activity.
- Get insights into the cellular mechanisms of light-induced inhibition of MC firing (role of inhibitory network activity, role of G-protein coupled receptors, modification
For Peer Review
5
of membrane potential (Vm), modification of membrane resistance (Rm)), under in
vitro conditions.
- Determine the effects of visible light on the firing activity of neuronal types other than MCs (hippocampal CA1 pyramidal neurons, cerebellar Purkinje neurons and striatal
medium spiny neurons) under in vitro conditions.
Methods
The experiments were performed in three different laboratories, each working on a different
preparation; namely: C. Beurrier’s IC2N team (IBDM URM7288, Marseille) working on
striatal medium spiny neurons (Striatum); M. Canepari’s MOTIV team (Laboratoire
Interdisciplinare de Physique Grenoble) studying cerebellar Purkinje neurons (Cerebellum)
and N. Kuczewski’s NEUROPOP team (Lyon Neuroscience Research Center, Lyon) using
MCs and tufted cells from the olfactory bulb (OB) as well as hippocampal CA1 pyramidal
neurons (Hippocampus). One of the principal purposes of this project was to determine
whether the effect observed in the preliminary experiments of light on firing activity, is a
generalizable phenomenon and independent of specific experimental conditions; for this
reason, each laboratory worked using its own protocol for slice preparation and cell recording.
The protocols for electrical and optical stimulations (light wavelength and power) of the
neurons were the same in all laboratories.
The team FORGETTING (Lyon Neuroscience Research Center, Lyon) that was
supposed to carry out the experiment in the hippocampus retired from the project after
the stage 1 in principle acceptance. The proposed experiments in the hippocampus were
For Peer Review
6
The detailed experimental procedure (registered protocol), approved in a stage I submission,
is available at https://osf.io/sf3eb/.
Animals
Forty-one male C57Bl6/J mice (Charles River Laboratories, France) aged between 30 and 90
days were used. Mice were housed in groups of five in standard laboratory cages and kept on
a 12 h light/dark cycle (at a constant temperature of 22°C) with food and water ad libitum.
Experimental procedures were in accordance with the European Community Council
Directive of 22nd September 2010 (2010/63/UE) on the care, welfare and treatment of
animals. Procedures were reviewed by the ethics committee affiliated to the animal
facility of the Grenoble university (D3842110001) and Lyon1 university (C2EA).
Electrophysiology.
Olfactory bulb
Animals were anesthetized with an intra-peritoneal injection of ketamine (50 mg/ml) and
decapitated. The head was immediately immersed in ice-cold (2-4°C) carbogenized artificial
cerebrospinal fluid (cACSF; composition: 125 mM NaCl, 4 mM KCl, 25 mM NaHCO3, 0.5
mM CaCl2, 1.25 mM NaH2PO4, 7 mM MgCl2 and 5.5 mM glucose; pH = 7.4) oxygenated
with 95 % O 2/5 % CO2. The osmolarity was adjusted to 320 mOsm with sucrose. The OB
was sliced horizontally (400 µm thick) with a vibratome. Slices were incubated in a recovery
chamber, at 30 ±1°C in the dark, using an ACSF solution with a composition similar to the
cACSF, except that the CaCl2 and MgCl2 concentrations were 2 mM and 1 mM, respectively.
Slices were transferred to a recording chamber mounted on an upright microscope and
continuously perfused with oxygenated ACSF (4 ml/min) at 30 ±1°C. Neurons were
Plan-For Peer Review
7
APOCHROMAT). Data were acquired with an RK 400 BioLogic amplifier at a sampling
frequency of 20 kHz using a 12-bit A/D-D/A converter (Digidata 1440A, Axon Instruments)
and PClamp10Axon Instruments acquisition software. Patch-clamp whole-cell recordings
were done using borosilicate pipettes with a resistance of 4-8 MΩ. The recording pipette was
filled with the following intracellular solution (in mM): 126 K-gluconate, 5 KCl, 10 HEPES,
1 EGTA, 1 MgCl2, 2 ATP-Na2, 0.3 GTP-Na3, and 10 phosphocreatine; pH = 7.3, 290
mOsm). The membrane potential, measured with the patch pipette, was corrected for the
junction potential (-15 mV). Data analysis was performed using OpenElectrophy (Garcia &
Fourcaud-Trocmé, 2009), SciPy, and MySql database software (open source licenses).
Cerebellum
The Prefecture of Isere approved the experiments on cerebellar Purkinje neurons, performed
at the Laboratoire Interdisciplinaire de Physique (Authorisation n. 38 12 01). Sagittal
cerebellar slices (250 µm thick) were prepared from 30–45-day-old C57Bl6 mice following
published procedures (Vogt et al., 2011a, 2011b; Ait Ouares et al., 2016) using a Leica
VT1200 (Leica, Wetzlar, Germany). Slices were cut in iced extracellular solution and
incubated at 37°C for 30 minutes before use. The extracellular solution contained (in mM):
125 NaCl, 26 NaHCO3, 1 MgSO4, 3 KCl, 1 NaH2PO4, 2 CaCl2 and 20 glucose, saturated
with 95% O2 and 5% CO2. The intracellullar solution contained (in mM): 125 KMeSO4, 5
KCl, 8 MgSO4, 5 Na2-ATP, 0.3 Tris-GTP, 12 Tris-Phosphocreatine, 20 HEPES, adjusted to
pH 7.35 with KOH. Experiments were performed at 32-34°C using an Olympus BX51
microscope equipped with a 60X/1.0 NA Nikon objective. Patch-clamp recordings were done
using a Multiclamp amplifier 700A (Molecular Devices, Sunnyvale, CA). The membrane
potential, measured with the patch pipette, was corrected for junction potential (-11 mV) as
For Peer Review
8
Striatum
The methodology for striatum slices preparation differ from what proposed in the
manuscript approved in stage 1. This deviation is due to the fact that the new method increase the cell quality and survival in slices prepared from juvenile/adult mice(Ting et
al., 2014).
30–45-day-old C57Bl6 mice were anesthetized with an intra-peritoneal injection of ketamine
and xylazine (100 and 10 mg/kg, respectively) and transcardially perfused with an ice-cold
N-methyl D-glucamine (NMDG)-based solution containing (in mM): 93 NMDG, 2.5 KCl, 1.2
NaH2PO4, 30 NaHCO3, 20 HEPES, 20 glucose, 10 MgCl2, 93 HCl, 2 Thiourea, 3 sodium
pyruvate, 12 N-acetyl cysteine and 0.5 CaCl2 (saturated with 95% O2 and 5% CO2, pH
7.2-7.4). Immediately after decapitation the brain was removed, chilled in ice-cold oxygenated
NMDG-based solution before cutting coronal slices (250 µm) with a vibratome (Leica,
VT1000S) at 4°C. Slices were immediately transferred to recover in NMDG-based solution at
35°C for 5 min and then stored for at least 1h at room temperature in normal ACSF
(composition (in mM): 126 NaCl, 2.5 KCl, 1.2 MgCl2, 1.2 NaH2PO4, 2.4 CaCl2, 25
NaHCO3 and 11 glucose), to which 250 µM kynurenic acid and 1 mM sodium pyruvate had
been added. For the recordings, slices were transferred one at a time to a submersion-type
chamber and perfused continuously with warm ACSF (32-34°C) at a rate of 3 ml/min. All
solutions are continuously equilibrated with 95% O2 / 5% CO2. Neurons were visualized
using an upright microscope (Nikon Eclipse FN1) equipped with a DIC optic and using a 40x
water-immersion objective. Electrophysiological recordings were made with a Multiclamp
700B amplifier and Clampex 10.6 software (Molecular Devices). Patch-clamp electrodes (4-6
For Peer Review
9
MgCl2, 0.5 CaCl2, 5 EGTA, 10 HEPES, 2 NaATP and 0.5mM NaGTP, 10
Na-Phosphocreatine, pH adjusted to 7.25 with NaOH and osmolarity adjusted to 270-280
mOsm/L.
CA1 areas of the hippocampus
The equipment used for slice preparation differs from that presented in the manuscript
approved in stage 1. Such divergence is due by the fact that these experiments were done
in a different laboratory of that originally planned.
Coronal brain slices (350 µm) were cut from 8–10-week-old C57Bl6 mice with a vibratome
(VT1000S, Leica) and incubated at 33°C for 30 min and then left for at least 30 min at room
temperature in artificial cerebrospinal fluid (aCSF) containing (in mM): 124 NaCl, 10
glucose, 1.25 NaH2PO4, 2.5 KCl, 26 NaHCO3, 1.3 MgCl2, and 2.5 CaCl2 and superfused
with a gaseous mixture (95% O2 and 5% CO2). Slices were transferred to a recording
chamber maintained at 33°C. For whole-cell current-clamp recordings of CA1/CA3
pyramidal cells, the patch pipettes were made of borosilicate glass (~5 MΩ) filled with the
following solution (in mM): 120 potassium methyl sulphate, 10 Na-phosphocreatine, 0.1
CaCl2, 2 MgCl2, 10 HEPES, 1 EGTA and 2 Na-ATP, 0.5 mM NaGTP(300 mOsm, pH = 7.2).
Neurons were visualized using a microscope (Zeiss axioscope) with a 40x objective (Zeiss
Plan-APOCHROMAT). The data were acquired with the RK 400 BioLogic amplifier at a
sampling frequency of 20 kHz using a 12-bit A/D-D/A converter (Digidata 1440A, Axon
Instruments) and PClamp10Axon Instruments acquisition software.
Temperature measurement
Slice and bath temperature were measured and controlled using a ThermoClampTM -1 from
For Peer Review
10
Optical stimulation
Olfactory bulb, cerebellum and hippocampus
With the olfactory bulb two wavelength ranges were used: 1) 430-495 nm peaked at 470 nm
(blue light) using a Dual Port OptoLED, CAIRN, UK, dichroic mirror 495 nm, Zeiss; 2)
470-570 nm peaked at 540 nm (green/yellow light) using a white LED Dual Port OptoLED,
CAIRN, UK with excitation 470 nm high-pass filter and 570 nm dichroic mirror, Zeiss. Only
blue light was used in the cerebellum and hippocampus experiments.
Striatum
Controlled by the acquisition software, blue light (470 nm) was delivered from a Spectra
Light Engine (Lumencor, Optoprim) and connected to the back aperture of the microscope
through a 3 mm liquid-core fiber, producing a wide-field exposure around the recorded cell.
Its power on leaving the microscope objective was measured using a PM100 power meter via
a S130C probe (Thorlabs).
Proposed experiments:
Experimental procedure:
The present project is divided in two stages:
Stage one is aimed at reproducing the results observed in the pilot experiment, namely a
reduction of MC firing frequency produced by light illumination in 470-570 nm range
(green/yellow) during whole-cell recordings (stage 1 manuscript: https://osf.io/sf3eb/,
For Peer Review
11
Stage 1 experiment 1: to determine whether the effect on MC firing activity produced by
light stimulation in 470-570 nm range (green/yellow) depends on light intensity, we will use
three light intensities: 13mW, 5 mW and 1 mW (stage 1 manuscript: https://osf.io/sf3eb/,
figure 4A). The first is the power used in the pilot experiments; the second and the third that
produced an increase or no modification of firing activity in cortical neurons in vivo,
respectively (Stujenske et al., 2015). All these light intensities are commonly used in
optogenetic experiments.
Stage 1 experiment 2: to determine whether the light effect depends on light wavelength, we
will use the same protocol as the one described in experiment 1 but with 430-495 nm light
stimulation (blue).
Stage one analysis:
For each recorded neuron and for each intensity (depicted in figure 4A), the effect of light will
be assessed by a statistical comparison between the number of spikes in NO LED and LED
conditions, using a paired unilateral test. For each comparison, the results will be reported as
shown in figure 2B. The sample size for this experiment is based on the pilot experiments. As
shown in figure 2 D, the estimated effect size of light on MC firing is ES= -0.9. Using this
value as target effect size, we have chosen the sweep sample size, i.e. the number of traces
acquired for each neuron recorded (see stage 1 manuscript: https://osf.io/sf3eb/ fig 1A, 2A),
to be n=30. This value predicted a statistical power of 0.999. It should be noted that even if
the real ES is closer to the lower limit of the 95% CI (ES=-0.6), the statistical power is still
above 0.9 (ES=0.94). The authenticity of the effect will also be assessed by assuming that the
null hypothesis, i.e. “light has no effect”, is true and by computing the probability to have
observed by chance at least n statistically significant results over N total comparisons. This
probability value is obtained by the following equation:
For Peer Review
12
Where p=0.05, N =the total number of recorded neurons and n= the number of neurons for
which the p-value is <0.05. For our pilot experiment, where N=11 and n=7 (see stage 1
manuscript: https://osf.io/sf3eb/,figure 2B), this probability is equal to 2*10-7. In other
words, the probability that the observed significant results are due exclusively to a repetition
of type I error is 2*10-7. Three populations analyses, one for each intensity, will be made by
comparing the average number of spikes of each recorded neuron in the NO LED condition to
the average number of spikes in the LED condition. The result will be presented as % of
modification, i.e. (average spike LED-average spike NO LED)/average spike NO LED, such
as in figure 2E).
The size effect of the population analysis showed in figure 2E is ES=-1.07. Using this
estimation as a target ES, a sample size of 20 neurons gives a predicted statistical power of
0.998.
It should be noted that we expect to reduce the effects of light on MC firing by decreasing
light power and by increasing light wavelength [10,11]; what would probably reduce the ES
when using a light power lower than 13 mW (the one used in the pilot experiments). For n=30
sweeps in the neuron by neuron analysis and n=20 neurons in the population analysis, the
statistical power becomes lower than 0.9 for ES < 0.54 and ES < 0.68, respectively.
However, the utilization of equation 1 will still allow to reliably detect genuine light effects
even for much lower effects size. For example, with an ES=0.2 the statistical power on
neuron by neuron analysis is 0.28. By repeating the experiment 20 times (20 recorded
neurons) we should expect to observe ~ 5 neurons over 20 for which the p-value<0.05.
Replacing these values in equation 1 give a probability of 0.002. Since this is the probability
that the observed significant effects are due exclusively to a repetition of type I error, such
For Peer Review
13
Stage two will be performed only if stage one will reproduce the results of the pilot
experiment. This stage is aimed to investigate: a) the physical and physiological mechanisms
of light effects on neuronal firing. b) Whether light effect on MC firing is a phenomenon
generalizable to other neuronal types. For stage two, light wavelength and power will be those
that produced the maximum effect in stage 1 experiments. The sample size will be determined
upon knowledge of stage 1 results as follows: the neuron analysis and population analysis
ES’s, observed in the experimental condition (light power and light wavelength) that produce
the maximal effect in stage one, will be used to determine the number of sweeps and the
number of neurons that give a statistical power equal to 0.95.
Experiment 4 bis, 6,7 and 8 should be considered exploratory. No statistical power is
estimated a priori.
Stage 2 experiment 1-2: The goal is to determine whether the light-induced modification of
MC firing is due to temperature changes.
Stage 2 Experiment 1: Determine the slice temperature modification produced by LED
stimulus. The experiment will be performed by putting a temperature probe in the slice. The
protocol is depicted in figure 4 B of stage 1 manuscript: https://osf.io/sf3eb/. Statistical
effect will be assessed by paired unilateral test between the average slice temperature
measured for one second (TCtr) before light stimulation and the average slice temperature
measured during one second of light stimulation (TLED). No electrophysiological recording
will be made. For this experiments the two wavelengths of stage 1 will be used. This will
allow to correlate an eventual difference between blue and yellow light effects, observed in
stage 1, with an eventual difference in their hitting effects.
Stage 2 Experiment 2: Determine the impact of the slice temperature modification produced
by LED stimulus (measured in experiment 1) on MC firing. The protocol is depicted in figure
For Peer Review
14
chamber will be modified while performing CC recording on MC. Statistical effect will be
assessed by umpired bilateral test between the number of action potentials elicited in TCtr1 and
the number of action potentials elicited in the condition TLED spike. The number of action
potentials elicited in the condition TCtr2 will be evaluated to assess the reversibility of an
eventual effect produced by the temperature modification. No LED stimulation will be made.
MC will be recorded in the same dark ambient light condition used for the other experiments.
Stage 2 experiment 3: The goal is to determine whether the effect of light on MC firing
depends on light duration. The protocol used is depicted in figure 4D. The number of spikes
in LED1, LED2 and LED3 condition will be compared using ANOVA (repeated measures)
followed by post hoc paired test. Paired test comparisons between NO LED and LED1
conditions will be performed in order to make sure of the presence of the light effect.
Unilateral test will be used.
Stage 2 experiment 3 bis: The goal is to determine the modification of slice temperature
produced by increasing light duration. These results will be correlated to the eventual
differences on MC firing activity produced by the modification of light duration (Stage 2
experiment 3). The protocol is similar to that described in Stage 2 Experiment 1 and figure 4B
of stage 1 manuscript: https://osf.io/sf3eb/ with TLED measured in the last second of light
stimulation.
Stage 2 experiment 4: The goal is to determine whether the effect of light on MC firing is a
consequence of light-induced increase of inhibitory interneurons activity. The same protocol
used in the pilot experiments (stage 1 manuscript: https://osf.io/sf3eb/, figure 2A) will be
used but with LED stimulation at the power and wavelength that produced the maximal effect
in stage 1 experiments and in the presence, in the extracellular solution, of the GABAA
receptors antagonist SR-95531 (Gabazine, 5 µM) and of the GABAB receptors antagonist
For Peer Review
15
comparison between the number of spikes in the NO LED and LED conditions, using a paired
unilateral test. Population analysis will be performed as previously described.
Stage 2 experiment 4 bis : This experiment will be performed only if, in Stage 2 experiment
4, Gabazine will prevent the light-induced reduction of MC firing. The same protocol
described in stage 2 experiment 4 will be used but while recording from Granuler Cells (GC).
For each recorded neuron, light effect will be assessed by a statistical comparison between the
number of spikes in the NO LED and LED conditions, using a paired bilateral test. Population
analysis will be performed as previously described.
Stage 2 experiment 5: The goal is to determine whether the effect of light on MC or GC
firing is mediated by the activation of G-protein-coupled receptors. For this reason, the same
protocol used in the pilot experiments (stage 1 manuscript: https://osf.io/sf3eb/, figure 2A)
will be used with LED stimulation at the power and wavelength that produced the maximal
effect in stage 1 experiments. However, in order to block G protein activity, we will replace
the GTP-Na3 in the intracellular solution with 2 mM of the non-hydrolyzable GDP analog
Guanosine 5′-[β-thio]diphosphate trilithium salt (GDPβS), a G protein inhibitor. For each
recorded neuron, light effect will be assessed by a statistical comparison between the number
of spikes in the NO LED and LED conditions, using a paired unilateral test. The cellular type
recorded in this experiment will depend on the outcome of stage 2 experiment 4. If GC is
recorded, the sample size will be determined based on the effect size calculated from stage 2
experiment 4bis, to give a statistical power equal to 0.95.
Stage 2 experiment 6: The goal is to determine whether the light modifies neuronal
membrane conductance and/or membrane resistance (Rm). The experiments will be
performed in voltage-clamp configuration with neurons maintained at -60 mV. The protocol is
depicted in figure 4C. The effect of light on holding current will be quantified by comparing
For Peer Review
16
stimulation (LED1). Light effect on Rm will be assessed comparing Rm in No LED to Rm in
LED2. Rm is calculated according to Ohm’s law R=V/I; where I is median current in the last
100 ms of hyperpolarizing step and V=-5mV. Statistical effect will be assessed by paired
bilateral test. The cellular type recorded in this experiment will depend on the outcome of
stage 2 experiment 4. If GC is recorded, the sample size will be determined based on the
effect size calculated from stage 2 experiment 4bis, to give a statistical power equal to 0.95.
Stage 2 experiment 7: The goal is to determine whether the light modifies the membrane
potential (Vm) and/or the action potential (AP) parameters. The experiments will be
performed in current-clamp configuration at resting membrane potential or after slight
hyperpolarization to prevent spontaneous firing. The protocol is depicted in figure 4E. Light
effect on Vm will be assessed by comparing the average Vm in the control period (1 second
before light stimulation) to the average Vm during 1 second of light stimulation (LED1).
Statistical effect will be assessed by paired bilateral test. Light effect on AP will be assessed
by generating a single action potential by a 5 ms positive current injection both in the absence
(NO LED) and presence (LED) of light. Two AP parameters will be evaluated: AP amplitude,
calculated as the difference between AP peak and the average Vm in the 100 ms that precedes
the current step, and AP latency, calculated as the time between the beginning of the current
step and AP peak(Duménieu et al., 2015). Statistical effect will be assessed by paired bilateral
test. For the experiments on AP, the α risk, corrected for multiple comparison (2), will be α
=0.025. The cellular type recorded in this experiment will depend on the outcome of stage 2
experiment 4. If GC will be recorded, the sample size will be determined based on the effect
size calculated from stage 2 experiment 4bis, to give a statistical power equal to 0.95.
Stage 2 experiment 8: Determine the light effect on the firing activity of tufted cells in the
OB, hippocampal CA3/CA1 pyramidal neurons, cerebellar purkinje neurons and striatal
For Peer Review
17
The same protocol used in the pilot experiments (stage 1 manuscript: https://osf.io/sf3eb/,
figure 2A) will be used but with LED stimulation at the power and wavelength that produced
the maximal effect in stage 1 experiments. For each recorded neuron, light effect will be
assessed by a statistical comparison between the number of spikes in the NO LED and LED
conditions, using a paired unilateral test. Population analysis will be performed as previously
described. For each of the cellular types investigated the results will be graphically presented
as in figure 2. For these experiments, the α risk, corrected for multiple comparison (4), will
be α =0.0125 and the sample size will be adapted to keep the statistical power=0.95.
Statistics:
Statistical comparisons will be performed using parametric or non-parametric tests depending
on the normality of distributions, which will be assessed by D’Agostino Pearson test: a paired
t-test or a Wilcoxon signed-rank test will be used for normal and non-normal distributions,
respectively. Since our working hypothesis is that light produces a decrease of neuronal
firing, as shown by the pilot data, unilateral test will be used to compare the light effects on
neuronal firing. Experiments in which no a priori hypothesis is made (light action on Vm, Rm
and AP parameters), data will be compared using a bilateral test. For normally distributed data
the ES is calculated as Cohen’s d effect size (the mean of the sample difference divided by the
standard deviation of sample difference). For non-normal data distributions, the effect size r is
calculated using Kerby simple difference formula (Kerby, 2014) as follow: r=(S-t)/S - t/S,
where t= the test statistic, is the minimal rank sum; S is the total rank sum and S-t is the
maximal rank sum. The 95% CI for the Choen d ES is calculated using the ci.sm function of
the R MBESS package. Statistical power and sample size are calculated by using G*Power
3.1.9.2 (Faul et al., 2007) (Dusseldorf university). Results are presented using the following
notation a[b,c] where a is the data average and b and c the lower and the higher limit of 95%
For Peer Review
18
manuscript: https://osf.io/sf3eb/, figure 3. Bayesian statistics were performed using Jasp
software (JASP Team (2017). JASP (Version 0.8.5)[Computer software])
Exclusion criteria
Cells were excluded from experiments when i) their resting membrane potential (Vrest) was
above -50 mV, ii) when the step depolarization in the no-LED condition did not elicit at least
10 action potentials (AP), ii) when the starting Vm (calculated in the 100 ms preceding the
depolarizing current step) in the no-LED condition differed by more than 5 mV from the
starting Vm in the LED condition or iv) when the access resistance was higher than 50 MΩ.
Cells were a priori excluded from the analysis when the defined sweep sample size was not
reached due to a loss or degradation of neuronal whole-cell recording i.e. for experiments
performed in the current-clamp configuration a depolarization of Vrest above 50 mV and for
the voltage-clamp condition an access resistance greater than 50 MΩ.
Results
All electrophysiological raw traces and data analysis are accessible on the Open Science
Framework web site (https://osf.io/mrw93/).
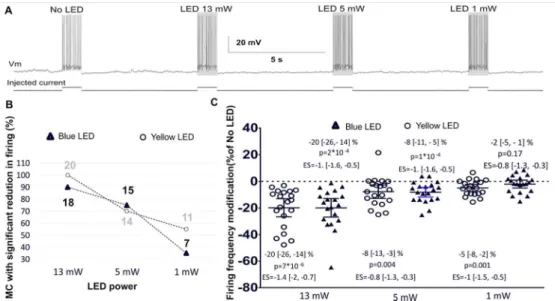
Changes in MC firing with light power (Stage 1 experiments 1-2)
In order to assess whether the light-induced reduction in MC firing activity observed in the
preliminary data depends on light wavelength and/or power we applied the protocol depicted
in figure 1A for two different stimuli, 430-495 nm light (blue LED) and 470-570 nm light
(green/yellow LED) (n=20 MC for each type of stimulus, 5 animals). As shown in Figure 1
(see https://osf.io/ejh2u/, https://osf.io/fpd6y/ for the experimental design and supplemental
analysis), the reduction in firing frequency produced by LED-stimulation decreased at lower
power intensities for both the wavelengths used (power effect: blue LED p<0.001, F=33;
For Peer Review
19
neurons affected by the light (Fig 1B) as well as to the average effect of the light on the MC
population (Fig 1C). While green/yellow light produced a significant reduction in firing at all
powers tested, statistical comparison failed to show a significant reduction in MC firing when
blue light was used at 1 mW (p=0.17). It should however be noted that under this condition
we still observed a significant decrease in firing in 35% of recorded neurons. Applying
equation 1 shows that the probability of such a decrease being observed only by chance is
p=3*10-5 suggesting that the absence of a significant effect in the population analysis is likely
due to type II error consequent to a lower effect size at this light power. Comparison of the
effect at different wavelengths did not show any difference between blue and green/yellow
lights (p=0.75, F=0.1 ANOVA). The Bayesian statistics for this analysis are shown in table 1.
A decline in MC firing due to dialysis of intracellular components in whole-cell recordings
could sometimes be observed in our experiments. To check whether this phenomenon
contributed to reduction in MC firing when stimulated with light, we made a paired
comparison between LED firing of trace acquisitions n and the no-LED firing of trace
acquisitions n+1 (shifted analysis). As shown in the exploratory analysis presented in supplementary figure 1, the results produced by the shifted analysis do not qualitatively differ
from those of a normal analysis, indicating that cell dialysis did not impact the quantification
of the effect of light on firing activity.
The increase in temperature produced by light is able to inhibit MC firing (Stage 2 experiments 1-2)
The parameter most likely affected by light is temperature. Temperature changes produced by
LED stimulation were measured by approaching a temperature probe to the top of OB slices.
As shown in figure 2 (A, B),a rapid and gradual increase in temperature was observed during
a 1 s exposure to light. The mean temperature increased linearly with power for the two
For Peer Review
20
repeated measurement ANOVA). By plotting the effect of light on MC firing vs. the effect of
light on tissue temperature (Fig 2C), a linear covariation of these two parameters was
observed, suggesting that light-induced temperature modification and firing reduction are
correlated. To confirm this link between temperature and firing, we tested whether variations
in temperature affected MC firing frequency by increasing the bath temperature in the
recording chamber while monitoring firing activity induced by current pulses, in the absence
of light. The average increase in bath temperature was 0.44 ± 0.04 °C, i.e. similar to that
produced by 1 s LED stimulation at 13 mW. A gradual decrease in firing frequency was
produced by heating the recording solution (Fig 3A, n=14 MC, 5 animals). The effect of
temperature was long-lasting and partially reversed 5 minutes after restoration of the initial
bath temperature (Fig 3A). The decrease in firing was significant in 92% of the recorded MCs
(Fig 3B). On average, the temperature increase modified MC firing by -16 [-6, -26] % (Fig
3C), similar to the decrease in firing activity produced by a 1 s LED stimulation at 13 mW
(see Fig 1 and Fig 2C). All these data suggest that the effects of light on MC firing are mainly
due to light-induced temperature increases. In the following experiments, only blue light at 13
mW was used and the sample size was determined from the results shown in figure 1. Since
the effect size (ES) for the action of light on single MCs is -1 [-1.2-0.8] in cell-by-cell
analysis, the number of sweep repetitions required to reach a statistical power = 0.95 is n=13.
The ES for population analysis is -1.07 [-1.62-0.51] and the number of recorded neurons to
attain a statistical power of 0.95 is n=11, except for experiments illustrated in figure 12, where
correction for multiple comparisons required n=16 neurons to attain a power of 0.95.
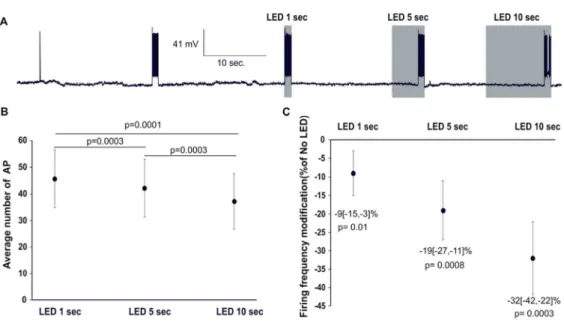
MC firing increases with duration of light stimulus (Stage 2 experiments 3-3bis)
To determine whether the impact of light stimulation on firing activity depends on its
duration, we used the protocol depicted in Fig 4A. Unexpectedly, many neurons showed a
For Peer Review
21
in the no-LED condition when the procedure was repeated. This reduced firing could not be
prevented by bringing Vrest to its initial value through steady current injection, or by
increasing the depolarizing stimulus (for an individual example, see supplementary Figure 2).
Both the Vm hyperpolarization and firing reduction persisted until the end of the recording
session, suggesting that light can sustainably impact cellular physiology in addition to its
acute effect on firing during light stimulation. Such long-lasting effects were not observed
with short stimuli (1s, figure 1). These effects prevented us from using the number of
repetitions compatibles with the exclusion criteria, i.e. at least 10 action potentials in the no
light stimulation condition. Consequently, we reduced the number of repetitions required for a
cell to be accepted from n=13 to n=10, but thereby reducing the statistical power to detect the
effect in cell-by-cell analysis to ~0.90. Applying these new criteria, we observed a significant
decrease in evoked APs for all light durations (1, 5 and 10s) but that was more pronounced at
longer durations (Fig 4B, C, n=11 MC, 4 animals). We used shifted analysis to assess
whether the long-lasting effects of light (irreversible Vm hyperpolarization and firing
reduction) impact the evaluation of its acute effects (reduction in firing during light pulses)
(exploratory analysis, supplementary Figure 3). In this condition, a significant reduction in
firing was only observed with 10s light pulses showing that the long-lasting effects mask the
acute effects of short pulses. It should however be noticed that, despite the decline in firing,
the number of AP during 10-second light stimulation of acquisition trace n is significantly
lower than that observed during the 1-second light stimulation of acquisition trace n+1
(supplementary figure 3B), suggesting that acute light effect increased with light duration. We
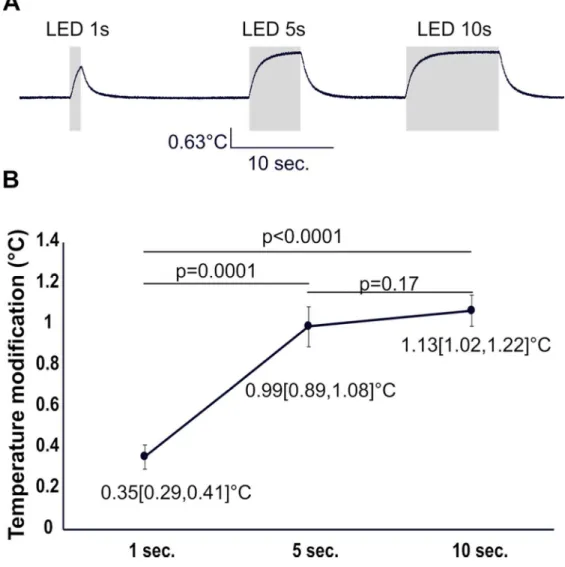
next wondered whether the long-lasting effects of light were also related to temperature
changes. Slice temperature increased with increasing light duration (p < 0.0001; ANOVA),
but such an increase was not significant between 5 and 10s LED stimulations (Fig 5A,B;
For Peer Review
22
temperature increase we observed (around 1°C) is in the range of the physiological
fluctuations of the brain (Andersen & Moser, 1995) or of the bath temperature during in vitro
slice experiments. It is therefore very unlikely that the long-term alterations of the
physiological properties of MC by lengthy light stimuli are related to temperature
modifications.
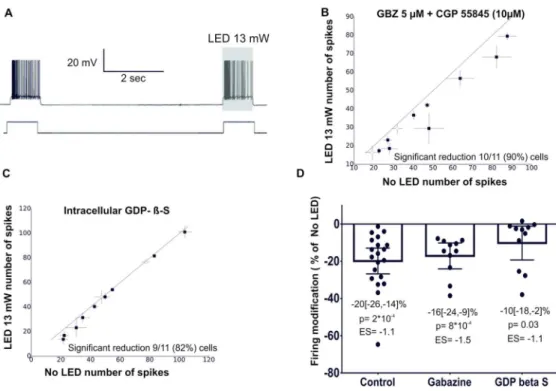
The effect of light on MC firing does not depend on the inhibitory network and is partially reduced by blocking G protein activity (Stage 2 experiments 4-5)
Temperature can affect MC firing indirectly, for example by increasing the inhibitory synaptic
inputs projecting on these neurons. In agreement with this hypothesis, a light-induced increase
in olfactory bulb temperature would be responsible for increasing inhibitory interneuron firing
that, in turn, would reduce MC activity. This hypothesis is compatible with the differences in
temperature sensitivity observed among different neuronal subtypes (Kim & Connors, 2012).
We tested whether the reduction of MC firing when stimulated was due to a
light-induced increase of inhibitory activity. This was explored in the presence of GABAA and
GABAB receptors antagonists SR-95531 (Gabazine, 5 µM) and CGP 55845 (10 µM). Under
this condition, light stimulation still reduced MC firing (Fig 6B, n=11 MC, 1 animal), with
an effect that was comparable to that observed when inhibitory network activity was intact
(Fig 6D, Table 3). Hence, the inhibitory network is not involved in the light-induced decrease
in MC firing. Extra-retinal photoreceptors expressed in mammal brain neurons (Blackshaw &
Snyder, 1999; Kojima et al., 2011; Nissilä et al., 2012; Fernandes et al., 2013) may
participate in this effect on MC firing. Since these neuronal opsins are G-protein-coupled
receptors, their possible involvement can be investigated by blocking G-protein signaling, the
intracellular target of the photoreceptors. This was achieved by replacing GTP with the
non-hydrolyzable GDP analog (GDPβS) in the patch pipette solution. As shown in fig 6C,in this
For Peer Review
23
(n=11 MC, 2 animals) , although we observed a slight reduction of the effect of light (Ctr vs.
GDPβS ES = 0.68; p=0.032, Man-Whitney test not corrected for multiple comparisons; fig 6D
and table 3 for Bayesian analysis). This result suggests that activation of encephalopsins could
contribute to the reduction in MC firing caused by light, but further investigations are required
to confirm this observation.
Light stimulation generates an outward current associated with membrane hyperpolarization (Stage 2 experiments 6-7)
We next investigated the effect of short light stimulation on membrane currents and Vrest. As
shown in figure 7, LED stimulation (13 mW, 1s) produced a small (4.8 [1.6, 8] pA) but
consistent outward membrane current in MCs recorded at -60 mV in the voltage-clamp
configuration (Fig 7 A-C, n= 11 MC, 2 animals) and a small membrane hyperpolarization in
the current-clamp configuration (-0.6[-0.8,-0.4] mV, Fig 7 D-F, n=11 MC, 2 animals). While
performing these experiments, we noticed a decrease in spontaneous synaptic events during
light stimulation in some MCs (Fig 7A, 7D and supplementary fig 4).This synaptic activity is
probably excitatory as the reversal potential of GABAergic transmission was -70 mV in our
experimental conditions. One could imagine that the membrane potential modifications
observed in the average traces lay behind the suppression of spontaneous excitatory activity
by the light but this cannot hold true since the effects on membrane current and voltage were
still observed in the presence of the antagonists of synaptic transmission NBQX and APV
(unpublished data, but see https://osf.io/pwdjv/,https://osf.io/9k7xj/, and
https://osf.io/vrm35/).
The effect of light on membrane resistance (Rm) was evaluated by quantifying the current
modification produced by a 1-second hyperpolarizing step of 10 mV (Fig 8A; see
https://osf.io/ejh2u/ experiment 6). As illustrated in fig 8B and 8C an apparent increase in Rm
For Peer Review
24
the outward current depicted in figure 7 only by supposing that the light blocks an unknown
steady depolarizing current. Moreover, an increase in Rm is likely to produce an increase in
firing when stimulated, instead of the decrease we observed in MC. We therefore believe that
the observed increase is likely due to the fact that our protocol is reliable only in a steady-state
condition. Since light stimulation activates an outward current, the latter needs to be
subtracted from the current required to produce the voltage step (fig 8 D, blue traces) in order
to obtain a correct estimation of Rm; this would otherwise be underestimated.
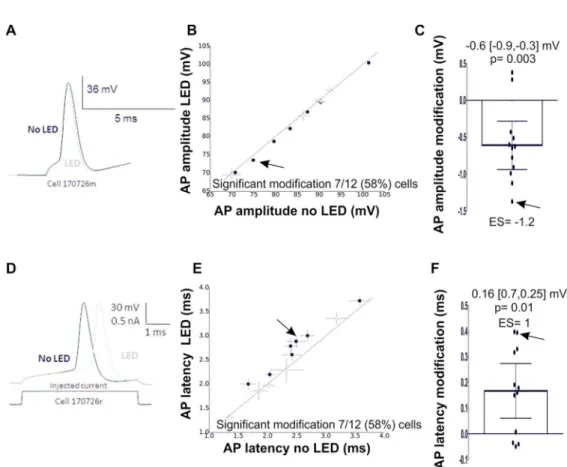
Light stimulation increases AP latency and reduces AP amplitude (Stage 2 experiment 7)
To determine whether LED stimulation has a direct effect on the cellular mechanisms
participating in AP generation, a single action potential was produced by a short (5 ms)
injection of current in the absence of light and at the end of a 1 s LED stimulation. Analysis
of the effect of light on a single AP showed a small reduction in both AP amplitude (-0.6[-0.9,
-0.3] mV compared to the control condition; Fig 9 A-C, n=11 MC, 2 animals) and AP
latency calculated from the beginning of current injection (0.16 [0.25,07] ms compared to the
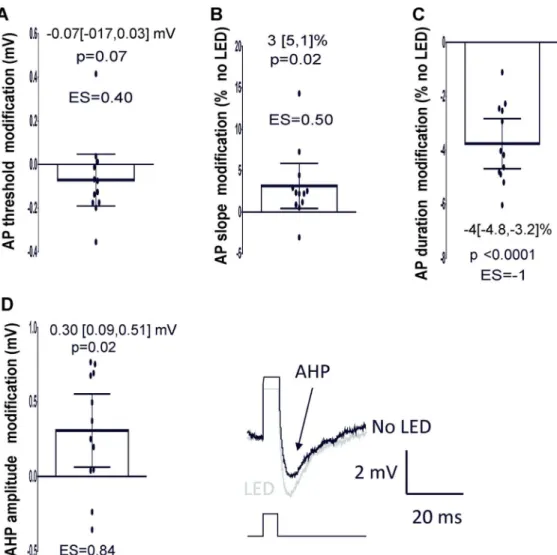
control condition; Fig 9 D-F, n=11 MC, 2 animals). Additional exploratory analysis
suggested that the AP threshold, rising slope, half-width and afterhyperpolarization (AHP)
were also affected by light. Light shifted the AP threshold to more negative membrane
potentials and triggered a small increase in the rising slope (Fig 10 A and B). On the other
hand, the half-width of the AP was reduced and the AHP increased (Fig 10 C and D, n=11
MC, 2 animals). As all these parameters mainly depend on sodium and/or potassium channel
activation or inactivation (Hodgkin & Huxley, 1952; Sah & Faber, 2002; Bean, 2007;
Platkiewicz & Brette, 2010), we can reasonably postulate that light affects AP generation
through a modification of Na+ and K+ channels but further experiments are required to
confirm such an interpretation.
For Peer Review
25
Finally, we analyzed whether the firing reduction produced by blue light stimulation on MC
was generalizable to other neuronal types using the protocol illustrated in figure 6A with
tufted cells in the OB, medium spiny neurons in the striatum, cerebellar Purkinje neurons and
hippocampal CA1 pyramidal neurons. As shown in figure 11, LED stimulation produced a
significant reduction in firing activity in tufted cells (n= 16, 4 animals) and medium spiny
neurons (n=16, 8 animals) but not in cerebellar Purkinje (n=16, 4 animals), or CA1
hippocampal neurons (n=16, 3 animals) . The possibility that the firing reduction observed in
striatal medium spiny neurons was produced by a refractory period was investigated by
applying two consecutive depolarizing steps in the absence of LED stimulation. In this
condition, no firing reduction was observed (n= 16, unpublished results). We noticed that
light stimulation produced, in some neuronal types, a modification of the AHP that follows
the depolarizing step. To quantify the amplitude of the AHP we subtracted the average Vm in
the 100 ms preceding the depolarizing step from the minimum value of Vm in the 500 ms that
followed the depolarization. Exploratory analysis of this parameter showed a significant
light-induced increase in AHP amplitude in tufted cells (no-LED -3.8 [-4.7, -2.7] mV; LED -
4.1 [-5.1,-3.1] mV ,n=16) and a reduction in hippocampal CA1 pyramidal neurons (no-LED
-4.9 [-5.5, -4.3] mV; LED -4.6 [-5.3, - 3.9] mV, n=18). No effect was observed in MC
(noLED 1.9 [2.3, 1.5] mV; (noLED 2.0 [2.4, 1.6] mV, n=20) or Purkinje neurons (no(noLED
-1.9 [-2.3, -1.5] mV; LED -1.7 [-2.0, -1.4] mV, n=18) (Fig 12). Although MSNs do not
express AHP in normal conditions a significant negative shift of the membrane potential
following the depolarizing step was observed after light stimulation (noLED 0.17 [0.07,
-0.27] mV; LED -0.39 [-0.53, - 0.26] mV, n=17; Fig 12). These results suggest that light can
have opposite actions on membrane properties depending on the neuronal type.
For Peer Review
26
The results presented in this report show that light stimulation, in the wavelength and power
ranges commonly used for optogenetic experiments, can modify neuronal firing activity
depending on light power and cellular type. They suggest that such effects are mainly due to
the increase in tissue temperature and they highlight some of the biophysical mechanisms that
might be involved.
Light’s action on MC neuronal physiology is mainly due to a temperature modification
Three lines of evidence suggest that the main factor responsible for the light-induced
reduction of MC firing is an increase in temperature of the brain tissue:
1- The reduction of neuronal firing produced by light correlates with the light-induced modification of tissue temperature.
2- The modification of tissue temperature produces a reduction of MC firing similar to that produced by light stimulation.
3- The light-induced modifications of membrane potential and action potential parameters are compatible to those produced by temperature modifications reported in
the literature.
We have shown that tissue temperature linearly increases with light power reaching an
average value of 0.4°C at 13 mW. Such an increase is in the range predicted in the model
proposed by Stunjenske et al. for the effect of light in in vitro preparations see (Stujenske et
al., 2015) fig 3C. When looking at the effect of light on MC firing, a significant reduction
was observed even when using a power of 1 mW, a condition producing a temperature
increase less than 0.03°C. The linear covariation between temperature and firing
modifications with light power supports the hypothesis that even at this low light-intensity
there is a reduction in firing with increasing temperature, suggesting that neuronal physiology
can be affected by extremely small variations of brain temperature. A theoretical model
For Peer Review
27
2015); here no significant differences were found between the two wavelengths used. At least
three factors could account for this discrepancy: a) the partial overlapping of wavelength
bandwidth used in the present study; b) the difference in temperature absorption of in vitro vs.
in vivo tissue slices (Yaroslavsky et al., 2002; Johansson, 2010); c) an unspecified/unknown
factor not taken into account by the model; see (Senova et al., 2017) fig 4. Brain slice
temperatures increased with the duration of light stimulation reaching a steady state after
approximately 5 seconds. Such an increase in temperature is associated with a reduction in
firing. Interestingly, we found that prolonged light stimulation of MCs produced a persistent
membrane hyperpolarization associated with a decline in firing. As pointed out before, it is
unlikely that these effects are due to tissue warming (~1°C) associated with long-lasting LED
stimulation. Neither can they be due to prolonged warming (10 seconds), since Vm
hyperpolarization and the strong decline in firing were not observed when bath temperatures
were increased in the absence of light (see fig 3A). This suggests a direct effect of light on
neuronal physiology when prolonged light stimulation is used. Membrane hyperpolarization
and declining firing could be due to a slow recovery of physiological activity after light
stimulation or to a persistent neuronal alteration, possibly due to phototoxicity. It has been
proposed that vestiges of non-visual photoreceptors in the mammalian brain can affect
neuronal physiology (Kojima et al., 2011; Fernandes et al., 2013). Our results suggest that
activation of encephalopsin could participate in this reduction in MC firing during visible
light stimulation (fig 5). However, the statistical evidence is weak (Bayes factor =1.14;
p=0.032) and more robust results are required to support this evidence. Moreover, we did not
observe any light-induced modifications of firing in the Purkinje cells, a neuronal type that
strongly expresses encephalopsin (Blackshaw & Snyder, 1999). Our results cannot exclude
For Peer Review
28
than firing activity, as well as the possible role of these opsins when stimulated by ultraviolet
light (Kojima et al., 2011).
Biophysical explanation for the effect of light
The effect of light on membrane properties and action potential parameters were investigated
with MCs.
LED-stimulation generated an outward current producing a small but consistent membrane
hyperpolarization, an increase in AP latency and a decrease in AP amplitude. Moreover, our
exploratory analysis suggests that light stimulation increases the AP rising slope, reduces AP
duration and increases the post-spike AHP. Assuming that the observed effects are due to
light-induced temperature modifications, it is worth discussing the present results by taking
into account the effects produced by temperature variations on neuronal physiology as
reported in the literature. A temperature increase has shown to affect neuronal Vrest in
different ways, depending on the brain structure and the animal species. In guinea pig
hippocampal CA1 pyramidal neurons held at different temperatures (27°C or 37°C), no
significant modifications of Vrest were observed (Thompson et al., 1985), while in mouse
hippocampal neurons, heating from 30°C to 41°C produced a membrane depolarization
between 0.8 and 1.5 mV/°C, depending on the neuronal type recorded (Kim & Connors,
2012). Conversely, a temperature increase from 12°C to 31°C in a rat visual cortex produced
a membrane hyperpolarization of -1.3 ± 0.09 mV/°C (Volgushev, Vidyasagar, Chistiakova, &
Eysel, 2000; Volgushev, Vidyasagar, Chistiakova, Yousef, et al., 2000), a result similar to
ours with MCs. This result is comparable to the estimated voltage/temperature modification
in the present study (-0.6mV/0.34°C= -1.7 mV/°C). A temperature increase was also shown
to affect AP shape in a similar way to that produced by LED-stimulation of MCs. In
particular, a decrease of AP amplitude and duration with increasing temperature was observed
For Peer Review
29
Chistiakova, Yousef, et al., 2000), as well as an increase in AP latency (Volgushev,
Vidyasagar, Chistiakova, Yousef, et al., 2000), rising slope (Thompson et al., 1985) and a
decrease in spike threshold (Volgushev, Vidyasagar, Chistiakova, Yousef, et al., 2000). The
biophysical mechanisms associated with temperature changes were minutely analyzed by
Volgushev et al. who suggest that the modification in Vrest is mainly due to an increase of the
ratio for the permeability of the potassium and sodium leak channels (Volgushev, Vidyasagar,
Chistiakova, Yousef, et al., 2000). It should be noted that a temperature dependent increase in
the activity of the Na+-K+ pump could also contribute to the observed membrane
hyperpolarization(Bates & Mackillop, 1985). On the other hand the modification of AP shape
with changing temperature has been ascribed to an increase in amplitude, duration and
steepness of voltage dependent potassium currents and to an increase in amplitude but a
decrease in the width of voltage-dependent sodium currents (Volgushev, Vidyasagar,
Chistiakova, Yousef, et al., 2000) . Similar mechanisms could explain the effect of light on
the AP shape in MCs, as well as the observed increase of the fast AHP, mainly due to the
activation of voltage-dependent potassium channels in these neurons (Duménieu et al., 2015).
Even though evaluating the effect of light on synaptic transmission was behind the objectives
of the present study and requires further investigation, a consistent decrease of putative
spontaneous glutamatergic activity was observed in several recorded MCs. A reduction of
excitatory synaptic activity could be the consequence of the decrease of spontaneous firing on
neighboring MCs and tufted cells as well as the consequence of the reduction of their AP
duration and amplitude (Geiger & Jonas, 2000; Rama et al., 2015). A direct effect of heat or
light on neurotransmitter release probability and/or postsynaptic-receptor activation, could
also be implicated in the observed effect (Volgushev, Vidyasagar, Chistiakova, & Eysel,
For Peer Review
30
The reported effects of light on MC membrane potential, AP proprieties and synaptic activity
could all account for the observed reduction of spontaneous and evoked firing activity
produced by LED stimulation. Indeed, the outward current so generated would bring the
membrane potential away from spike threshold and, although our experimental design did not
allow us to evidence this, would probably result in reduced membrane resistance with a
consequent reduction in neuronal excitability. This latter hypothesis is in line with the
reported reduction of membrane resistance produced by a temperature increase (Thompson et
al., 1985; Volgushev, Vidyasagar, Chistiakova, Yousef, et al., 2000). The increase of AP
latency and AHP amplitude would also promote a reduction in firing in MCs (Duménieu et
al., 2015). Finally, the apparent reduction of glutamatergic transmission and in particular the
recurrent synaptic excitation, will also lead to a reduction in MC firing (Salin et al., 2001).
We found that LED-stimulation affects both firing activity and AHP amplitude in different
and even opposing ways, depending on the neuronal type. Interestingly the light-induced
decrease in AHP that we observed in mouse CA1 pyramidal cells is reminiscent of the
temperature-induced decrease of the AHP observed in guinea pig CA1 neurons (Thompson et
al., 1985). In the latter report the AHP reduction was associated with a decrease in firing
adaptation. In the present study we did not evaluate the effect of light on CA1 firing
adaptation, focalizing our attention only on the average firing activity, but the raw traces of
our experiments are available at https://osf.io/kp34r/. Interesting too the exploratory analysis
suggests that in MCs, LED- stimulation increases AHP amplitude following a single AP (Fig
10 D) but not a long depolarizing step (Fig 12). If confirmed these results suggest that light
would act differentially on the potassium channels participating in early and medium AHP
(Sah & Faber, 2002). The heterogeneity of the action of light on different neuronal types and
parameters is reminiscent of the heterogeneous effect produced by temperature modification
For Peer Review
31
experimental conditions and/or the biophysical characteristics of the different neuronal types
(Kim & Connors, 2012).
Conclusions
The results of the present study have three main implications.
The first concerns the ability of optical stimulation, in the range used for optogenetic
applications, to affect the neuronal physiology of wild-type neurons. Our results are in
agreement with a previous report showing the sensitivity of prefrontal cortex neurons to light-
stimulation in vivo (Stujenske et al., 2015). It has been argued that the parameters used in this
study (30 s of 5-10 mW continuous LED-stimulation) that led to a temperature increase of 1-2
°C, are not representative of those commonly used in optogenetics experiments (Senova et al.,
2017). However, even more canonical stimulation patterns, i.e. pulsed light at a reduced duty
cycle, can still produce tissue warming between 0.1 and 0.8 °C in vivo (Stujenske et al., 2015;
Senova et al., 2017). These temperature modifications are sufficiently large to affect the firing
activity of some neuronal types recorded in the present study. Thus, controls tests on
wild-type animals/neurons should be mandatory to confirm the specificity of the observed effects
in optogenetics experiments.
The second implication concerns the sensitivity of some neuronal types to very small
variations of tissue temperature, with less than 0.1°C sufficient to modify the firing activity of
MCs. Since the brain is submitted to daily physiological temperature fluctuations that can
reach a few degrees Celsius (Andersen & Moser, 1995), our results raise the question of
whether, and how, the possible modifications in firing activity produced by physiological
temperature fluctuations have an impact on cognitive functions.
The third implication concerns a possible therapeutic application of optical stimulation. The
potential of optogenetics to treat certain brain pathologies has been documented in animal