DEFINING THE ECOLOGICAL AND PHYSIOLOGICAL
TRAITS OF PHYTOPLANKTON ACROSS MARINE
ECOSYSTEMS
byHarriet Alexander
B.S., Wellesley College (2010)Submitted in partial fulfillment of the requirements for the degree of Doctor of Philosophy
at the
MASSACHUSETTS INSTITUTE OF TECHNOLOGY and the
WOODS HOLE OCEANOGRAPHIC INSTITUTION February 2016
@2016 Harriet Alexander. All rights reserved.
The author hereby grants to MIT and WHOI permission to reproduce and to distribute publicly paper and electronic copies of this thesis document in whole or in
part in any medium now known or hereafter created.
Signature redacted
A uthor .. ...
oin'i Program in Science & Engineering
Massachusetts Institute of Technology
\
& Woods Hole Oceanographic InstitutionCertified bv.
S ignature redacted
...
January
4,2016A4
C
10
S6/
oiia T. DyhrmanAssociate Professor of Earth & Environmental Science Columbia University
+
d
+d
Thesis SupervisorIrLI
C
I
aCU
eCU
Elizabeth B. Kujawinski Associate Scientist with Tenure Woods Hole Oceanographic Institution
Accepted by .Signature
redacted
Thesis Supervisor MASSACHUSTT NTITUTE OF TECNLG
JAN 27 2016
(o Lauren Mullineaux Chair, Joint Committee for Biological Oceanography Massachusetts Institute of Technology Woods Hole Oceanographic InstitutionDEFINING THE ECOLOGICAL AND PHYSIOLOGICAL TRAITS OF PHYTOPLANKTON ACROSS MARINE ECOSYSTEMS
by
Harriet Alexander
Submitted to the MIT-WHOI Joint Program in Oceanography and Applied Ocean Science and Engineering on January 4, 2016, in partial fulfillment of the requirements for the degree of Doctor
of Philosophy in Biological Oceanography
ABSTRACT
Marine phytoplankton are central players in the global carbon cycle, responsible for nearly half of global primary production. The identification of the factors controlling phytoplank-ton ecology, physiology, and, ultimately, bloom dynamics has been a central problem in the field of biological oceanography for the past century. Molecular approaches enable the di-rect examination of species-specific metabolic profiles in mixed, natural communities, a task which was previously intractable. In this thesis, I developed and applied novel analytical tools and bioinformatic pipelines to characterize the physiological response of phytoplank-ton to their environment at various levels of taxonomic grouping. An in silico Bayesian
statistical approach was designed to identify stable reference genes from high-throughput sequence data for use in RT-qPCR assays or metatranscriptome studies. Using a meta-transcriptomic approach, the role of resource partitioning in the coexistence of two closely related diatom species in an estuarine system was examined. This study demonstrated that co-occurring diatoms in a dynamic coastal system have apparent differences in their capac-ity to use nitrogen and phosphorus, and that these differences may facilitate the diverscapac-ity of the phytoplankton. The second field study focused on the diatom, haptophyte, and di-noflagellate functional groups, using simulated blooms to characterize the traits that govern the magnitude and timing of phytoplankton blooms in the oligotrophic ocean. The results indicated that blooms form when phytoplankton are released from limitation by resources and that the mechanistic basis for the success of one functional group over another may be driven by how efficiently the transcriptome is modulated following a nutrient pulse. The final study looked at the sub-species level, examining the balance of phenotypic plasticity and strain diversity in the success of the coccolithophore Emiliania huxleyi. Results indi-cated strong control of nitrogen on the species complex and showed that nutrient resupply shifted the strain composition as well as transcript abundance of key biogeochemical genes involved in nutrient acquisition and the life stage of the population. Together, these studies demonstrate the breadth of information that can be garnered through the integration of molecular approaches with traditional biological oceanographic surveys, with each illumi-nating fundamental questions around phytoplankton ecology and bloom formation.
Thesis Supervisor: Sonya T. Dyhrman
Title: Associate Professor of Earth & Environmental Science Columbia University
Thesis Supervisor: Elizabeth B. Kujawinski Title: Associate Scientist with Tenure Woods Hole Oceanographic Institution
ACKNOWLEDGMENTS
Throughout graduate school I have been supported by the MIT Presidential Fellowship, the National Defense Science and Engineering Graduate (NDSEG) Fellowship, the Ocean Life Institute Fellowship, and the WHOI Academic Programs Office. This research was supported
by funds from the National Science Foundation (NSF) Environmental Genomics and NSF
Biological Oceanography Programs through Grant OCE-0723667 (to S.T.D., B.D.J., and T.A.R.) and Grant OCE-0962208 (to B.D.J.), the Joint Genome Institute/Department of Energy Community Sequencing Program through Grant CSP795793 (to B.D.J., S.T.D., and T.A.R.), the Center for Microbial Oceanography: Research and Education (C-MORE, National Science Foundation Grant EF04-24599), the Gordon and Betty Moore Foundation through Grant 2637 to the National Center for Genome Resources for the MMETSP and Grant 3794 (to D.M.K.). This work was also supported through grants from the Simons Foundation (to D.M.K. and S.T.D.), and is a contribution of the Simons Collaboration on Ocean Processes and Ecology (SCOPE).
The last five years has been the most interesting, challenging, and rewarding period of my life. I have been given the opportunity not only to freely pursue my academic passions, but to travel the world, interact with amazing people, and grow. Without the support and guidance of my mentors, colleagues, friends, and family, this journey would not have been possible.
First and foremost, I wish to thank my advisor Sonya Dyhrman, whose confidence in my scientific abilities has bolstered and motivated me throughout my thesis. Over the last five years, Sonya has nurtured my scientific curiosity challenged me to delve deeper and work harder than I thought possible. She went well beyond her prescribed duty as advisor, waking before dawn, hauling around 360L of water (more than once), and traveling to the literal
ends of the earth to make science happen. It has been a great privilege to work with such a talented scientist, whose integrity and ardent devotion to her colleagues and students I hope to emulate in my career.
I am grateful to my thesis committee, Penny Chisholm, Scott Doney, Mick Follows, and
Bethany Jenkins for their guidance and thoughtful input during my PhD. I especially wish to thank my co-advisor, Liz Kujawinski, who generously folded me into her lab group following Sonya's relocation and taught me the joys of FT-ICR-MS. I also would like to thank my co-authors: Tatiana Rynearson, Mak Saito, Dave Karl, Sam Wilson, and Melissa Mercier.
Special thanks to the WHOI Biology Department and JCBO for the fantastic classes and welcoming environment. In particular, I would like to thank Ann Tarrant for giving me a home base at WHOI following Sonya's departure. I am also thankful to Sam Laney for his advice and guidance during the course of my PhD and his agreement to chair my defense.
The vast majority of the data in this thesis were gathered at sea. I owe a big 'mahalo' to the captain and crew of the R/V Kilo Moana, the R/V Knorr, and the R/V Cap'n Bert.
My experiences at sea have been shaped by the wonderful people with whom I have sailed.
To all the participants in the HOE-DYLAN and DeepDOM cruises, thank you for the great time and all your help sherpa-ing enormous amount of water up and down stairs.
I count myself lucky to have overlapped with a group of wonderful and supportive people
during my time in the Dyhrman lab group. It goes without saying that Sheean Haley was the engine that keeps the lab running seamlessly. Her levity, indefatigably, and upper body strength, both on land and at sea, kept me grounded during my thesis and made all my
science possible. To my fellow Dyhrman Lab graduate students and postdocs, Louie, Abby, M6nica, Solange, Colleen, and Kyle, my thanks for your camaraderie, help, and general awesomeness over the last six years.
I have been blessed with an amazing assortment of friends both in the Woods Hole and
beyond. Thank you all for making this time fun and memorable. During this time I have been particularly thankful for my cohort, who stood shoulder to shoulder with me throughout graduate school. Thank you all for the late-night pizza and P-set sessions, sympathetic shoulders, and wonderful laughs. I also wish to thank Izi for her love and support over the last two years; I look forward to being by your side for the many journeys to come.
Finally, I would like to thank my mother and family for their tireless love and support, not only during my Ph.D., but throughout my life. I owe so much to my mother, who since I was small knew that I would end up working with the oceans and supported me in that dream. I wish to dedicate this thesis to the memory of my grandparents Betty and Sherwood Finley, to whom I owe my work ethic, love of nature, and perspective.
CONTENTS
1 Introduction
1.1 Background and Motivation . . . .
1.1.1 Diversity in the phytoplankton . . . .
1.1.2 Phytoplankton and their geochemical environment . . . .
1.1.3 Molecular tools in microbial ecology and oceanography . . . .
19 20 21 22 24 . . . . 2 5
2 Identifying reference genes with stable expression from sequence data
2.1 A bstract . . . . 2.2 Introduction . . . .
2.3 Materials and Methods . . . .
2.3.1 Culturing and transcriptome data collection . . . . 2.3.2 Reference gene identification . . . . 2.4 R esults . . . .
2.5 D iscussion . . . .
3 Metatranscriptome analyses indicate resource partitioning atoms in the field
3.1 A bstract . . . . 3.2 Introduction . . . . 3.3 Materials and Methods . . . . 3.3.1 Experimental set up and sample collection . . . .
3.3.2 RNA extraction and sequencing . . . .
3.3.3 Transcriptome and genome mapping . . . . 3.3.4 Transcriptome clustering . . . .
3.3.5 Identification of stable and nutrient-responsive genes . .
3.3.6 Normalization of metatranscriptome data . . . . 3.4 Results and Discussion . . . . 3.4.1 Samples and sequencing . . . . 3.4.2 Temporal plasticity in expressed metabolic capacity . .
high throughput 29 . . . . 30 . . . . 30 . . . . 32 . . . . 32 . . . . 33 . . . . 34 . . . . 39 between di-45 . . . . 46 . . . . 46 . . . . 48 . . . . 48 . . . . 49 . . . . 49 . . . . 50 . . . . 51 . . . . 51 . . . . 52 . . . . 52 . . . . 53
3.4.3 Species-specific resource utilization underpins physiological ecology . 1.2 Thesis Overview
3.4.4 Identification and modulation of resource responsive genes in situ
highlights species-specific differences . . . 5 9
4 Functional group-specific traits drive phytoplankton dynamics in the olig-otrophic ocean
4.1 A bstract . . . . 4.2 Introduction . . . . 4.3 Materials and Methods . . . . 4.3.1 Sample collection . . . . 4.3.2 RNA extraction and sequencing . . . . 4.3.3 Genome database creation and mapping . 4.3.4 MMETSP database creation and mapping 4.3.5 Differential expression analysis . . . . 4.3.6 Variable transcript allocation modeling . . 4.4 Results and Discussion . . . .
. . . 68 . . . 68 . . . 70 . . . 70 . . . 7 1 . . . 7 1 . . . 72 . . . 72 . . . . 73 . . . . 74
5 Physiological response and strain variation of the Emiliania huxleyi species complex under changing nutrient environments 5.1 A bstract . . . . 5.2 Introduction . . . . 5.3 M aterials and M ethods . . . . 5.3.1 Sample collection and shipboard nutrient incubation experiments . . . 5.3.2 RNA extraction and sequencing . . . . 5.3.3 Community- and strain-specific mapping and expression analysis . . . 5.4 Results and Discussion . . . . 5.4.1 Diatom and haptophyte community structure . . 5.4.2 E. huxleyi species-complex physiological ecology. 5.4.3 Strain variability with altered geochemistry . . . 5.5 C onclusion . . . . 6 Conclusion and Outlook 6.1 Thesis summary and next steps . . . 6.2 A final thought . . . . A Chapter 2 Supplemental Information A.1 Supplemental Figures . . . . A.2 Supplemental Data . . . . . . . . 91 . . . . 91 . . . . 92 . . . 100 . . . 105 107 . . . 108 . . . 111 113 114 116 67 85 86 86 88 88 89 89
B Chapter 3 Supplemental Information
B.1 Supplemental Figures ... B.2 Supplemental Tables ...
B.3 Supplemental Data . . . .
C Chapter 4 Supplemental Information
C.1 Supplemental Figures . . . .
C.2 Supplemental Tables . . . . D Chapter 5 Supplemental Information
D.1 Supplemental Figures . . . . D.2 Supplemental Tables . . . . D.3 Supplemental Data . . . . 117 118 127 129 131 132 139 141 142 . 152 153 . . . . . . . .
LIST OF FIGURES
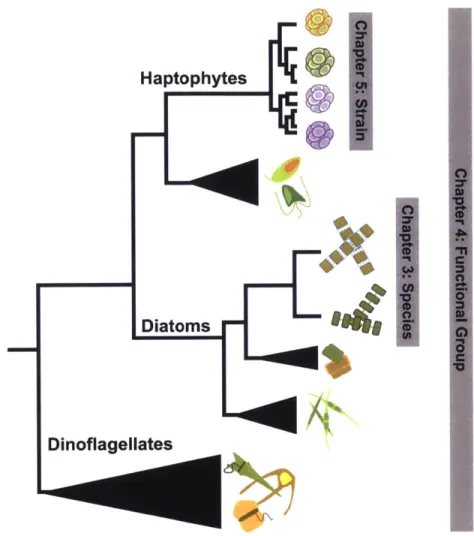
1-1 Conceptual overview of the levels of diversity explored in Chapters 3, 4, and 5 of this thesis. . . . . 26
2-1 Expression patterns of putative reference genes . . . . 36
2-2 Average deviation from the mean level of expression for putative reference genes 37
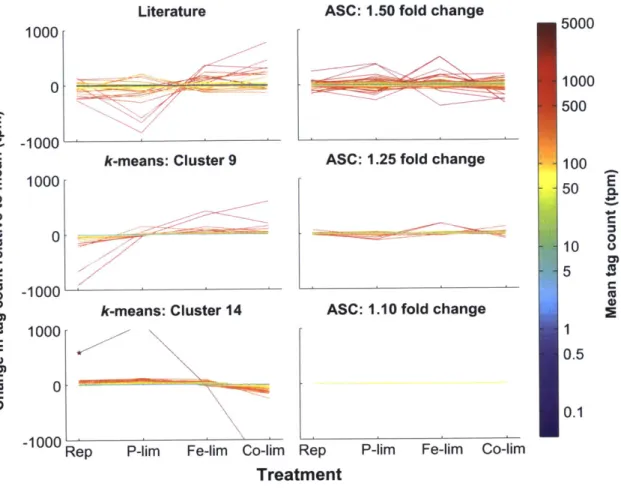
2-3 Comparison of putative reference genes identified through literature, k-means clustering, and ASC analysis . . . 40
3-1 Taxonomic classification of reads across five field samples . . . . 54
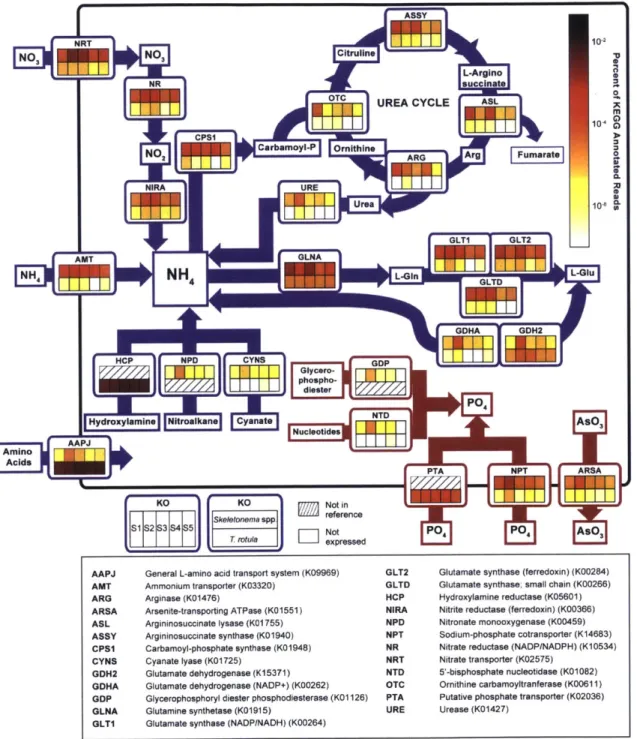
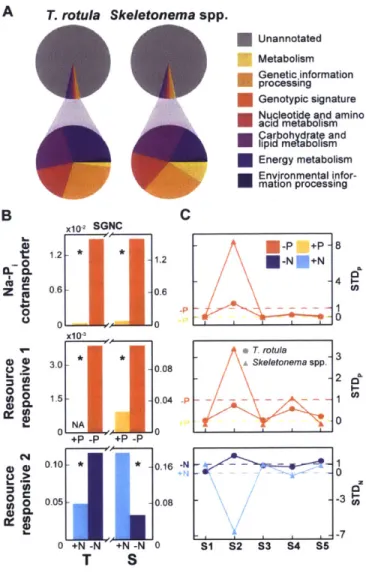
3-2 Quantitative metabolic fingerprint across Narragansett Bay in situ samples . 56 3-3 Modulation of nitrogen and phosphorus pathways in the field . . . . 58
3-4 Functional composition of resource-responsive gene set . . . . 61 3-5 Evolution of N- and P-responsive gene partitioning over time in Narragansett
B ay . . . . 63
4-1 Taxonomic distribution in mRNA mapped reads consistent across time but altered by deep seawater (DSW) addition . . . . 75
4-2 Quantitative metabolic fingerprint (QMF) and patterns of differential expres-sion across KEGG orthology following DSW addition underscore functional
group traits ... ... 77
4-3 Shifts in transcript abundance of genes responsive to biogeochemical forcing . 79
4-4 Variable transcript allocation space differentiates functional group strategies . 81
5-1 Population shifts in response to nitrogen addition for both haptophytes and diatom s . . . . 93 5-2 Fold change of genes associated with nitrogen and phosphorus metabolism,
calcification, and ploidy across each of the incubation amendments compared to the no addition control . . . . 95 5-3 Coordination between lab-based proteomic studies of nitrogen and
phospho-rus limitation in CCMP1516, bulk enzymatic activity, and patterns of tran-script abundance in the field . . . . 98
5-4 The distribution, orthologous grouping, and relative representation of E.
5-5 Principle components analysis of the strain-specific contributions to each of
the 5,243 orthologous group common amongst the five strains . . . 104
A-1 Distribution of normalized tag counts across treatments . . . 114
A-2 K-means clustering of normalized genes . . . 115
B-1 Cell counts in Narragansett Bay during the spring of 2012 . . . 118
B-2 Comparison of KEGG module content between Skeletonema spp. and T. rotu la . . . 119
B-3 Hierarchical clustering of QMF signatures across species and samples . . . 120
B-4 Expression of stable reference genes in the field . . . 121
B-5 Functional composition of the reference transcriptome and resource-responsive gene sets... ... 122
B-6 Relative expression of nitrate reducatses across incubation experiments . . . . 123
B-7 Gene cluster analysis of nutrient-responsive genes . . . 124
B-8 Expression of sodium phosphate cotransporter as measured in TPM, SGNC, and ST D p . . . 125
B-9 Distribution of STD scores for N- and P-responsive genes . . . 126
C-1 Chlorophyll a of replicated experiments for in situ samples, no addition con-trol, and a 10% deep seawater amendment . . . 132
C-2 Rank abundance shifts in the species composition of diatoms, haptophytes and dinoflagellates .. . .. .... ... . . . . .. . . .. 133
C-3 Comparison of the quantitative metabolic fingerprint (QMF) between the whole functional group and representative taxa . . . 134
C-4 Distribution of log fold change following deep seawater (DSW) addition . . .135
C-5 Weighted Venn diagrams of genes with significantly different abundances fol-lowing deep seawater (DSW) addition by functional group . . . 136
C-6 Microbial Assemblage Normalized Transcript Analysis (MANTA) ratio-averaged plots for global shifts in expression of KEGG orthologs . . . 137
C-7 Principal component analysis of the quantitative metabolic fingerprint (QMF) signals across in situ, no addition control, and deep seawater amended samples138 D-1 The relative expression of 'core', shared, and CCMP1516-specific transcripts across time and in incubation experiments . . . 142
D-2 Inorganic nitrogen and phosphorus concentrations at the point of RNA sam-pling (7 days post-inoculation) for each of the six treatments in El and E2, averaged across triplicate bottles (n=3). . . . 143
D-3 The percent of genes falling into each of the KOG classes for each of the five strain s. . . . 144
D-4 The number of orthologous groups falling into each of the possible strain sets across the five strains surveyed . . . 145
D-5 Log normalized fold change plotted against log normalized average abundance
for each of the five amended treatments compared to the no-addition control . 146
D-6 Weighted Venn diagrams of significantly different, increased, and decreased
orthologus groups and species-specific transcripts across each of the amend-edments to which N was added. . . . 147 D-7 Fold change of genes associated with carbon, nucleotide, and amino acid
metabolism across each of the incubation amendments . . . 148
D-8 Fold change of genes associated with photosynthesis, ATP synthesis, Calvin
cycle, TCA cycle, and glycolysis across each of the incubation amendments 149
D-9 Annotation of orthologous groups using KOG orthology for all E. huxleyi
orthologous groups and for shared orthologous groups . . . 150 D-10 RSEM estimated contribution of each strain to the abundance of the shared
LIST OF TABLES
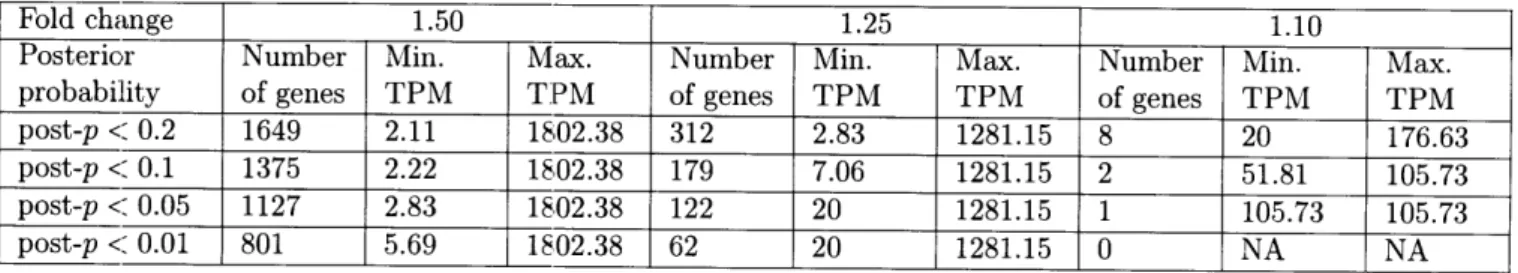
2-1 Gene counts for the fold change bins of 1.50, 1.25, and 1.10 across posterior probability cutoffs ranging from 0.01 to 0.20. . . . . 38 5-1 Final nutrient concentrations used in nutrient amendment incubations. . . . . 88 B-1 The total number of paired end reads after quality control and trimming and
the percentage of reads mapping . . . 127
B-2 Nutrient concentrations used in nutrient amendment incubations. . . . 127
B-3 Mapping statistics for T. rotula and S. costatum transcriptomes . . . 128
C-1 Macronutrient concentrations in deep seawater ammendment and the
incu-bation experiments after 168 hours . . . 139
D-1 Strain isolation date, synonyms, and transcriptome/genome information for
CHAPTER 1
1.1
Background and Motivation
The upper, sunlight region of the pelagic ocean, or "euphotic" zone, is home to micro-scopic plants, phytoplankton, which thrive and photosynthesize in this well-lit environment. Though individually quite small, the combined net primary production (NPP) of this di-verse consortium in the marine system is estimated to be between - 44 to 67 Pg of carbon
(C) per year, nearly 50% of global NPP (Longhurst et al., 1995; Field et al., 1998;
Behren-feld et al., 2005; Westberry et al., 2008). Due to this significant role in the carbon cycle, the identification of the major factors controlling phytoplankton ecology, physiology, and, ultimately, bloom dynamics has been a central problem in the field of biological
oceanogra-phy for the past century. From oceanogra-physical explanations (Sverdrup's critical depth hypothesis (1953)), to chemical rationale (Redfield ratio (1958)), to ecological theory (Margalef's
man-dala (1978)), the field has been constantly reevaluating evidence to answer the question: What drives phytoplankton production?
Since these foundational hypotheses were put forth, significant advancements in the study of ocean primary production have been made both through the continued collection of tradi-tional biological oceanographic datasets (e.g. chlorophyll, nutrients, taxonomic counts) par-ticularly at long-term sampling sites (Karl and Lukas, 1996; Steinberg et al., 2001; Smith and Fraser, 2003; Li and Smayda, 1998), and through technological advancements. Remote sens-ing from satellites, startsens-ing with the Coastal Zone Color Scanner (CZCS) in 1978, enabled global-scale estimates of chlorophyll a and spawned a new generation of missions to measure ocean color (e.g. SeaWiFs, MODIS Aqua) (McClain, 2009). High-throughput approaches such as flow cytometry, the early use of which led to the discovery of the most abundant pho-tosynthetic organism on Earth (Chisholm et al., 1988), have now been expanded to enable automated measurements along oceanic transects (Swalwell et al., 2011; Ribalet et al., 2015) and over time series (Olson et al., 2003). Finally, the integration of molecular techniques into the study of marine microbes has provided a window into this previously muddled and complex world. With these tools we have discovered previously unknown diversity in the plankton (Lopez-Garcia et al., 2001), clarified the evolutionary histories of protists (Keel-ing et al., 2005), characterized previously invisible microbial communities (Fuhrman et al.,
1993), and tracked the molecular metabolism underlying biogeochemical cycles (K6nneke
et al., 2005). Despite the impressive advances that have been made in the study of phyto-plankton, the mechanisms that underlie the participation of these microorganisms in marine food webs and biogeochemical cycles remains poorly understood.
The macronutrients nitrogen (N) and phosphorus (P) are widely recognized to be major drivers of phytoplankton growth and activities in marine systems (Moore et al., 2004). In many regards, however, we lack a fundamental understanding of how nutrients are metabo-lized by different phytoplankton species and functional groups, processes that may directly
dictate their distributions and activities. Characterizing the interplay between individual phytoplankton taxa and their N and P environment in a natural setting remains a major on-going challenge, as many metrics such as elemental composition or enzymatic activity lack specificity and can largely only be assessed for the bulk community. These studies may be taken in to the lab, but doing so limits the ability to compare between species as you can in a natural setting, and comes with a set of biases such as ease of culturing (Lakeman
et al., 2009). This thesis will focus on the following questions:
1. How do phytoplankton respond to changing nutrient environments? Are these changes
common across functional groups, genera, species, strains?
2. What enables the maintenance of diverse phytoplankton communities?
3. How does diversity, both genetic and functional, influence ecosystem function and
biogeochemical cycling?
Using a combination of field and experimental approaches and harnessing new molecular tools, this thesis aims to address these questions at a detailed, molecular-level. In this chapter I will set the stage for the coming data chapters, briefly discussing phytoplankton diversity, their functioning in biogeochemical cycles, and the implementation and utility of molecular tools in environmental microbiology and oceanography.
1.1.1 Diversity in the phytoplankton
Photosynthetic organisms at the broadest level can be broken into two distinct groups: prokaryotes (primarily bacteria') and eukaryotes. While, cyanobacteria are numerically more abundant, this thesis will focus on the larger, eukaryotic fraction of photosynthetic plankton. All eukaryotic photosynthetic organisms (terrestrial and marine) are believed to have descended from one common ancestor (Margulis, 1971) and then diversified into three main lineages: green algae, glaucophytes, and red algae (Falkowski et al., 2004). Land plants are significantly more diverse at the species-level (- 268, 600 species) (Chapman, 2009) than
are phytoplankton (- 25, 000 species) (Costello et al., 2013). Unlike land plants, which are a
"crown" group, with all species falling into a single clade (Virdiplantae), algae span all three of the photosynthetic eukaryotic groupings and are far more genetically diverse as a whole than are land plants (Falkowski et al., 2004). This diversity directly contradicts Gause's law of competitive exclusion, which posits that two organisms competing for the same resources cannot coexist under constant ecological factors as even the slightest advantage held by one organism will lead to domination in the long term (Hardin, 1960). But, phytoplankton,
'There are some organisms currently classified as archaea that are phototrophs (e.g. the haloarchaeon
Haloarcula marismortui). However, these organisms do not fix carbon and rely upon bacteriorhodopsin
rather than chlorophyll. To date, chlorophyll biosynthesis has not been detected in archaea (Bryant and
who superficially compete for the same two resources, light and nutrients, persist. Hutchin-son (1961) dubbed this the "paradox of the plankton." Explanations for this paradoxical state span life history differences (Huisman et al., 2001), environmental fluctuation (Roy and Chattopadhyay, 2007), individual variability (Menden-Deuer and Rowlett, 2014), and differential niche partitioning (Connel and Connell, 1980).
The deeply nested diversity of phytoplankton is manifest not only genetically, but also morphologically and functionally. At the most basic level, the size of eukaryotic phyto-plankton, measured here as the maximum linear dimension, extends over three orders of magnitude (Finkel et al., 2010), ranging from the smallest free-living eukaryote Ostreococcus to species of diatoms that may be visible to the naked eye, e.g. Ethmodiscus rex. Size, sometimes called the 'master trait', is central to the structuring of phytoplankton popula-tions and distribupopula-tions as it may influence nutrient kinetics, growth rate, and sinking speeds (Finkel et al., 2010). Across this range of sizes there are several prominent functional groups of eukaryotic phytoplankton. This thesis focuses on three marine pelagic eukaryotic phyla, or functional groups, that are abundant in the modern ocean: Bacillariophyta (diatoms), Haptophyta (haptophytes), and Dinophyta (dinoflagellates). It is hypothesized that these three phyla diverged from their progenitor group, Rhodophyta, through a secondary en-dosymbiotic event (Falkowski et al., 2004). Fossil records indicate that these groups arose during the mesozoic period, with dinoflagellates and haptophytes first appearing in the Tri-assic, followed later by the diatoms, which appeared in the Cretaceous period(Katz et al., 2004). The expansion of the red lineage had a significant impact on the trajectory of global biogeochemical cycles and arguably were central in the sculpting of the modern oceanic environment. For example, the rise of diatoms, which are distinguished from other groups
by their hard mineral shell comprised of polymerized silicic acid, decreased the amount of
available silica (Si) in the ocean from an hypothesized original high concentration to today's undersaturated state, with Si concentrations often less than
1pM
in the open ocean (Conley, 2002). This provides a nice example of the strong reciprocal relationship that exists between the phytoplankton and the geochemical state of the ocean.1.1.2 Phytoplankton and their geochemical environment
Phytoplankton are largely autotrophic2 organisms, relying upon photosynthesis to convert light into chemical energy that is then stored in organic compounds. Photosynthesis, in addition to carbon and light, requires both macro- (e.g. N and P) and micro-nutrients
(e.g. iron (Fe) and zinc (Zn)). In the marine environment, growth and photosynthesis are frequently limited by nutrient availability, as the surface waters of the ocean are variably
2
The importance and prominence of mixotrophy, or a combination of photosynthetic and heterotrophic or predatory lifestyles, is increasingly being recognized across functional groups in marine systems (Worden et al., 2015). With regard to this thesis, it is worth noting that members of both the dinoflagellate and haptophyte functional groups are known to be mixotrophic (Unrein et al., 2014; Jeong et al., 2010).
deplete of many nutrients (N, P, Fe, Zn, vitamin B1 2 etc.) (Moore et al., 2004; Bertrand
et al., 2007). These patterns of limitation are thought to be central to the global-scale biogeography of phytoplankton functional groups (Follows et al., 2007).
Diversity in the metabolic capacity for nutrients across of phytoplankton groups partially explains the emergent patterns observed in the field and in models. These differences span unique metabolic requirements, as with diatoms' requirement for Si; differences in nutrient uptake kinetics, such as higher or lower half-saturation constants or uptake rates; or the ability to acquire nutrients from substrates not accessible to the whole community, as seen in the ability to grow on urea. There is extensive literature on the nutrient dynamics of a variety of phytoplankton taxa, which has revealed fundamental differences amongst the diatom, dinoflagellate, and haptophyte functional groups that are thought to be related to evolutionary history (Litchman and Klausmeier, 2008). For example, significant differ-ences in uptake and affinity for N have been observed between functional groups. Diatoms have higher maximum nutrient uptake rates (Vm,) than either haptophytes or dinoflagel-lates. However, haptophtes have a far lower half-saturation constant (KN), a term which is inversely related to nutrient affinity, with low half-saturation constants indicating higher affinity (Litchman et al., 2007). Thus, these parameters define different niches for the hap-tophytes and diatoms, with diatoms outcompeting haphap-tophytes when N is abundant, while haptophytes dominate when N is low. Such differences were described earlier by Margalef's mandala, in which phytoplankton functional groups were placed in nutrient and turbulence space, associating each group with a different regime and ecological strategy (Margalef,
1978).
Beyond differences in nutrient metabolism across functional groups, inter- and intra-species diversity of nutrient metabolism has been observed within these functional groups. For example, at the order-level, pennate and centric diatoms demonstrate different iron requirements (Marchetti et al., 2006), with pennates being better adapted to growth un-der Fe-limiting conditions in part because of enhanced Fe storage with the protein ferritin (Marchetti et al., 2008). At a lower level, the Fe requirement of species within a genus of pennate diatoms, Pseudo-nitzschia, has been found to be variable, with large differences associated with the isolation location, be it coastal or open ocean (Marchetti et al., 2006). Another interesting example of variable nutrient metabolism is in the haptophyte Emiliania
huxleyi. The genetic diversity of F. huxelyi has recently been found to be extensive (Read et al., 2013); however, physiological studies that precede those observations showed inter-strain differences in the ability to grow on organic N substrates (Strom and Bright, 2009) and organic P substrates (Dyhrman and Palenik, 2003). Observations of these taxon specific dif-ferences, while easily made in culture, are not as easily detectable in the field. However, the incorporation of molecular tools into the study of nutrient physiology in addition to provid-ing a more holistic appreciation of the molecular physiology underlyprovid-ing nutrient metabolism,
can enable the assessment of nutrient physiology in the field.
1.1.3
Molecular tools in microbial ecology and oceanography
As with the field of medicine, advances in sequencing and mass spectrometry technologies over the last decade have accelerated investigations of diversity and function in the field of biological oceanography. The burgeoning technologies fueling the "-omics"3 revolution have allowed a unique glimpse into the previously hidden molecular world of the microbes. These studies span the level of the genome, or the metabolic capacity of an organism; the transcriptome, the immediate response of an organism to its environment; and the proteome, the end product of the transcriptome and potential marker of previous stress.
The sequencing of phytoplankton genomes (Armbrust et al., 2004; Derelle et al., 2006; Read et al., 2013; Worden et al., 2009; Gobler et al., 2011; Bowler et al., 2008) illuminated the ecology of these organisms, and thus facilitating the discovery of biochemical pathways with geochemical significance that were unanticipated, such as the ornithine-urea cycle in diatoms (Armbrust et al., 2004). In addition to gene discovery, these studies laid the foundation for the use of transcriptomic (Mock et al., 2008; Dyhrman et al., 2012; Mock et al., 2008) and proteomic (Wurch et al., 2011a; Bertrand et al., 2012; Jones et al., 2013) approaches to study metabolic plasticity in phytoplankton. These elegant studies have elucidated the response of phytoplankton to macronutrient (Rokitta et al., 2014; Dyhrman et al., 2012; Wurch et al., 2011a; Shrestha et al., 2012; Mock et al., 2008; Bender et al., 2014; Allen et al., 2011) and micronutrient limitation (Lommer et al., 2012; Nunn et al., 2013; Allen et al., 2008; Marchetti et al., 2008; Bertrand et al., 2012) and identified previously unknown biochemical connections between eukaryotic plankton and their associated bacteria (Durham et al., 2015). However, due partially to a lack of available reference genomes and transcriptomes, these studies were not able to be performed in the field for eukaryotic organisms until quite recently.
"Meta"-genomic, -transcriptomic, and -proteomic studies in marine ecosystems focused on eukaryotes have lagged behind such studies on prokaryotes. Transformative work using these meta-'omic techniques to study field populations has identified synchronous patterns of gene expression in both autotrophic and heterotrophic plankton (Ottesen et al., 2014,
2013), the importance of specialists in the response of communities to dissolved organic
matter (McCarren et al., 2010), and a gradation of multiple nutrient stress in a cosmopoli-tan phytoplankter (Saito et al., 2014). The power in these studies was the ability to associate physiological response to environmental cues to individual members of a mixed community. Until quite recently, there were but a limited number of eukaryotic plankton with reference genomes or transcriptomes. The lack of diversity in the reference sequences of eukaryotic 3"-omics" is a catch-all suffix typically used to describe large, molecular datasets (e.g. genomics, the
study of the genome; and transcriptomics, the study of the complete set of RNA transcripts produced under certain conditions). The use of this suffix, however, is expanding to other fields (see #badomics).
phytoplankton limited the scope of otherwise robust meta-omic studies on these communi-ties (Marchetti et al., 2012). However, a new sequencing initiative, the Marine Microbial Eukaryotic ranscriptome Sequencing Project (MMETSP), fleshed out the eukaryotic tree of life, adding sequence data for hundreds of different species and strains, many from pre-viously unsequenced phyla (Keeling et al., 2014) species and strains, many from prepre-viously unrepresented groups. These data, combined with improving sequence technologies, which are becoming increasingly affordable, make eukaryotic transcriptomic studies increasingly tractable.
1.2
Thesis Overview
The overarching goal of this thesis was to 1) develop bioinformatic tools and pipelines for the analysis of eukaryotic metatranscriptomic datasets and 2) apply these tools in the field to characterize the metabolic underpinnings of phytoplankton physiology and ecology at various levels of taxonomic grouping.
A primary limiting factor in eukaryotic metatranscriptomics has been the difficulty of
both normalizing and contextualizing metatranscriptomic signals. Due to the relative sim-plicity of prokaryotic genomes, metatranscriptomic studies of prokaryotic communities have commonly been paired with metagenomic studies, enabling the normalization of RNA (or cDNA) to DNA, a natural internal standard (Frias-Lopez et al., 2008; McCarren et al., 2010; Shi et al., 2011). Eukaryotic genomes are both larger4 and more complex, possessing in-tronic regions, pseudogenes, as well as large stretches of highly repetitive, non-coding DNA sequence (Taft et al., 2007). Therefore, the depth of sequencing that would be required to potentially cover all the genomes of a mixed eukaryotic community would be immense and would consequently obviate their use in normalization. As means of counteracting these im-pediments, I compared the efficacy of two different statistical techniques, k-means clustering (Hartigan and Wong, 1979) and analysis of sequence counts (ASC) (Wu et al., 2010), for the identification of stably expressed genes from transcriptome datasets. ASC, an empirical Bayes method to detect differential gene expression generated from quantifiable sequence count data, was found to function well in isolating stably expressed genes from a large gene set (Chapter 2). Taking this approach into the field, genes that were stable for individ-ual taxonomic groups were identified from metatranscriptomic data and used to aid in the normalization of observed patterns.
Broadly speaking, the three field studies in this thesis examine how nutrient shifts in the environment affect different members of the eukaryotic phytoplankton community. Each chapter focuses on a different level of taxonomic grouping ranging from, at the highest
4
Some estimates suggest that the haploid genome of dinoflagellates can range between 3-245x106 kbp, which is 1-77 times the size of the human haploid genome (Hou and Lin, 2009).
Haptophytes
Diatoms
Dinoflagellates
Figure 1-1: Conceptual overview of the levels of diversity explored in Chapters 3, 4, and 5 of this
thesis.
level, comparisons across functional groups, to species-level comparisons, and down to intra-species, or strain-level comparisons (Figure 1-1). Additionally, each study was designed to
be related to a broader ecological question in biological oceanography.
The vast diversity of phytoplankton has long perplexed biological oceanographers, as these organisms superficially appear to coexist in an isotropic environment while competing for the same basic resources, nutrients and light. Niche partitioning of resources has been hypothesized to be one factor enabling the "paradox of the plankton" (Hutchinson, 1961) but quantitative approaches to identify and track it in the field have been lacking. Working at the long-term sampling site in Narragansett Bay, where seasonal dynamics in phytoplank-ton abundances are well-described and where multiple species are known to simultaneously co-exist, metatranscriptome profiling was used to track species-specific metabolic profiles. In addition to tracking known metabolic pathways, new techniques were developed to 1) identify novel resource responsive gene targets without a priori knowledge of function and
2) contextualize expression signals to compare the ecophysiology of organisms. This study clearly demonstrated fundamental differences in nutrient utilization between two dominant diatom species in the same environment, suggesting that there was resource partitioning occurring in the field (Chapter 3).
Both Chapters 4 and 5 focus on characterizing physiological constraints on the olig-otrophic eukaryotic phytoplankton, though at different levels of taxonomic resolution. It has been postulated that the net oxygen state of oligotrophic systems is controlled by ape-riodic bursts of production by the large eukaryotic phytoplankton in response to nutrient pulses (Karl et al., 2003). Long-term monitoring at Station ALOHA suggests seasonality in ecosystem productivity, as evidenced by increased carbon and biogenic Si export dur-ing summer. Currently, however, very little is known about the nutritional constraints and metabolic capabilities of the three major phytoplankton functional groups in the olig-otrophic ocean: diatoms, haptophytes, and dinoflagellates. By sampling and comparing the global gene expression of eukaryotic community both in situ and in simulated deep water upwelling incubations (Chapter 4), I was able to identify 1) specific drivers of production for taxonomic groups and 2) transcriptional patterns consistent with the previously defined ecological traits and strategies of different functional groups (Margalef, 1978).
As can be seen from Chapters 3 and 4 as well as other published works (Dyhrman et al., 2006, 2012; Wurch et al., 2011a; Bertrand et al., 2012; Jones et al., 2013; Bender et al., 2014; Frischkorn et al., 2014), metabolic plasticity as measured through proteomic-and transcriptomic-approache in response to environmental change is currently a stproteomic-andard means of examining and characterizing physiological responses to perturbation. Another way that communities respond to perturbation is through succession of species, or, in some cases, strains. Genomic surveys of cultured isolates of E. huxleyi have shown a high level of variability amongst the genomes (Read et al., 2013). This mirrors the physiological vari-ability observed in the field and laboratory, as well as in its cosmopolitan distribution across oceanic biomes. Using a metatranscriptomic approach, the relative strain composition and metabolic response of E. huxleyi was tracked across field observations and in microcosm studies, which shifted the nutrient environment (Chapter 5). Results demonstrated that the population was constrained by N-limitation. The addition of N produced a shift in metabolism that was highly conserved across these replicated experiments and, more sur-prisingly, across previous culture-based studies. Additionally, changes in strain-specific gene sets point to a shift in the strain composition of the E. huxleyi species complex.
CHAPTER 2
IDENTIFYING REFERENCE GENES WITH STABLE
EXPRESSION FROM HIGH THROUGHPUT SEQUENCE
DATA
This chapter was originally published as Alexander, H., Jenkins, B.D., Rynearson, T.A., Saito, M.A., Mercier, M.L., and Dyhrman, S.T. (2012). Identifying reference genes with stable expression from high throughput sequence data. Front. Microbiol. 3, 385.
H.A., B.D.J., T.A.R., M.L.M., M.A.S., and S.T.D. performed research; H.A. and S.T.D. analyzed data; H.A. and S.T.D. wrote the paper; and B.D.J., T.A.R., M.L.M., M.A.S contributed to the writing of the
paper.
2.1
Abstract
Genes that are constitutively expressed across multiple environmental stimuli are crucial to quantifying differentially expressed genes, particularly when employing quantitative reverse transcriptase polymerase chain reaction (RT-qPCR) assays. However, the identification of these potential reference genes in non-model organisms is challenging and is often guided by expression patterns in distantly related organisms. Here, transcriptome datasets from the diatom Thalassiosira pseudonana grown under replete, phosphorus-limited, iron-limited, and phosphorus and iron co-limited nutrient regimes were analyzed through literature-based searches for homologous reference genes, k-means clustering, and Analysis of Sequence Counts (ASC) to identify putative reference genes. A total of 9759 genes were identified and screened for stable expression. Literature-based searches surveyed 18 generally accepted reference genes, revealing 101 homologs in T. pseudonana with variable expression and a wide range of mean tags per million. K-means analysis parsed the whole transcriptome into
15 clusters. The two most stable clusters contained 709 genes but still had distinct
pat-terns in expression. ASC analyses identified 179 genes that were stably expressed (posterior probability, post-p < 0.1, for 1.25 fold change). Genes known to have a stable expression
pattern across the test treatments, like actin, were identified in this pool of 179 candidate genes. ASC can be employed on data without biological replicates and was more robust than the k-means approach in isolating genes with stable expression. The intersection of the genes identified through ASC with commonly used reference genes from the literature suggests that actin and ubiquitin ligase may be useful reference genes for T. pseudonana and potentially other diatoms. With the wealth of transcriptome sequence data becoming available, ASC can be easily applied to transcriptome datasets from other phytoplankton to identify reference genes.
2.2
Introduction
Quantitative reverse transcriptase polymerase chain reaction (RT-qPCR) facilitates rapid, accurate, high-throughput analyses of gene expression, greatly enhancing and expanding molecular biological studies in a variety of organisms. This method has moved beyond the realm of model organisms (Adib et al., 2004; Antonov et al., 2005; Caldwell et al., 2005; Marionneau et al., 2005; Flatt et al., 2008) to be employed for the examination of ecological and physiological characteristics of marine microbes in both culture and the environment (Zehr and Turner, 2001; Nicot et al., 2005; Maldonado et al., 2006; Mock et al., 2008; Zhao et al., 2009; Whitney et al., 2011; Wurch et al., 2011a; Allen et al., 2008; Kustka et al.,
2007; Lin et al., 2009). There are two primary methods of gene expression analysis for single
comparison of the PCR signal to a standard curve, and 2) relative gene expression, in which the expression of the gene of interest is determined through comparison to a reference gene (or internal control gene), often employing the 2--ANCT method. The 2-AACT method
used the expression of the target gene and reference gene in both a treatment and control treatment to estimate the fold change of the target gene (Livak and Schmittgen, 2001; Pfaffl, 2001; Schmittgen and Livak, 2008).
Inherent in the 2-AACT method is the selection of a reference, or "housekeeping," gene
to act as an endogenous control. Ideally, the expression levels of the selected reference gene should remain stable across the treatments being examined. Genes like GAPDH, actin, and rRNA are often targeted as possible reference genes and tested for consistency in expression across treatments (Vandesompele et al., 2002; Pfaffl et al., 2004; Radonic et al., 2004). However, both Czechowski et al. (2005) and de Jonge et al. (2007) demonstrated that canonical reference genes were often widely differentially regulated. In fact, de Jonge et al. (2007) noted that commonly used reference genes were not represented in the fifty most stably expressed genes in the human genome. Results from RT-qPCR studies using improper reference genes (e.g. genes that are not constitutively expressed) can be significantly different from results obtained with a proper reference gene (Dheda et al., 2005; Lanoix et al., 2012). Considering that previously established reference genes were not among the mostly stably expressed genes in model organisms, basing the selection of candidate genes for non-model organisms solely upon known reference genes may not prove the best method (de Jonge et al., 2007; Czechowski et al., 2005).
Application of RT-qPCR has proven particularly fruitful in the study of marine phyto-plankton, illuminating transcriptional responses to physical stressors (Rosic et al., 2010b,b),
nutrient limitation (Davis et al., 2006; Moseley et al., 2006; Davis and Palenik, 2008; Stuart et al., 2009; Whitney et al., 2011; Wurch et al., 2011a; Bender et al., 2012; Berg et al., 2008), and the diel cycle (Whitney et al., 2011; Bender et al., 2012), as well as highlighting the mod-ulation and activity of many metabolic pathways (Moseley et al., 2006; McGinn and Morel, 2008a; Mock et al., 2008; Bender et al., 2012). The success of these studies hinged upon the selection of a stably expressed reference gene. While there is often extensive literature characterizing the dynamics of suites of genes expressed under different conditions in stud-ies of model organisms, similar breadth is lacking for non-model organisms, such as marine phytoplankton. With few genome sequences available, the selection of reference genes for eukaryotic phytoplankton is a challenge, and researchers must often choose candidate genes (e.g. actin (Nicot et al., 2005), GAPDH (Czechowski et al., 2005)) based on the literature from model organisms that are distantly related to the study organism. Selecting and vali-dating potential reference genes is a difficult task that consequently slows the development and application of targeted gene expression studies for phytoplankton.
se-quencing technologies may advance and broaden the search for candidate reference genes in non-model organisms. This is particularly true of transcriptome datasets whereby genes with stable expression can be identified between treatment conditions. Two statistical tech-niques, k-means clustering (Hartigan and Wong, 1979) and analysis of sequence counts
(ASC) (Wu et al., 2010), usually used to investigate patterns of differential expression in
transcriptome datasets, show promise in this regard. The k-means algorithm is a partition-based, non-hierarchical clustering method, which divides sequence tags into the specified k-number of clusters, while minimizing the intra-cluster spread based on the specified dis-tance metric (Hartigan and Wong, 1979; Tavazoie et al., 1999; Gerstein and Jansen, 2000; Quackenbush, 2001; D'haeseleer, 2005). ASC is a novel empirical Bayes method (estimating the prior distribution from the data, itself) to detect differential gene expression generated from quantifiable gene expression counts (as generated by Illumina Digital Gene Expres-sion tag profiling, RNA-seq or similar high-throughput sequencing technologies) (Wu et al., 2010). When applied to transcriptome data these tools cannot only be used to identify genes with differential expression, they can be used to identify genes with highly stable expression patterns.
Here, literature-based searches, k-means clustering, and ASC are compared as tools for reference gene selection using a transcript sequence dataset collected from the centric diatom
Thalassiosira pseudonana, grown under nutrient replete, phosphorus-limited (P-limited),
iron-limited (Fe-limited), and phosphorus and iron co-limited (co-limited) treatments.
2.3
Materials and Methods
2.3.1 Culturing and transcriptome data collection
Axenic T. pseudonana CCMP1335 was grown at 14'C under 24 hour light (120 btmol photons
m 2s-1) after Dyhrman et al. (2012) in f/2 plus silica chelated media made from surface
Sargasso Sea water. Nitrate, silica, vitamins, and trace metals were at f/2 concentrations (Guillard and Ryther 1962), while iron and phosphate were modified across treatments. In brief, triplicate cultures of replete (36 /_M PO-, 400 nM Fe), P-limited (0.4 pM PO-, 400 nM Fe), Fe-limited (36 puM PO-, 40 nM Fe), and co-limited (0.4 AM PO4-, 40 nM Fe) treatments were harvested when growth deviated from the replete control. Growth was monitored by cell counts. Biomass was harvested onto 0.2
pm
filters and flash frozen in liquid nitrogen and total RNA was extracted as described in (Dyhrman et al., 2012). Tag-seq Tag-sequencing of the transcriptome was performed by Illumina with a polyA selection and NlaIII digestion, resulting in 21 base pair sequence reads or tags (Dyhrman et al., 2012). Libraries were of varied sizes as follows: replete (-12 million), P-limited (-13 million), Fe-limited (~23 million), and co-limited (-26 million). Tags were mapped to gene models (predicted protein coding regions) with a pipeline designed by Genesifter Inc., requiring 100%identity and covering 9759 genes. Tag counts within a gene were pooled and normalized to the size of the library, with resulting data expressed in tags per million (TPM). Genes with normalized tag counts less than 2.5 TPM for each of the four treatments were excluded (Figure A-1), leaving 7380 genes in the analysis. The data discussed in this publication have been deposited in NCBI Gene Expression Omnibus (GEO) (Edgar, 2002) and are accessible through GEO Series accession number GSE40509.
2.3.2 Reference gene identification
The current, relevant literature from algae and plant-based studies was queried for reference genes used as endogenous controls for relative gene expression assays. Stably expressed genes reported in the literature were compared using BLASTn (Altschul et al., 1997) against the
T. pseudonana genome in NCBI (AAFDOOOOOO0O.2) to find homologs (e-value < 1.0e-1).
A loose e-value cutoff was used to be inclusive and enhance our collection of all potential
reference gene candidates. In addition, the Eukaryotic Orthologous Group (KOG) definitions for the genes found via BLAST were identified, and subsequent genes located in the KOG definition families were included in the analysis.
For the k-means analysis, tag counts from the four treatments corresponding to the 7380 genes with reads greater than 2.5 TPM were clustered using the k-means algorithm under the Pearson correlation coefficient. The distance was measured with a Pearson correlation as it has been found to perform as well or better than other similar distance measures for non-ratio or count-based data (Gibbons and Roth, 2002), such as the T. pseudonana transcriptome dataset. The number of clusters (k) was determined via a figure of merit (FOM) estimation, which is an approximation of the predictive power of the clustering method (Yeung et al., 2001). FOM analysis was performed by predicting the FOM value for values of k ranging from k = 1 (one cluster) to k = 50 (fifty clusters). The FOM value decreases as the
within-cluster similarity increases, thus the FOM value was minimized to determine the optimal k-value. All clustering analyses were performed using the MultiExperiment Viewer (MeV) version 4.7 (Saeed et al., 2003, 2006). Possible reference gene targets were identified by isolating clusters of genes that exhibited similarly stable expression patterns across the four treatments.
Using ASC (Wu et al., 2010), the statistical significance of an observed fold change was determined in pairwise comparisons between each of the limited treatments and the replete control. The posterior probability (post-p) was calculated by computing the posterior mean of the log ratio of proportions over each of the P-limited, Fe-limited, and co-limited treatments relative to the replete treatment for a fold change of 1.10, 1.25, and 1.50. Possible constitutively expressed genes were identified by selecting genes for which the post-p of each of the nutrient-limited treatments relative to the replete treatment for each of the fold change values was less than a specified cutoff. Posterior probability cutoffs between 0.01 and 0.20
were assessed across each of the fold changes (Table 2-1). Ultimately, a post-p of 0.10 was selected for further analyses (meaning that genes selected had less than a 10% chance of having the specified fold change between treatments), for it yielded genes across all of the fold change bins examined and demonstrated a broader range of mean normalized tag counts than seen for a post-p of 0.05 or 0.01. All ASC analyses were made using ASC 0.1.5 in R.
2.4
Results
Transcript sequence data was generated from T. pseudonana CCMP1335, grown in four different treatments (replete, P-limited, Fe-limited, and co-limited). Potential reference genes were identified through 1) querying the data to identify expression of common reference genes based on literature searches, 2) a pattern-driven analysis using k-means clustering (Hartigan and Wong, 1979) and 3) a quantitative analysis based the probability of fold change using ASC.
Selection of reference genes often falls upon those used in previous relative expression studies. The literature was surveyed for RT-qPCR expression studies employing the 2-AACT
method for the following algae and plants: T. pseudonana (Maldonado et al., 2006; McGinn and Morel, 2008a,b; Mock et al., 2008; Park et al., 2008; Carvalho and Lettieri, 2011; Whit-ney et al., 2011), Thalassiosira weissflogii (Davis et al., 2006; McGinn and Morel, 2008a; Park et al., 2008; Whitney et al., 2011), Phaeodactylum tricornutum (Siaut et al., 2007; McGinn and Morel, 2008a), Emiliana huxleyi (Bruhn et al., 2010; Richier et al., 2011),
Mi-cromonas pusilla (McDonald et al., 2010), Chlamydomonas reinhardtii (Moseley et al., 2006;
Zhao et al., 2009), Alexandrium spp. (Lee et al., 2009; Moustafa et al., 2010), Symbiodinium sp. (Rosic et al., 2010b,a; Leggat et al., 2011), Prorocentrum minimum (Guo and Ki, 2012),
Aureococcus anophagefferens (Berg et al., 2008; Wurch et al., 2011a), Solanum tuberosum
(Nicot et al., 2005), and Arabidopsis thaliana (Avonce et al., 2004). Results from the current literature survey yielded a list of 18 key reference genes frequently employed in the study of gene expression for eukaryotic phytoplankton and plants: actin, calmodulin, cyclin depen-dent kinase, cyclophilin, cytochrome c, G-protein beta subunit, ferric enterobactin binding periplasmic protein precursor, histones, elongation factors, GAPDH, heat shock protein 90, poly(A) polymerase, ribosomal protein large subunit, ribosomal protein small subunit, SAM, a-, 3-, y-tubulin, and ubiquitin conjugating enzymes (Data Sheet 2-1). It is important to note that as more reference genes are validated as stable, the selection of putative reference genes may expand. The 101 genes identified as homologous to these reference genes across the four treatments in T. pseudonana had variable expression patterns and a wide range of mean normalized counts (0.08 to 1087.8 TPM) (Figure 2-1). Genes within a specific gene family (e.g. the five actin genes) had different mean counts as well as variable coefficients of variation (CV), which is indicative of variable expression (Data Sheet 2-1). For example,
ACT 1 (NCBI: 7449411) had a mean expression of 1024.1 TPM and a CV of only 12.3%,
where as ACT 5 (NCBI: 7445819) had a lower mean expression of 23.95 and a higher CV of
35.5% (Data Sheet 2-1).
The high-throughput transcript dataset was analyzed with k-means clustering. Prior to performing k-means cluster analysis, FOM optimization was run and found to be minimized at k = 15. Thus, k-means analysis was run under the Pearson correlation coefficient for
k = 15, yielding 15 clusters, for which the intra-cluster variation was minimized (Figure
A-2). Of the 15 clusters produced (ranging in size from 162 to 954 genes), Cluster 4 (433 genes), Cluster 9 (243 genes), and Cluster 14 (466 genes) had candidate reference genes based on a low magnitude of change associated with the expression patterns in those clusters (Figure A-2). However, Cluster 4 showed a clear pattern of differential regulation (downregulated in the replete and upregulated in the co-limited), and as such it was not considered to be an optimal candidate cluster and was excluded from additional analyses. Both Cluster 9 and Cluster 14 consisted of genes with a wide range in mean TPM values (1.74 to 4191.91 TPM), with relatively small deviations from the mean value (Figure 2-1; Data Sheet 2-2), which stands in contrast to other clusters that had definite treatment driven expression patterns (Figure A-2). Despite the relatively small deviations from the mean value, genes in Clusters 9 and 14 displayed both clear patterns of regulation, as demonstrated by the average change in tag count relative to the mean (Figure 2-2) and the presence of "outlier" genes with differential expression such as NCBI: 7451632, which was downregulated in the co-limited treatment for Cluster 14 (Figure 2-1; Data Sheet 2-2).
Adapting ASC to examine stable expression patterns, genes for which the post-p was less than 0.1 (e.g. had less than a 10% chance of equaling or exceeding the fold change cutoff) were plotted in three low fold change bins: 1.10, 1.25, and 1.50. A post-p of 0.1 was selected as it optimized the dataset for a wide range of mean gene expression values and provided coverage for each of the fold change bins examined (Table 2-1). The number of genes in each of the fold change bins increased with increasing value of fold change. For example, two genes passed the 1.10 cutoff, 179 genes passed the 1.25 cutoff, and 1375 genes passed the 1.50 cutoff. With the increase in the number of genes came an increase in the variation from the mean of the normalized tag counts (Figure 2-1; Data Sheet 2-3).
The bin with the 1.10 cutoff had two genes (NCBI: 7446346 and 7452192), which are both hypothetical proteins (Figure 2-1). A BLASTn search of 7446346 against the nr NCBI database yielded 69% identity over 251 base pairs (e-value, le-13) to a hypothetical pro-tein (NCBI: CP000544.1) from Halorhodospira halophila, a salt-tolerant purple bacterium, and 69% identity over 232 base pairs (e-value, le-12) to a hypothetical protein (NCBI:
CP001905.1) from Thioalkalivibrio sp. K90mix, also a salt-tolerant chemolithoautotrophic
bacteria. BLASTp searches of 7452192 showed the highest identity hits to hypothetical pro-teins from Aureococcus anophagefferens (NCBI: EGB11506.1; 31% identity; e-value, 2e-21)