HAL Id: halshs-03142214
https://halshs.archives-ouvertes.fr/halshs-03142214
Preprint submitted on 15 Feb 2021
HAL is a multi-disciplinary open access
archive for the deposit and dissemination of sci-entific research documents, whether they are pub-lished or not. The documents may come from teaching and research institutions in France or abroad, or from public or private research centers.
L’archive ouverte pluridisciplinaire HAL, est destinée au dépôt et à la diffusion de documents scientifiques de niveau recherche, publiés ou non, émanant des établissements d’enseignement et de recherche français ou étrangers, des laboratoires publics ou privés.
Political Cleavages, Class Structures, and the Politics of
Old and New Minorities in Australia, Canada, and New
Zealand, 1963-2019
Amory GethinTo cite this version:
Amory Gethin. Political Cleavages, Class Structures, and the Politics of Old and New Minorities in Australia, Canada, and New Zealand, 1963-2019. 2021. �halshs-03142214�
World Inequality Lab – Working Paper N° 2021/05
Political Cleavages, Class Structures and
the Politics of Old and New Minorities
in Australia, Canada, and New Zealand
1963-2019
Amory Gethin
1
Political Cleavages, Class Structures, and the Politics of Old and New Minorities in Australia, Canada, and New Zealand, 1963-2019
Amory Gethin
February 2021
Paris School of Economics – World Inequality Lab. I am grateful to Jennifer Curtin, Gary Marks, Clara
Martínez-Toledano, and Thomas Piketty for their useful comments and advices. I also wish to thank the teams of the Australian Data Archive, the Australian Election Studies, the Canadian Election Studies, and the New Zealand Election Studies for making the data exploited in this paper available.
Abstract
This paper studies the long-run transformation of the structure of political cleavages in Australia, Canada, and New Zealand. Regional, linguistic, and religious identities inherited from nation-building processes have differentially shaped the representation of social inequalities in the former dominions. I discuss how the politics of “old minorities” – Catholics of Irish descent in Australia, French speakers of Québec in Canada, and the Māori in New Zealand – have interacted with the politics of class and the formation of electoral divides. In all three countries, higher-educated voters have become increasingly supportive of labor, social democratic, liberal, and green parties, while high-income voters have remained more likely to vote for conservative forces, leading to the emergence of “multi-elite party systems” comparable to that found in other Western democracies. Nonetheless, nativist cleavages remain more limited in these democracies than in Western Europe, as illustrated by the only moderate support of immigrants and new minorities for left-wing and liberal parties.
2
Introduction
A recent literature has used post-electoral surveys to study how the changing structure of political cleavages relates to the evolution of income, wealth, and educational inequalities in Western democracies, and how these inequalities are represented by party systems in the long run (see for instance Piketty 2018; Gethin, Martínez-Toledano and Piketty 2019; Kosse & Piketty 2020). One of the objectives of these studies has been to construct unified series on the structure of the vote by income, wealth, education, and other sociodemographic characteristics of voters, to better contextualize recent political events and the rise of identity politics in light of broader long-run historical trajectories.
This paper contributes to this literature by combining existing post-electoral surveys conducted in Australia, Canada, and New Zealand since the 1960s to study the evolution of political cleavages in these three countries. The democratic politics of the old British dominions were shaped by differing patterns of religious, linguistic, and ethnic diversity inherited from the processes of settler colonialism that took place in the nineteenth century. Historical specificities in the course of colonialist expansion contributed to differentially structure their party systems, the legacies of which can still be observed in contemporary politics, notably in the form of the linguistic cleavage in Canada, the religious cleavage in Australia, and the Māori-European cleavage in New Zealand.
Historical legacies have also been associated with significant differences in the old dominions’ party systems. In Australia and New Zealand, the strength of class politics in the postwar era clearly structured political conflicts on a left-right (labor versus conservative) axis. This was never the case in Canada, where the Liberal Party succeeded in aggregating a diverse and changing coalition as early as the 1960s. Yet, education has had a growing impact on electoral behaviors in all three countries, as higher-educated voters have increasingly tilted towards labor, green, and liberal parties. In Australia and New Zealand, this transformation
3
was largely driven by the rise of green parties; in Canada, it came more decisively from transformations within the existing Liberal Party and New Democratic Party.
The study of political cleavages in Australia, Canada, and New Zealand can also be useful to more generally understand the roots of political change in Western democracies. It has sometimes been argued, for instance, that the new educational divide in Western Europe could be accounted for by the growing importance of issues related to immigration, the integration of ethnoreligious minorities, or European integration. Understanding whether or not comparable changes are under way in the three countries studied in this paper, where immigration and the integration of old and new minorities have arguably taken different forms, can shed light on the contributions and limitations of such narratives.
Four main findings emerge from the analysis developed in this paper. First, in line with the existing literature, I document a long-run decline in class-based voting in Australia and New Zealand, but not in Canada, where it is well known that class cleavages never truly materialized and where class polarization may even have been growing since the 2000s. Secondly, I document a clear shift of higher-educated voters towards labor, social democratic, green, and liberal parties in these three countries. This has led to the emergence of “multi-elite” party systems comparable to that observed in other Western democracies (Gethin, Martínez-Toledano & Piketty 2019), in which top-income voters continue to vote for conservative parties, while most educated voters now support labor, green, liberal, and affiliated parties.
Thirdly, I investigate how the political representation of religious and ethnic minorities has intersected with the politics of class. In New Zealand, the overrepresentation of the Māori in low-income groups has reinforced class cleavages, as Māori voters have been disproportionately more likely to vote for the Labour Party, the Greens, and other left-wing parties. This is not the case in Australia and Canada, where Catholic minorities were not significantly poorer than the rest of the population, leading the religious cleavage to represent
4
an independent dimension of political conflicts. One interesting difference between Canada and Australia is that religious groups have remained more spatially and culturally differentiated in the former than in the latter, which may explain why Catholic-Protestant cleavages have persisted in Canada, while they have been gradually replaced by a secular-religious divide in Australia.
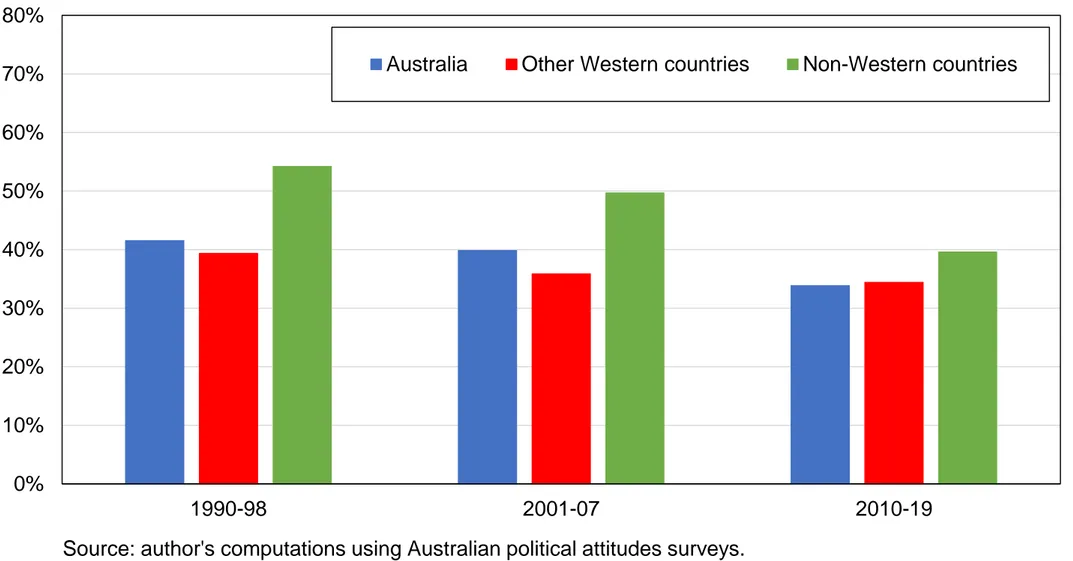
Finally, I exploit available data on respondents’ country of birth to capture the strength of a new “nativist” dimension of political conflicts. The main result that emerges from this analysis is that this dimension is much less pronounced in Australia, Canada, and New Zealand than in other Western European countries (see e.g. Piketty 2018; Kosse & Piketty 2020).1 In Australia and New Zealand, non-Western (mainly Asian) immigrants do not vote very differently from natives. One specificity of New Zealand, however, is the existence of the anti-immigration New Zealand First Party (NZF), which by receiving greater support from Māori voters has succeeded in “mobilizing” a minority against another. The NZF has joined coalitions with both the left and the right, which suggests that unlike what we observe in most European countries, immigration issues have not been absorbed into left-right divides in New Zealand. This is also true in Canada, where new Muslim and Sikh minorities have been more likely to vote for the Liberal Party than for the New Democratic Party.
Australia
The Transformation of the Australian Party System
1 The exception to this conclusion is the vote of the Muslim, Sikh, and Hindu religious minorities, which are, as
in most Western European countries, substantially more likely to vote for left-wing and liberal parties: see appendix Tables A3, B3, and C3. These minorities are however extremely small in the old dominions (typically less than 1 % of the adult population).
5
Australia inherited its political system from the United Kingdom. A two-party system, opposing the Australian Labor Party (ALP) to the Liberal/National coalition (an alliance of the Liberal Party and the National Party, formerly Country Party), persisted throughout most of the twentieth century. While other small parties have generally managed to gather between 10 percent and 20 percent of popular votes, the ALP and the coalition have been the two main actors of Australian politics since the end of World War II (see Figure 1).
The long-run decline of the ALP, from 50 percent of votes in 1946 to 33 percent in 2019, has nonetheless coincided with the rise of new parties, such as the Democratic Labor Party (1955-1978) that originated as a Catholic, anti-communist faction of the ALP, or the Australian Democrats (1977-2016), a centrist party breaking away from the Liberal Party, founded on principles related to direct democracy and environmental awareness. Since 1990, the Australian Greens have gained increasing support, adopting ideological stances further on the left of the political spectrum. These trends are comparable to the decline of social democratic parties and the concomitant rise of green parties in a number of other Western democracies. The One Nation Party (ONP), created in 1997 by former liberal candidate Pauline Hanson, is usually located to the right of the Liberal/National coalition. It has found greater support among older men, working-class voters, and residents of Queensland (Gibson et al. 2002), combining anti-immigration and anti-aboriginal positions with a platform of economic protectionism and support for farmers and small businesses (Grant et al. 2019). Finally, independent candidates have also grown in importance in recent years, and have proved critical to government formation and the balance of power (Curtin & Sheppard 2020), although the electoral system with single-member constituencies has mitigated the rise of small parties in the House of Representatives.
There have been significant changes in the policies proposed and implemented by the ALP in the past decades. Following the Chifley Labor government’s attempt to nationalize the banks in the late 1940s and the party’s failure to gain popular support in subsequent years, ALP leaders gradually reformed the party by limiting the influence of socialist and communist
6
movements (Scalmer 1997). Gough Whitlam, elected in 1972, conducted a series of social reforms, increasing the wages of public sector workers and introducing free university education and universal health care. However, Whitlam’s mandate was also linked to a period of political polarization, and he was controversially dismissed during an institutional crisis in a context of inflation, rising unemployment, and government scandals.
This episode led to a further “moderation” of the ALP’s policy proposals, which arose with the return of the party to power in 1983. The Labor governments of Bob Hawke (1983-1993) and Paul Keating (1993-1996) embraced a more economically liberal agenda, including free trade and the privatization of state-owned enterprises (Marks 2012). The evolution of income inequality in Australia during the past decades, as in most English-speaking countries, correlates with these shifts in ideological positions, declining significantly until the 1970s, before rising steadily from the mid-1980s onwards (Atkinson et al. 2007).
The Decline of Class Divides
I now turn to the study of electoral behaviors in Australia by drawing on comprehensive post-electoral surveys regularly conducted in Australia since 1987, the Australian Election Studies, as well as a number of other surveys, which allow me to cover the majority of elections held in the country between 1963 and 2019.2 Nearly all surveys have directly asked respondents
about their perceived feeling of class affiliation, which provides a unique insight into the effect of subjective class identities on the vote and its long-run evolution. This is shown in Figure 2, which plots the difference between the share of individuals considering that they belong to the “working class” or the “lower class” and the share of other voters voting for the ALP or the Greens. In the 1960s and 1970s, self-identified working-class voters were more
7
likely to vote for the ALP by about 30 percentage points. This gap gradually decreased in the following decades, both before and after controls, until reaching 7 percentage points in the 2010s.
This strong decline of class voting in Australia is consistent with the findings of other studies using similar variables or occupational categories, and was found to have started even earlier than the 1960s (McAllister 2011; Scott 1991; Aitkin 1982). Hence, in spite of the fact that subjective class affiliations do continue to be strongly correlated to income and education3, they have lost most of their relevance when it comes to explaining vote choices in federal elections. This is consistent with theories of political change emphasizing the supply side of electoral competition, that is the role played by political parties’ strategies, partly independently from societal changes, in shaping political cleavages (Marks 2012). The rise of undecided voters and the declining effect of partisanship on the vote also arguably played an important role in explaining this dealignment process (Marks 1993; Cameron & McAllister 2016).
The Transformation of the Religious Cleavage
Another historical division of Australian society opposed Catholics to the Protestant majority. This cleavage was imported by the first settlers of the early 19th century, perpetuated with the
immigration waves of Irish Catholics and English Anglicans associated with the gold rushes of the 1850s, and reinforced by the opposition between the nationalistic aspirations of the Irish in contrast to the loyalist positions of English and Scottish immigrants. These tensions then continued into the Australian party system, with Catholic organizations being closely tied to the ALP.
3 See appendix Table A2 on the stability of working-class affiliations and appendix Figures A67 and A68 on the
8
There has been a dramatic transformation of religious affiliations in Australia in the past decades, with the share of voters declaring no religion rising from less than 5 percent in the 1960s to nearly a third of the electorate in the 2010s. Almost all of this rise can be attributed to Protestants, whose share in the Australian population has declined from two thirds to one third of the voting age population, while the share of Catholics has remained stable at about 25 percent.4
What have been the consequences of this transformation on the structure of Australian political cleavages? As shown in Figure 3, a growing cleavage between religious and non-religious voters has emerged in parallel to the historical cleavage opposing Protestants and Catholics. The share of Catholics voting for the ALP (and later the Greens) has declined from 65 percent to 43 percent between the 1960s and the 2010s, while these two parties have become increasingly popular among voters declaring no religion.
This rising divide between religious and non-religious voters is consistent with the growing political salience of new social issues, such as the right to abortion or same-sex marriage, which have created growing debates and tensions in recent years. In the 2019 federal election, for instance, the ALP’s program included a requirement for public hospitals to offer abortion procedures, which led religious anti-abortion groups such as the Australian Christian Lobby to campaign against the party.
The Emergence of a Multi-Elite Party System
9
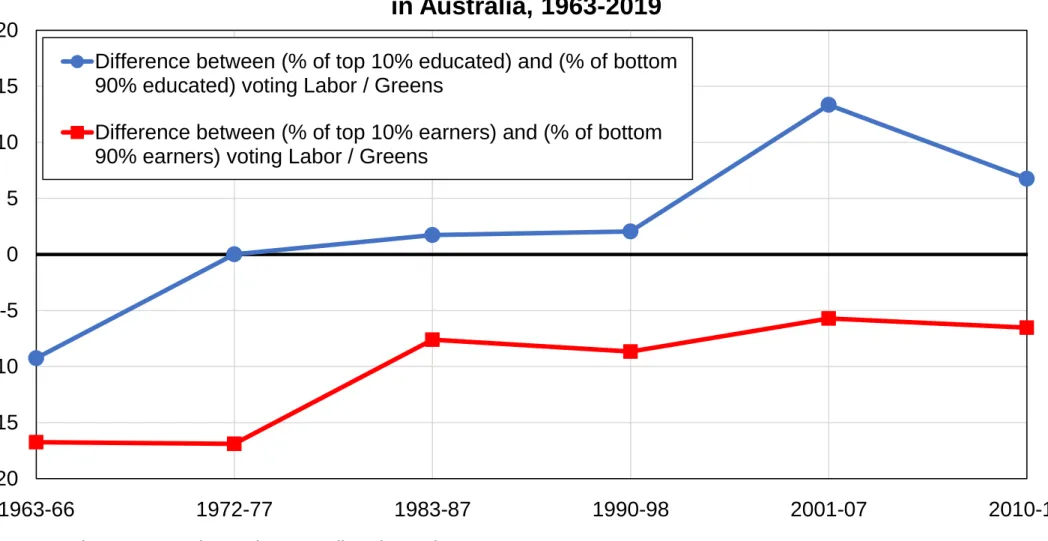
The transformation of Australia’s party system, as in many Western democracies (Gethin, Martínez-Toledano, and Piketty 2019), has also been associated with the political divergence of highest-educated and top-income voters. As shown in Figure 4, the ALP received much greater support among low-income voters than among the top 10 percent in the 1960s and 1970s. This gap has declined since then, but it has remained negative and relatively stable since the 1980s. Meanwhile, highest-educated voters have gradually shifted to the left, and are now significantly more likely to vote for the Labor and the Greens than the lower educated.
The Contemporary Structure of Australian Political Cleavages
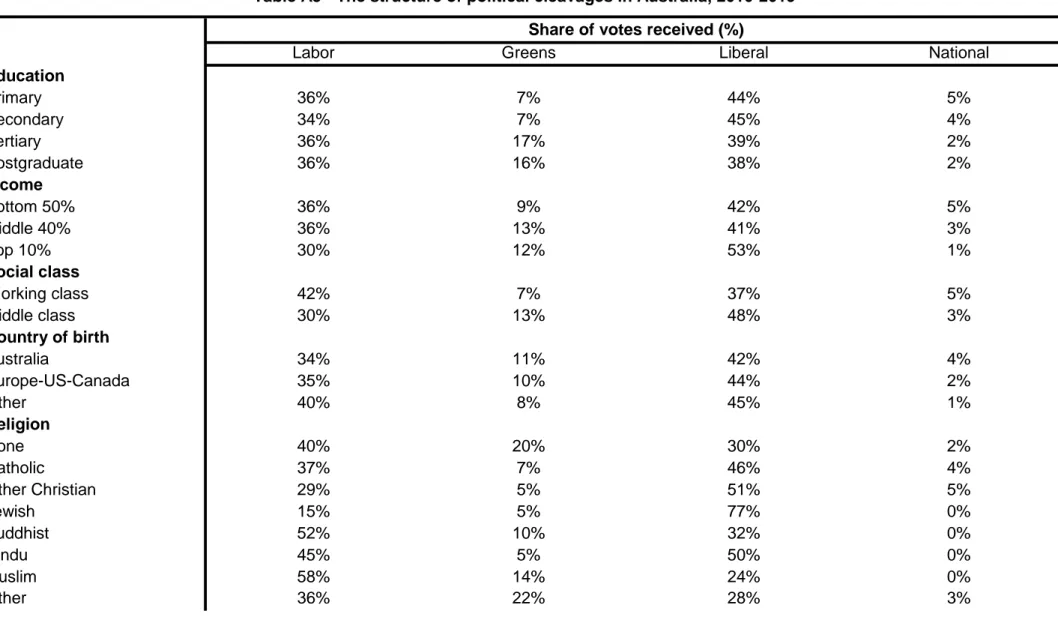
Table 1 provides a more granular perspective on the structure of the vote in the past decade by decomposing the share of votes received by the ALP, the Australian Greens, the National Party, and the Liberal Party by education, income, social class, and country of birth. A number of interesting results are visible. First, the Australian Greens’ voting base is completely different from that of the ALP: tertiary-educated voters, middle- and high-income voters, and self-identified middle-class voters disproportionately support them. Secondly, while the Labor received higher support among working-class voters, education and income only had a weak effect on voting for the ALP. This suggests that “residual” class identities are today of greater importance than actual economic status in determining support for the Labor. Thirdly, the structure of the vote for the Liberal Party and the National Party shows similar diverging patterns: the Liberal Party receives more votes from lower-educated, high-income voters, while the National Party performs better among working-class, lower-educated, low-income voters.
This fragmentation of the political space in Australia is similar to that found in the majority of Western European countries. In Western Europe, however, the shift of lower-educated voters towards the right was associated with the rise of both green and far-right parties; in Australia, it was more decisively driven by the Australian Greens. That being said, it is important to stress that this transformation is not only due to the rise of the Greens: there have also been
10
major changes in the structure of the vote for the Labor Party, which has become relatively less concentrated among low-income, lower-educated, and self-identified working-class voters in past decades.5 This change may have been the result of strategic shifts in the
positions and issue emphases of the Labor to avoid electoral leakage towards the Greens, but the long-run analysis also suggests that it started well before the Greens even existed. The electoral weakness of the extreme right in Australia might also explain why foreign-born individuals have only been marginally more likely to support left-wing parties in Australia, as shown in Table 1. This lower salience of the nativist cleavage is, as we shall see, common to the three old dominions.
New Zealand
New Zealand’s Party System
The beginning of New Zealand’s modern democracy goes back to the introduction of universal suffrage in 1893, which led to a first two-party system opposing the Liberal Party and the conservative Reform Party in the first elections of the twentieth century. The quick rise of the Labour Party, culminating in its victory in the 1935 general election, led to the amalgamation of liberal and conservative movements into the National Party in 1936.6 This
second two-party system, opposing the Labour Party to the National Party, persisted in the decades following the end of World War II (see Figure 5). Until the 1980s, the main minor party was the Social Credit, which scored between 10 percent and 20 percent of votes by drawing support from both National and Labour constituencies (Dickson 1969).
5 See appendix Figures A40 and A42.
6 The Liberal Party of the late nineteenth century did however make coalitions with parts of the labor movement,
visible in “Liberal-Labour” candidates, members of the Liberal Party who received endorsement by the Labour movement or trade unions.
11
The 1990s announced the end of the postwar two-party system. Small parties had already started growing in the 1970s and 1980s, notably the Values Party (often considered to be the world’s first environmentalist party of national significance), which polled 5 percent of the vote in 1975, as well as the libertarian New Zealand Party created by tycoon Bob Jones (12 percent of votes in 1984). However, it was the 1993 electoral reform that led to a decisive strengthening of new parties, with the adoption in 1996 of a mixed member proportional system in place of the first-past-the-post system operating since 1914.
In the proliferation of small parties that followed, only the Green Party and the New Zealand First (NZF) were able to emerge on a sustained basis. The Green Party traces its origin to the Values Party. After winning nearly 7 percent of votes in the 1990 elections, it co-founded the Alliance, a merger of other centrist and left-wing parties, which received 18 percent of votes in the 1993 elections. The Greens have run again independently since 1999, reaching 5 to 10 percent of votes in most elections (see Figure 5).
The NZF was founded in 1993 by former National Party politician Winston Peters, and was supported by 5 to 10 percent of voters in most elections since then. It has taken centrist positions on economic issues, and more conservative and nationalist positions on social issues. The policy proposals of the NZF have included, for instance, an annual cap on immigration, buying back state-owned enterprises, lowering taxes, and lengthening judicial sentences. The NZF has formed governments with both the National Party (1996 and 1998) and the Labour Party (2005 and 2017).
12
As in Australia, there have been significant ideological shifts in the policies implemented by ruling parties in New Zealand.7 Founded in 1916, the Labour Party has its origins in the trade
union movement but was always on the moderate side of socialist reform, banning members of the Communist Party from joining the organization. After securing a majority in 1938, it implemented a number of reforms in health, education, and social security, until it was defeated by the National Party in 1949. In the 1980s, the deregulation, privatization, and free trade programs implemented by Labour governments yet led to lasting internal dissent and eventually to a historical defeat in the 1990 general election, with only 35 percent of votes. Similar reforms of state restructuring and labor market liberalization were then pursued by the National government. While the Labour Party succeeded in coming back to power in coalition with small parties in the following years, the 1990s and 2000s saw a further decline of its popularity overall, which culminated with its all-time low vote share of 25 percent in 2014. The comeback of the Labour in 2017, followed by Jacinda Ardern’s crushing victory in the 2020 elections in the context of the COVID-19 pandemic, nonetheless seem to have announced a reversal of this medium-run trend.
The Decline of Class Divides
I now turn to documenting the evolution of political cleavages in New Zealand by drawing on a set of electoral surveys covering elections held between 1972 and 2017.8 As in the case of
Australia, I focus on three key transformations: the evolution of class voting, the vote of minorities, and the emergence of a multi-elite party system. I restrict the analysis to the determinants of the vote for the Labour Party, the Green Party, and a number of other minor center-left and left-wing parties.
7 See for instance Mulgan (2004), chapter 11. 8 See appendix Table B1.
13
Exactly as in Australia, there has been a sharp decline in class voting in New Zealand, both before and after controls: individuals identifying with the “working class” or the “lower class” were more likely to vote for the Labour by nearly 30 percentage points in the 1970s, compared to 10 percentage points in the past decade (Figure 6).
This transformation stands in contrast with the socioeconomic structure of subjective class affiliations, which has not changed significantly in the past decades: identification with the working class continues to strongly correlate with lower income levels.9 This is consistent, as in the Australian case, with the idea that changes in class voting have been primarily due to a transformation in the political representation of class. As suggested by Figure 6, and as other studies have documented using measures based on occupational categories, the decline of class-based voting was most pronounced at the end of the 1980s, when the Labour government implemented pro-market economic reforms, alienating many of its traditional working-class supporters (Haddon 2015; Mulgan 2004, chapter 12).
Ethnic Cleavages and the Vote of Māori, Pacific, and Asian Minorities in New Zealand
Unlike Australian aboriginals, indigenous people and immigrants have represented sizable minorities in New Zealand. In the 2018 census, 70 percent of the population identified as Pākehā (or European), 16.5 percent as Māori, 15 percent as Asian, and 9 percent as Pacific. Asians are the population group whose size has grown most dramatically in recent years, from 6.6 percent in 2001 to 15 percent in 2018, as New Zealand experienced some of the highest per capita immigration flows among OECD countries. Among ethnic minorities, it is however the Māori who have most consistently cumulated social disadvantages in the past decades, including poorer health, lower life expectancy, and lower income levels, even if inequalities
14
between Asians or Pacific people and Europeans are also significant and have persisted until today (Stats NZ, 2020; Marriott & Sim 2014).10
The indigenous status of the Māori in New Zealand has given them specific political rights, recognized by the three-article Treaty of Waitangi signed by representatives of the British Crown and Māori chiefs in 1840. The treaty both ceded complete government to the British Crown (article 1) and guaranteed that the Māori chiefs would retain their existing authority (article 2). Article 3 stated that the Māori people would be given full rights and protections as British subjects. Articles 2 and 3 were however soon forgotten, and colonial settlers deprived the Māori of a large share of their land in the second half of the nineteenth century through a combination of sales and confiscation. Furthermore, two versions of the treaty exist: one in Māori and one in English. The Māori version of article 1 did not cede sovereignty, but only governance, while the English version gave the queen the full right to power and sovereignty. These diverging interpretations have been a significant point of contest throughout New Zealand’s contemporary history. It was only by the 1930s that the first Labour government would make a decisive move towards honoring the treaty by ending ethnic discrimination in access to welfare benefits.11 In the 1970s, the second Labour government also set the Waitangi Tribunal to address renewed conflicts over land alienation, which led to further concessions and redistribution. Politically, Māori specificity was recognized though the Māori electorates, which have attributed reserved seats to Māori representatives since 1867 (7 of the 120 seats in the 2017 elections). People of Māori descent can choose to be on the Māori roll
10 The share of Māori in electoral surveys is much lower than in census data (see appendix Table B2), due to
difficulties at sampling the Māori electorate.
11 Historical connections between the Labour Party and Māori voters go far back in time, and were formalized
when the First Labour Government of 1935 allied with representatives of the Rātana movement. The Rātana Church has since then being instrumental in allowing the Labour to hold Māori electorates.
15
or on the general roll through the “Māori option” implemented in 1975 by the Labour government (Vowles et al. 2017).
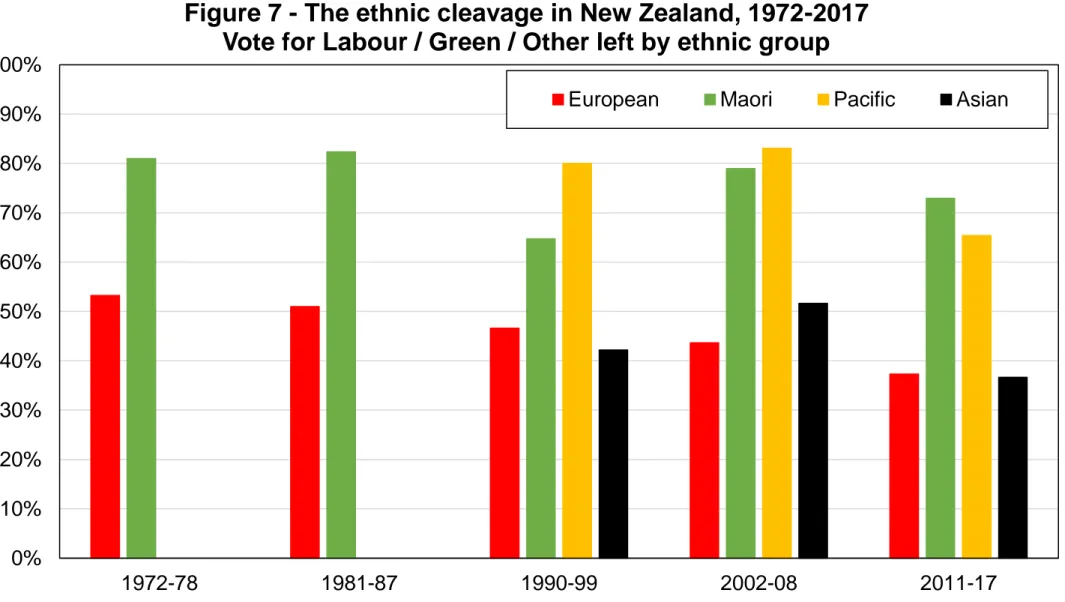
The past decades have therefore witnessed persisting debates over the politics of Māori representation, the surge of a new Asian immigration, and the rise of new parties specifically representing Māori interests – such as the Mana Motuhake, the Māori Party, or the Mana Movement. As shown in figure 7, Māori and Pacific people have always been disproportionately more likely to vote for the Labour and other left-wing parties since the 1970s, while Asian voters have remained approximately as likely as Europeans to do so. The Māori-Pākehā cleavage in New Zealand is therefore very strong, comparable in size, for instance, to the bias of Muslims in France towards left-wing parties (Piketty 2018). By contrast, the emergence of a new Asian minority does not seem to have generated any form of new electoral divide.
The Emergence of a Multi-Elite Party System
As Figure 8 shows, a multi-elite party system comparable to that visible in Australia seems to have gradually emerged in New Zealand, as highest-educated voters have become increasingly likely to vote for the Labour Party, the Greens, and affiliated parties since the 1970s. Meanwhile, there has been no secular trend in support for left-wing parties among top-income earners, whose tendency to vote conservative has stabilized at about 10 percentage points higher than that of low-income voters. As in Australia, the Green Party did play a significant role in this transformation by attracting a large share of higher-educated voters, but there have also been changes in the structure of the vote for the Labour Party, which used to receive greater support from lower-educated voters and has now been attracting a higher share
16
of the tertiary educated.12 Therefore, while the fragmentation of New Zealand’s party system
may have accelerated this transition, it cannot be held sole responsible for these changes.
The Contemporary Structure of Political Cleavages in New Zealand
The previous analysis has revealed three clearly identifiable dimensions of political conflicts in New Zealand: a declining class dimension, an ethnic dimension, and, more recently, a growing educational cleavage. Table 2 reveals some particularly interesting intersections between them by showing the structure of the vote for New Zealand’s four biggest parties in recent elections. The Labour Party appears to be a relatively hybrid entity today, still gaining votes from working-class and low-income voters – though less so than in previous decades –, but also attracting as many postgraduates as primary-educated voters. This is also the case of the Greens who, as in the case of Australia, are supported by middle-class, middle-income, and higher-educated citizens.
The vote for the New Zealand First, by contrast, is characterized by relatively unique patterns in comparative perspective. The NZF receives more votes from lower-educated, low-income, working-class voters. Given that the party has been fighting for both limitations to Asian immigration and lower taxes, it therefore closely resembles far-right Western European parties in that respect. However, in contrast to these parties, the NZF has not been primarily supported by the ethnic majority: 7 percent of Europeans voted for the NZF in the last three elections, compared to 12 percent of Māori voters. Even more surprising is the fact that Asians have been actually slightly more likely to vote for the National Party than for the Labour Party. This contrasts sharply with the dynamics visible in Western European countries, where immigrants and new minorities tend to be clearly supportive of social
17
democratic and affiliated parties, in the context of conservative parties’ increasing opposition to immigration.
These results are consistent with the idea that with the exception of the NZF, ruling parties in New Zealand – as well as the majority of citizens – have been relatively favorable to Asian immigration, or at least have not been sharply opposed to it (Vowles & Curtin 2020). In 2017, for instance, as much as 79 percent of New Zealanders answered “Strongly agree”, “Agree”, or “Neutral” when asked whether “Immigrants are generally good for New Zealand’s economy”. By contrast, the Māori were on average more opposed to immigration than Europeans: in 2017, 15 percent of Europeans strongly agreed to the above question, compared to 6 percent of self-identified Māori respondents.13 The NZF therefore represents a unique case of a party successfully “mobilizing” an ethnic minority against another.14 Unlike the majority of Western democracies, the politics of minorities in New Zealand have not been clearly integrated into the existing left-right axis, but seem to have represented a secondary, separated dimension of political conflict.
Canada
Canada’s Two-and-a-half Party System
Canada gained autonomy from British rule in the second half the nineteenth century, when in 1867 the self-governing Dominion of Canada was formed, and the first federal election was
13 Author’s computations using National Election Study data. See also Spoonley (2014).
14 Notice that part of the NZF’s success among Māoris may be due to a leader effect, as Winston Peters is partly
Māori. In fact, the NZF does not have particularly strong stances pushing for greater representation of Māori people, and has shifted from holding all five Māori electorates in 1996 to officially rejecting the electorate system, campaigning in 2017 in favor of a referendum on abolishing Māori seats.
18
won by the Conservative Party against the Liberal Party. Unlike in Australia and New Zealand, however, where the rise of the labor movement pushed towards the fusion of liberal and conservative forces, socialist movements never gained sufficient traction in Canada to significantly alter the old party system.15 The Co-operative Commonwealth Federation, founded in 1932 by socialist and social democratic groups, did not exceed 16 percent of votes at its peak in 1994. It then merged with the Canadian Labour Congress to form the New Democratic Party (NDP) in 1961. The NDP has not done much better since then, never exceeding 20 percent of votes, with the exception of the 2011 election (see Figure 9). The inability of left-wing movements to gain a majority of support at the national level resulted in large part, it has been argued, from the regionalization of Canadian politics, and more importantly from the inability of the NDP to connect with trade unions in Québec (Johnston 2012). The two biggest parties in Canada have therefore remained the Conservative Party and the Liberal Party.
Several minor parties have nonetheless played a secondary role in Canadian politics since the end of World War II. The Social Credit Party, a social-conservative party promoting social credit theories of monetary reforms, obtained 5 to 10 percent of votes in the 1960s and 1970s. The Reform party was a conservative party originally founded to give a voice to Western Canadians’ interests at the end of the 1980s, in a context of growing dissatisfaction towards the Conservative government elected in 1988. It dissolved in 2000 in favor of the Alliance, which itself joined the Conservative Party before the 2004 federal election. The Bloc Québécois has had a strong influence in Québec and has won the majority of seats in the province in most elections since 1993. It is both a social democratic and a separatist party, aiming to protect regional interests but also to defend social welfare programs. The Green Party of Canada, finally, founded in 1983, has grown from less than 1 percent of votes in
19
2000 to almost 7 percent in 2019, promoting environmentalism, social justice, and participatory democracy.
The evolution of parties’ ideological positions in Canada show a number of similarities with Australia and New Zealand. After World War II, the Liberals moved towards the left of the political spectrum on economic issues, especially during the Pierre Trudeau period (1968-1979 and 1980-1984). After the economic and political crises of the 1990s, however, Liberal governments (1993-2003 and 2003-2006) then started to defend more liberal economic positions, emphasizing the need to keep taxes low and a sustainable government debt. The Conservative party has also undergone significant changes since the 1960s. Originally, the party was generally considered to mainly represent English Canadians’ interests, bringing together a large share of the Protestant electorate. At the beginning of the 1980s, Progressive Conservatives shifted to promoting the values of free-market economics, especially under the Mulroney administration (1984-1993). Rising discontent with the conservatives under Mulroney’s second term – in particular the divisive Canada–US Free Trade Agreement, the 1980s recession and the implementation of the new Goods and Services Tax – led to the collapse of the Conservatives in the 1993 federal election, who received a mere 16 percent of votes. Finally, the New Democratic Party originally promoted a transition towards the end of capitalism and the establishment of a socialist society. It gradually moved towards the center of the political spectrum to become a social democratic party, promoting social welfare programs and liberal values. These two dimensions were directly visible in the NDP’s platform at the 2015 federal election, which included increasing corporate tax rates and reducing poverty, but also promoting gender equality and the welcoming of Syrian refugees (Andersen 2012).
Religious, Linguistic, and Regional Identities in Canada
Region, language, and religion were found to be the strongest predictors of electoral behaviors in Canada throughout the country’s democratic history (Andersen & Stephenson 2012; Carty
20
et al. 2000, chapter 2). The exceptional divide between French and English speakers, as well as the spread of the population on a large territory, were generally cited as factors accounting for the development of varieties of political cultures, party affiliations, and policy positions, which have persisted until today (Guth & Fraser 2001; Henderson 2004). These identities played a significant role in inhibiting the emergence of a stable class cleavage in the second half of the twentieth century. On the left of the political spectrum, the New Democratic Party was unable to unite union members of Québec and the Western provinces, thereby condemning the party to a role of secondary political actor (Johnston 2012). In addition, the importance of religious, linguistic, and regional affiliations in determining support for Liberals, Conservatives, and the NDP left little space for other dimensions of political conflict to fully materialize (Alford 1963). While some authors have argued that class does matter in some regions, or that the lack of class cleavage is the result of parties’ deliberate obliteration of class politics, there is a relative consensus that social class has remained a poor predictor of electoral behaviors overall (Gidengil 1989; Ornstein et al. 1980).
The Canadian electorate can be divided into four broad regions: Québec (about 26 percent of the voting age population), Ontario (38 percent), the Western Provinces (29 percent), and the Eastern Atlantic Provinces (7 percent). English speakers make up two thirds of the adult population, French speakers about 25 percent. Language, religion, and region have been tightly associated in Canada, though never perfectly. The majority of French speakers live in Québec and are Catholics, but about a third of Catholics are English speakers, and about a tenth of Québec residents are English speakers.16 Québec residents were historically significantly overrepresented in lower-income groups, even though regional inequalities
21
always remained limited in Canada in comparative perspective. These disparities have decreased significantly since then, but have not completely disappeared.17
Figure 10 reveals a remarkable persistence of religious cleavages in Canada by representing the relative support for the Conservatives, the NDP and the Greens, and the Liberal Party and the Bloc Québécois among specific religious affiliations. Putting the Liberal Party and the Bloc Québécois together for this particular analysis can be justified by the fact that the decline of the Liberal Party in Québec in the 1990s can be in large part attributable to the rise of the Bloc Québécois. Non-religious voters have always been supportive of the NDP, while the conservatives have always received much greater support from Protestants since the 1960s. The Liberal Party used to receive more votes from Catholics – many of which shifted to supporting the Bloc Québécois in the 1990s – and now attracts an important proportion of non-religious voters and new religious minorities (see below).
The religious cleavage in Canada has therefore remained exceptionally strong. While in Australia, the Catholic-Protestant cleavage was gradually replaced by a religious-secular cleavage, religious divisions in Canada have always been split in three, with non-religious voters voting for the NDP, Protestants voting for conservative parties, and Catholics (and more recently new religious minorities, see below) voting for the Liberals. The Australian Labour Party of the 1960s brought together the Catholic minority and the working class; the New Democratic Party, by contrast, never gained sufficient support in Québec and therefore remained more oriented towards non-religious voters of Ontario and the Western provinces, who only represented a small fraction of the population.18
17 See appendix Figures C80 to C87. Broad regional inequalities are low, but they are more significant when
considering smaller geographical entities: see Breau (2015).
18 See appendix Figures C29 to C35 for similar figures on region and language. See also Carty et al. (2000),
22
The Politicization of Inequality in Canada: A Persistent Lack of Class Cleavage?
As explained above, the existing literature on political cleavages in Canada failed to identify the existence of a stable class cleavage, whether using occupational categories or subjective measures of class affiliations. Figure 11 reproduces this finding by focusing on income, showing the relative support of top 10 percent income earners towards the three main Canadian parties. With the exception of the 1960s, top-income earners have always been less to likely to vote for the NDP and more favorable to the Conservatives, with the Liberal Party standing in between. Interestingly, these results are similar to those found in other Western democracies, with comparable orders of magnitude (see Gethin, Martínez-Toledano, and Piketty 2019), suggesting that socioeconomic divides in Canada are not exceptionally weak on that dimension.
Furthermore, the Liberal Party seems to have become gradually more oriented towards high-income voters since the 1970s, while support for the NDP has become increasingly concentrated among low-income constituencies in recent years. These results suggest that the politicization of inequality in Canada has changed significantly since the 1970s. On the one hand, the NDP followed a major transformation from a mainly urban, English-speaking party supported by union members and middle-income voters to a more broad-based party supported by the poor.19 On the other hand, the Liberal Party has now become more popular
among economic elites, making its voting base resemble more closely that of the Conservative Party in that respect. These results resonate well with the fact that both Liberals and Conservatives have been moving to the right of the political spectrum on economic matters in recent years, while the NDP has remained more left-wing (Andersen 2012).
23
It is also worth noticing that this transition has coincided with a marked decline in electoral turnout since the 1990s, from 75 percent in 1988 to 66 percent in 2019, so that the Liberals’ shift to the right may have been associated with a movement of low-income voters not only towards the NDP, but also towards abstention. Unfortunately, turnout cannot be studied consistently with the Canadian Election Studies without some substantive methodological corrections, as post-electoral surveys have been unable to correctly sample non-voters, especially in recent years (Achen & Wang 2019; Gethin 2018, chapter 6). This is left for future research.
The Emergence of a Multi-Elite Party System in Canada
Figure 12 suggests that as in Australia and New Zealand, there has been a growing educational divide opposing the Liberals, the NDP, and the Greens to the Conservative Party. This is especially visible in the relative support of higher-educated voters towards the Conservative Party, which was only marginally negative until the 1980s and declined substantially in the most recent elections.
Interestingly, in contrast to the majority of Western countries, the figure also reveals that lower-educated voters never were more inclined to vote for the NDP or the Liberal Party than for the Conservative party. This may perhaps be linked to the fact that class cleavages were never strong in Canada, so that no coalition was ever able to bring together the majority of the low-income, lower-educated electorate. Strikingly, the structure of the vote for the NDP in the 1960s was very similar to that of the Japan Socialist Party at the same period (Gethin 2021), being more concentrated among middle-income, urban, and higher-educated voters.20
24
The Contemporary Structure of Political Cleavages in Canada
Table 3 decomposes the structure of the vote for the main Canadian political parties in the last three elections. Four interesting results stand out. First, Canada’s party system clearly appears to divide top-income and highest-educated voters in the same way as it does in other Western countries. Higher-educated voters are much less supportive of the conservatives than the lower educated, while top-income earners are more likely to vote for them. On the other side of the political spectrum, the NDP and the Greens receive greater support from both low-income and higher-educated voters. The Liberal Party has somehow managed to bring together both types of elites, so that Canada’s multi-elite party system closely resembles that visible in France in 2017, where higher education tilted voters towards the left, higher income tilted voters towards the right, and En Marche! united some voters from both groups at the center of the political spectrum (Piketty 2018). In that sense, Canada’s recent political transformations do not appear particularly unique. Regionalization and linguistic identities may explain in part why class politics in Canada differed significantly from most Western countries in the early postwar decades, but this is not the case today.
That being said, language and religion do continue to strongly influence electoral behaviors. The NDP and the Greens attract a higher share of non-religious voters, while the Conservative Party gets the majority of protestant votes. The Liberal Party stands in between and finds strongest support among new Buddhist, Hindu, Muslim, and Sikh minorities. The Bloc Québécois has declined since the 1990s, but it still received about a quarter of French votes in the past decade, and almost no votes from other linguistic groups. In contrast to Spain, where independentism has been supported by the elites (Bauluz, Gethin, Martínez-Toledano, and
25
Morgan 2021), the Bloc Québécois seems to be slightly more successful among low-income and primary-educated voters.21
Finally, as in Australia and New Zealand, Canadian politics do not seem to display a particularly pronounced nativist dimension. In countries like France, the United States or Germany, new ethnic minorities have disproportionately supported social democratic, democratic, and socialist parties (Piketty 2018; Kosse and Piketty 2020). In Canada, it is the Liberal Party that has been most successful among new religious minorities and citizens born in non-Western countries.
26
References
C. H. Achen and T. Y. Wang, “Declining voter turnout in Taiwan: A generational effect?” Electoral Studies 58 (2019): 113–124.
D. Aitkin, Stability and Change in Australian Politics (ANU Press, 1982).
R. R. Alford, Party and Society (Rand-McNally, 1963).
R. Andersen, “The Class–Party Relationship in Canada, 1965–2004,” In Political Choice Matters: Explaining the Strength of Class and Religious Cleavages in Cross–national Perspective, ed. G. Evans and N. D. Graaf (Oxford University Press, 2012), 165–182.
C. D. Anderson and L. B. Stephenson, “The Puzzle of Elections and Voting in Canada”, in Voting Behaviour in Canada, ed. C. D. Anderson and L. B. Stephenson (UBC Press, 2010), 1–39
A. B. Atkinson, B. Anthony, and A. Leigh, “The Distribution of Top Incomes in Australia”, Economic Record 83, no. 262 (2007): 247–261.
L. Bauluz, A. Gethin, C. Martínez-Toledano, and M. Morgan, “Historical Political Cleavages and Post-Crisis Transformations in Italy, Spain, Portugal and Ireland, 1953-2020” (World Inequality Lab Working Paper 2021/01, 2021).
S. Breau, “Rising Inequality in Canada: A Regional Perspective,” Applied Geography 61 (2015): 58–69.
S. M. Cameron and I. McAllister, “Trends in Australian Political Opinion” (Australian National University, 2016).
R. K. Carty, W. Cross, and L. Young, Rebuilding Canadian Party Politics (UBC Press, 2000).
J. Curtin and J. Sheppard, “The Independents,” in Morrison’s Miracle: The 2019 Australian Federal Election, ed. A. Gauja, M. Sawer, and M. Simms (ANU Press, 2020), 359–373.
27
S. L. Dickson, “Social Credit and Class Voting,” Political Science 21, no. 1 (1969): 31-41. A. Gethin, Cleavage Structures and Distributive Politics (Paris School of Economics, 2018).
A. Gethin, “Political Cleavages and the Representation of Social Inequalities in Japan, 1953-2017” (World Inequality Lab Working Paper, 2021).
A. Gethin, C. Martínez-Toledano, and T. Piketty, “Political Cleavages and Inequality: Evidence from Electoral Democracies, 1950-2018” (Preliminary results, 2019: http://piketty.pse.ens.fr/files/GethinMartinezPiketty2019Slides.pdf).
R. Gibson, I. McAllister, and T. Swenson, “The Politics of Race and Immigration in Australia: One Nation Voting in the 1998 Election,” Ethnic and Racial Studies 25, no. 5 (2002): 823–844.
E. Gidengil, “Class and Region in Canadian Voting: A Dependency Interpretation,” Canadian Journal of Political Science / Revue Canadienne de Science Politique 22, no. 3 (1989): 563– 587.
B. Grant, T. Moore, and T. Lynch, eds., The Rise of Right-Populism: Pauline Hanson’s One Nation and Australian Politics (Springer, 2019).
J. L. Guth and C. R. Fraser, “Religion and Partisanship in Canada,” Journal for the Scientific Study of Religion 40, no. 1 (2001): 51–64.
E. Haddon, “Class Identification in New Zealand: An Analysis of the Relationship between Class Position and Subjective Social Location,” Journal of Sociology 51, no. 1 (2015): 737-754.
A. Henderson, “Political Cultures in Canada,” Canadian Journal of Political Science / Revue Canadienne de Science Politique 37, no. 3 (2004): 595–61
R. Johnston, “The Class Basis of Canadian Elections” (Paper presented at the Annual Meeting of the Canadian Political Science Association, 2012).
28
F. Kosse and T. Piketty, “Electoral Cleavages and Socioeconomic Inequality in Germany 1949-2017” (WID.world Working Paper 2020/15, 2020).
G. N. Marks, “Accounting for the Declining Impact of Class on the Vote in Australia” In Political Choice Matters: Explaining the Strength of Class and Religious Cleavages in Cross-national Perspective, ed. G. Evans and N. D. Graaf (Oxford University Press, 2012), 247– 261.
G. N. Marks, “Partisanship and the Vote in Australia: Changes over Time 1967-1990,” Political Behaviour 15, no. 2 (1993): 137–166.
L. Marriott and D. Sim, “Indicators of Inequality for Māori and Pacific People,” (Working Paper, 2014).
I. McAllister, The Australian Voter: 50 Years of Change (University of New South Wales Press, 2011).
R. Mulgan, Politics in New Zealand, 3rd ed. (Auckland University Press, 2004).
M. D. Ornstein, H. M. Stevenson, and A. P. Williams, “Region, Class and Political Culture in Canada,” Canadian Journal of Political Science / Revue Canadienne de Science Politique 13, no. 2 (1980): 227–271.
T. Piketty, “Brahmin Left vs Merchant Right: Rising Inequality and the Changing Structure of Political Conflict. (Evidence from France, Britain and the US, 1948-2017)” (WID.world Working Paper 2018/7, 2018).
S. Scalmer, “The Affluent Worker or the Divided Party? Explaining the Transformation of the ALP in the 1950s,” Australian Journal of Political Science 32, no. 3 (1997): 401–418.
A. Scoot, Fading Loyalties: The Australian Labor Party and the Working Class (Pluto Press Australia, 1991).
P. Spoonley, “Rising Asian Immigration Highlights New Zealand’s Changing Demographics,” (The Conversation, 2014).
29
Stats NZ, “Ethnicity,” accessed May 16, 2020, https://www.stats.govt.nz/topics/ethnicity.
J. Vowles, H. Coffé, and J. Curtin, A Bark but No Bite. Inequality and the 2014 New Zealand General Election (ANU Press, 2017).
J. Vowles and J. Curtin, A Populist Exception? The 2017 New Zealand General Election (ANU Press, 2020).
0% 10% 20% 30% 40% 50% 60% 70% 1945 1950 1955 1960 1965 1970 1975 1980 1985 1990 1995 2000 2005 2010 2015 2020 Share of v ot es (%)
Figure 1 - Election results in Australia, 1946-2019
Australian Labor Party Liberal Party / Liberal National Party
Greens National / Country Party
Australian Democrats One Nation Party
Democratic Labor Party
Source: author's computations using official election results.
Note: the figure shows the share of votes received by selected political parties or groups of parties in federal elections held in Australia
0 5 10 15 20 25 30 35 40 45 50 1963-66 1972-77 1983-87 1990-98 2001-07 2010-19
Figure 2 - The decline of class voting in Australia, 1963-2019
Difference between (% of working/lower class) and (% of other voters) voting Labor / Greens After controlling for income, education
After controlling for income, education, age, gender, religion, employment status, marital status, home ownership, location
Source: author's computations using Australian electoral surveys.
Note: the figure shows the difference between the share of voters identifying with the "working class" or the "lower class" and the share
of voters identifying with the "middle class" or "no class" voting for the Labor Party or the Australian Greens, before and after controls. Class voting has significantly declined in Australia in the past decades.
0% 10% 20% 30% 40% 50% 60% 70% 80% 1963-66 1972-77 1983-87 1990-98 2001-07 2010-19
Figure 3 - The religious cleavage in Australia
Vote for ALP / Greens by religious affiliation, 1963-2019
No religion Catholic Protestant
Source: author's computations using Australian electoral surveys.
Note: the figure shows the share of votes received by the Australian Labor Party and the Australian Greens by religious affiliation.
Between the 1960s and the 2010s, support for these parties declined significantly among Catholic voters, while it increased slightly among non-religious voters.
-20 -15 -10 -5 0 5 10 15 20 1963-66 1972-77 1983-87 1990-98 2001-07 2010-19
Figure 4 - The emergence of a multi-elite party system
in Australia, 1963-2019
Difference between (% of top 10% educated) and (% of bottom 90% educated) voting Labor / Greens
Difference between (% of top 10% earners) and (% of bottom 90% earners) voting Labor / Greens
Source: author's computations using Australian electoral surveys.
Note: the figure shows the relative support of top-income and highest-educated voters for the Labor Party and the Australian Greens. In
the 1960s, top-income and highest-educated voters were less likely to vote Labor than low-income and lower-educated voters. The Labor / Green vote has gradually become associated with higher-educated voters, giving rise to a "multi-elite party system". Estimates control for income/education, age, gender, religion, employment status, marital status, subjective class, home ownership, and location.
Labor Greens Liberal National Education Primary 36% 7% 44% 5% Secondary 34% 7% 45% 4% Tertiary 36% 17% 39% 2% Postgraduate 36% 16% 38% 2% Income Bottom 50% 36% 9% 42% 5% Middle 40% 36% 13% 41% 3% Top 10% 30% 12% 53% 1% Social class
Working / lower class 42% 7% 37% 5%
Middle / no class 30% 13% 48% 3%
Country of birth
Australia 34% 11% 42% 4%
Europe-US-Canada 35% 10% 44% 2%
Non-Western countries 40% 8% 45% 1%
Table 1 - The structure of political cleavages in Australia, 2010-2019 Share of votes received (%)
Source: author's computations using Australian electoral surveys.
Note: the table shows the average share of votes received by the main Australian political parties
by selected individual characteristics over the 2010-2019 period. During the past decade, the Australian Greens have received greater support from higher-educated voters, high-income voters, voters identifying with the middle class or with no class, and voters born in Australia.
0% 10% 20% 30% 40% 50% 60% 70% 80% 1945 1950 1955 1960 1965 1970 1975 1980 1985 1990 1995 2000 2005 2010 2015 2020 Share of v ot es (%)
Figure 5 - Election results in New Zealand, 1946-2020
Labour Party National Party Social Credit
Green / Values / Alliance New Zealand First
Source: author's computations using official election results.
Note: the figure shows the share of votes received by selected political parties or groups of parties in general elections held in New
0 5 10 15 20 25 30 35 40 45 1972-78 1981-87 1990-99 2002-08 2011-17
Figure 6 - The decline of class voting in New Zealand, 1972-2017
Difference between (% of working/lower class) and (% of other voters) voting Labour / Green After controlling for income, educationAfter controlling for income, education, age, gender, occupation, home ownership, marital status, ethnic group, religion, church attendance, country of birth, location, union membership
Source: author's computations using New Zealand electoral surveys.
Note: the figure shows the difference between the share of voters identifying with the "working class" or the "lower class" and the share
of voters identifying with the "middle class" or "no class" voting for the Labour Party / the Greens / other left-wing parties, before and after controls. Class voting has significantly declined in New Zealand in the past decades.
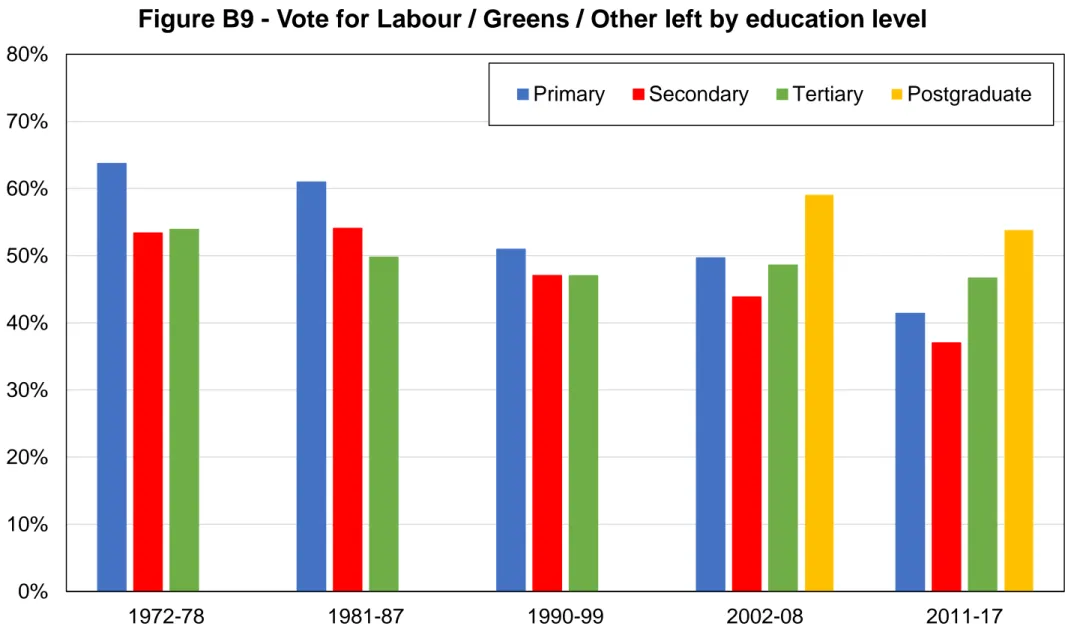
0% 10% 20% 30% 40% 50% 60% 70% 80% 90% 100% 1972-78 1981-87 1990-99 2002-08 2011-17
Figure 7 - The ethnic cleavage in New Zealand, 1972-2017
Vote for Labour / Green / Other left by ethnic group
European Maori Pacific Asian
Source: author's computations using New Zealand electoral surveys.
Note: the figure shows the share of votes received by the New Zealand Labour Party, the Green Party, and other left-wing parties by
ethnic group. Voters identifying as "European" or "Asian" have remained significantly less likely to vote for these parties than voters identifying as"Māori" or "Pacific".
-20 -15 -10 -5 0 5 10 15 20 1972-78 1981-87 1990-99 2002-08 2011-17
Figure 8 - The emergence of a multi-elite party system
in New Zealand, 1972-2017
Difference between (% of top 10% educated) and (% of bottom 90% educated) voting Labour / Greens / Other left
Difference between (% of top 10% earners) and (% of bottom 90% earners) voting Labour / Greens / Other left
Source: author's computations using New Zealand electoral surveys.
Note: the figure shows the relative support of top-income and highest-educated voters for the New Zealand Labour Party, the Green
Party, and other left-wing parties. In the 1970s-1980s, top-income and highest-educated voters were less likely to vote for left-wing parties than low-income and lower-educated voters. The left-wing vote has gradually become associated with higher-educated voters, giving rise to a "multi-elite party system". Estimates control for income/education, age, gender, occupation, home ownership, marital status, ethnic affiliation, religion, church attendance, country of birth, location, and union membership.
Labour Greens National NZF Education Primary 35% 4% 43% 11% Secondary 27% 9% 49% 7% Tertiary 27% 17% 44% 3% Postgraduate 36% 15% 33% 5% Income Bottom 50% 34% 8% 37% 9% Middle 40% 25% 10% 51% 5% Top 10% 18% 9% 63% 4% Social class
Working / lower class 34% 7% 32% 14%
Middle / upper / no class 21% 11% 48% 6%
Ethnicity
European 27% 10% 48% 7%
Māori 47% 8% 11% 12%
Pacific 64% 0% 23% 11%
Asian 29% 5% 57% 0%
Table 2 - The structure of political cleavages in New Zealand, 2011-2017 Share of votes received (%)
Source: author's computations using New Zealand electoral surveys.
Note: the table shows the average share of votes received by the main New Zealand political
parties by selected individual characteristics over the 2011-2017 period. During the past decade, the NZF has received greater support from lower-educated voters, low-income voters, and voters identifying as Māori.
0% 10% 20% 30% 40% 50% 60% Share of v ot es (%)
Figure 9 - Election results in Canada, 1945-2019
Liberal Party Conservative Party New Democratic Party Green Party Bloc Québécois Reform / Alliance Social Credit
Source: author's computations using official election results.
Note: the figure shows the share of votes received by selected political parties or groups of parties in federal elections held in Canada
between 1945 and 2019. The Liberal Party received 33% of votes in 2019. The Conservative Party corresponds to the Progressive Conservative Party of Canada before 2002. The New Democratic Party corresponds to the Co-operative Commonwealth Federation before 1962.
-30 -20 -10 0 10 20 30 40 50 60 1963-68 1974-79 1980-88 1993-97 2000-08 2011-19
Figure 10 - The religious cleavage in Canada, 1963-2019
Difference between (% Protestants) and (% other voters) voting Conservative / Reform Difference between (% non-religious) and (% other voters) voting NDP / Green
Difference between (% Protestants) and (% other voters) voting Liberal / Bloc Québécois
Source: author's computations using Canadian electoral surveys.
Note: the figure shows the relative support of voters belonging to specific religious groups for the main Canadian political parties, after
controlling for income, education, age, gender, employment status, marital status, country of birth, and union membership. Protestant voters have remained significantly more likely to vote conservative than non-Protestants, while non-religious voters have remained more supportive of the New Democratic Party and the Green Party.
-12 -10 -8 -6 -4 -2 0 2 4 6 8 10 12 14 16 18 20 1963-68 1974-79 1980-88 1993-97 2000-08 2011-19
Figure 11 - Political conflict and income in Canada, 1963-2019
Difference between (% of top 10% earners) and (% of bottom 90% earners) voting Conservative Difference between (% of top 10% earners) and (% of bottom 90% earners) voting Liberal
Difference between (% of top 10% earners) and (% of bottom 90% earners) voting NDP
Source: author's computations using Canadian electoral surveys.
Note: the figure shows the difference between the share of top 10% earners and the share of bottom 90% earners voting for the main
Canadian political parties, after controlling for education, religion, age, gender, employment status, marital status, country of birth, and union membership. With the exception of the 1960s, the Conservative Party has always been more popular among high-income voters, while support for the New Democratic Party has become increasingly concentrated among low-income voters.
-10 -8 -6 -4 -2 0 2 4 6 8 10 12 14 16 18 20 1963-68 1974-79 1980-88 1993-97 2000-08 2011-19
Figure 12 - Educational divides in Canada, 1963-2019
Difference between (% of top 10%) and (% of bottom 90%) educated voting Liberal / NDP / Green Difference between (% of top 10%) and (% of bottom 90%) educated voting Liberal
Difference between (% of top 10%) and (% of bottom 90%) educated voting NDP
Difference between (% of top 10%) and (% of bottom 90%) educated voting Conservative
Source: author's computations using Canadian electoral surveys.
Note: the figure shows the difference between the share of top 10% educated voters and the share of bottom 90% educated voters
voting for the main Canadian political parties, after controlling for income, religion, age, gender, employment status, marital status, country of birth, and union membership. The Liberal Party, the New Democratic Party, and the Green Party have always received greater support from higher-educated voters, while the conservative vote has become increasingly concentrated among the lower educated since the 1990s.
New Democratic Party Green Party Liberal Party Conservative Party Bloc Québécois Education Primary 22% 3% 22% 43% 7% Secondary 23% 5% 27% 37% 7% Tertiary 25% 4% 34% 32% 5% Postgraduate 21% 6% 37% 29% 6% Income Bottom 50% 26% 5% 28% 32% 8% Middle 40% 23% 4% 30% 36% 6% Top 10% 15% 3% 34% 43% 4% Religion None 27% 7% 32% 26% 6% Catholic 25% 3% 27% 31% 13% Other Christian 18% 4% 25% 51% 1% Jewish 6% 2% 41% 49% 0% Buddhist 31% 4% 41% 21% 2% Hindu 33% 2% 38% 27% 0% Muslim 27% 1% 63% 9% 1% Sikh 26% 1% 54% 19% 0% Other 18% 8% 31% 39% 1% Country of birth Canada 24% 5% 28% 35% 7% Europe / US 25% 4% 29% 39% 1% Non-Western countries 18% 3% 42% 36% 1%
Table 3 - The structure of political cleavages in Canada, 2011-2019 Share of votes received (%)
Source: author's computations using Canadian electoral surveys.
Note: the table shows the average share of votes received by the main Canadian political
parties by selected individual characteristics over the 2011-2019 period. The Liberal Party received greater support from high-income, higher-educated, and Muslim voters.