HAL Id: hal-00150473
https://hal.archives-ouvertes.fr/hal-00150473
Submitted on 30 May 2007HAL is a multi-disciplinary open access archive for the deposit and dissemination of sci-entific research documents, whether they are pub-lished or not. The documents may come from teaching and research institutions in France or abroad, or from public or private research centers.
L’archive ouverte pluridisciplinaire HAL, est destinée au dépôt et à la diffusion de documents scientifiques de niveau recherche, publiés ou non, émanant des établissements d’enseignement et de recherche français ou étrangers, des laboratoires publics ou privés.
Gwendal Fève, Adrien Mahé, Jean-Marc Berroir, Takis Kontos, Bernard
Plaçais, Christian Glattli, A. Cavanna, Bernard Etienne, Yong Jin
To cite this version:
Gwendal Fève, Adrien Mahé, Jean-Marc Berroir, Takis Kontos, Bernard Plaçais, et al.. An On-Demand Coherent Single Electron Source. Science, American Association for the Advancement of Science, 2007, 316, pp.1169. �10.1126/science.1141243�. �hal-00150473�
hal-00150473, version 1 - 30 May 2007
An On-Demand Coherent Single Electron Source
G. F`eve,1 A. Mah´e,1 J.-M. Berroir,1 T. Kontos,1 B. Plac¸ais,1 D.C. Glattli,1,2,∗
A. Cavanna,3 B. Etienne,3 Y. Jin3
1
Laboratoire Pierre Aigrain, D´epartement de Physique de l’Ecole Normale Sup´erieure 24 rue Lhomond, 75231 Paris Cedex 05, France
2
Service de Physique de l’Etat Condens´e, CEA Saclay F-91191 Gif-sur-Yvette, France
3
Laboratoire de Photonique et Nanostructures, UPR20 CNRS Route de Nozay, 91460 Marcoussis Cedex, France
∗ To whom correspondence should be addressed; E-mail: [email protected]. We report on the electron analog of the single photon gun. On demand single electron injection in a quantum conductor was obtained using a quantum dot connected to the con-ductor via a tunnel barrier. Electron emission is triggered by application of a potential step which compensates the dot charging energy. Depending on the barrier transparency the quantum emission time ranges from 0.1 to 10 nanoseconds. The single electron source should prove useful for the implementation of quantum bits in ballistic conductors. Addi-tionally periodic sequences of single electron emission and absorption generate a quantized AC-current.
In quantum optics, a single photon source is an essential building block for the manipulation of the smallest amount of information coded by a quantum state: a qubit [1, 2]. Combined with beam-splitters, polarizers and projective measurements several photonic qubits can be manipu-lated to process quantum information [3]. The most celebrated case is the secured transmission of the information using quantum cryptography. Similarly, one expects that electrons
propa-gating ballistically in ultra-pure low dimensional conductors can realize quantum logic tasks in perfect analogy with photons propagating in optical media [4, 5, 6]. The analogy has a long history [7] and has provided illuminating comparisons between the intensity of light and that of electrical current, between photon noise and electrical shot noise [8, 9] and more recently between photon and electron quantum entanglement [10, 11, 12]. Interestingly, electrons being Fermions, entanglement offers new routes not possible with photons [12]. Practically, electronic analogs of beam-splitters, Fabry-P´erot and Mach-Zehnder interferometers [13, 14] have been realized in ballistic conductors providing the necessary quantum gate for an ’all linear’ elec-tron optics quantum computation. Yet missing were the single elecelec-tron source and the single electron detector [15] suitable for coherent emission and projective measurements. The for-mer initializes quantum states, while the latter reads the final states after electrons have passed through the quantum gates.
Unlike the case of photons, realization of single electron sources is expected to be simpler because of Fermi statistics and Coulomb interaction. For example, considering a voltage biased single mode conductor, a contact at energy eV above the energy of the other contact is known
to inject single electrons into the conductor at a regular rate eV /h, thereby leading to
quanti-zation of the dc current in Quantum Point Contacts [16, 17]. A second example is the electron pump where a dc current is produced by sequential time-controlled transfer of single electrons between metallic islands in series [18, 19] or manipulation of tunnel barriers of quantum dots [20, 21]. The cost in Coulomb charging energy to add or remove an electron ensures a well defined electron number in each island or dot. These two sources are however not useful for quantum information. In the first case, there is no time control of the electron injection. As only statistical measurements are possible, the biased contact is suitable for demonstrating coherent phenomena such as interferences or electron entanglement [10, 11] but not for manipulating quantum information. In the second example, time controlled injection can be realized, but the energy of emitted electrons is expected to spread, at random, in an energy range much larger than the tunneling rate (typically a fraction of the charging energy, depending on the pumping conditions). The statistical distribution in energy will smear coherent effects required for
ma-nipulating the quantum information. Finally, a third approach has been theoretically proposed in Refs. [22, 23, 24] considering voltages pulsesV (t) applied to an ohmic contact. When the
Faraday fluxeR V (t′)dt′/h is an integer, an integer number of electrons is injected. Here
noise-less injection requires to have a special Lorenzian shape of the pulse and exact integer value otherwise logarithmic divergenge of the charge fluctuations occurs. No experiment is available yet to test these ideas.
We report on the realization of a time controlled single electron source suitable for coherent manipulation of ballistic electronic qubits which emits the electrons into a well defined quan-tum state. The injection scheme is different from those considered above. The source is made of a quantum dot, realized in a 2D electron gas in GaAs semiconductors, and tunnel-coupled to the conductor through a quantum point contact (QPC). By applying a sudden voltage step on a capacitively coupled gate, the charging energy is compensated and the electron occupying the highest energy level of the dot is emitted. The final state of the electron is a coherent wave-packet propagating away in the conductor. Its energy width is given by the inverse tunneling time, as required for on-demand single particle source, and independent on temperature. Its mean energy can be adjusted above the Fermi energy by tuning the voltage step amplitude. The circuit (Fig.1A), is realized in a 2D electron gas (2DEG) in a GaAsAl/GaAs heterojunction of nominal densityns = 1.7 × 10¹⁵m−2and mobilityµ = 260 V−1m2s−1. The dot is
electrostat-ically coupled to a metallic top gate, 100nm above the 2DEG, whose ac voltage,Vexc, controls
the dot potential at the subnanosecond timescale. For all measurements, the electronic temper-ature is about 200 mK and a magnetic field B ≈ 1.3 T is applied to the sample so as to work
in the quantum Hall regime with no spin degeneracy. The QPC dc gate voltageVG is tuned to
control the transmission D of a single edge state as well as the dc dot potential. As reported
[25], this circuit constitutes the paradigm of a quantum coherent RC circuit where coherence is seen to strongly affect the charge relaxation dynamics. From this study, the charging energy
∆ + e2
/C ≈ ∆ ≈ 2.5 K was extracted [26]. Here the large top gate capacitance makes the
Coulomb energy e2
/C unusually small and the total charging energy identifies to the energy
In Ref.[25], the linear response of the current to the ac top gate voltage was investigated and the ac charge amplitude was much lower than the elementary charge e. Here, in order to
achieve single charge injection we have to apply a high amplitude excitation (Vexc ∼ ∆/e) and
go beyond the linear regime. When an electron is suddenly brought above the Fermi energy of the lead, it is expected to escape the dot at a typical tunnel rate τ−1 = D∆/h, where ∆/h is
the attempt frequency and D the transmission probability. This gives nanosecond timescales
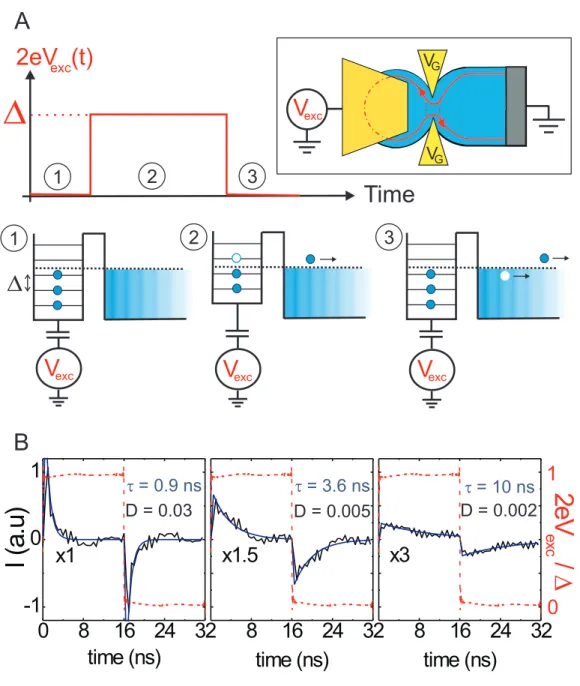
for which single charge detection is still out of reach experimentally. To increase the signal to noise ratio, a statistical average over many individual events is used by generating repetitive sequences of single electron emission followed by single electron absorption (or hole emission) as sketched in Fig.1A. This is realized by applying a periodic square wave voltage amplitude
≈ ∆/e to the top gate. Fig.1B shows typical temporal traces of the current averaged over few
seconds for a repetition period ofT = 32 ns. The single electron events remarkably reconstruct
the exponential current decay of an RC circuit. When decreasing transmissionD from ≈ 0.03
to≈ 0.002, the relaxation time τ , extracted from the exponential decay, increases from 0.9 ns to 10 ns. For the two highest transmissions in Fig.1B, τ ≪ T /2, the current decays to zero and the
mean transferred charge per half period is constant. For the smallest transmission,τ ∼ T /2, the
mean emitted charge decreases as electrons have reduced probability to escape the dot. These time-domain measurements are limited by the1 GHz bandwidth of the acquisition card and give
access to the few nanoseconds injection times corresponding to small transmissionsD . 0.03.
In order to get a better understanding of the above results, we extend the harmonic linear response theory of a quantum RC circuit [27, 28, 29] to calculate the non-linear response to a high amplitude square excitation voltage (eVexc ≫ hf ). Calculation shows that the circuit still
behaves as an RC circuit with a current given by:
I(t) = q τe −t/τ for 0 ≤ τ ≤ T /2 (1) q = e Z dǫN(ǫ)[f (ǫ − 2eVexc) − f (ǫ)] (2) τ = h 2 R dǫN(ǫ)2 [f (ǫ − 2eVexc) − f (ǫ)] R dǫN(ǫ)[f (ǫ − 2eVexc) − f (ǫ)] (3) whereN(ǫ) is the dot density of states and f (ǫ) denotes the Fermi-Dirac distribution. The
non-linear capacitance and charge relaxation resistance can be defined respectively by fCq≡ q/2Vexc
and fRq ≡ τ /fCq. For unit transmissionD = 1, electrons are fully delocalized, N(ǫ) is uniform
and the charge q evolves linearly with Vexc as expected. At the opposite, for low transmission,
N(ǫ) is sharply peaked on well resolved energy levels, and q exhibits a staircase dependence on Vexcwith steep steps whenever one electronic level is brought above the Fermi energy. Thus our
calculations establish the sketch of single electron injection depicted in Fig.1. For a dot energy spectrum with constant level spacing ∆, a remarkable situation occurs when 2eVexc = ∆, as
q = e and fCq = e2/∆ irrespective of the transmission D and of the dc dot potential. As a
matter of fact, Eq.2 shows that, in these conditions,q is given by integrating N(ǫ) over exactly
one level spacing. ForD << 1, we recover the Landauer formula for the resistance, fRq = Deh2
and the escape time is given by τ = h/D∆, as expected from a semiclassical approach. The
exponential current decay, the constant injection charge for τ ≪ T /2, as well as the decrease
ofτ with transmission D, account well for our experimental observations in Fig.1B.
For a more accurate experimental determination ofq and τ and to investigate subnanosecond
time scales, we consider in the following measurements of the current first harmonic, Iω , at
higher frequenciesf = ω/2π = 1/T . As a matter of fact, following Eq.1, we have: Iω =
2qf
1 − iωτ (4)
so that the modulus|Iω| and the phase φ (tan(φ) = ωτ ) allow for the determination of q and τ .
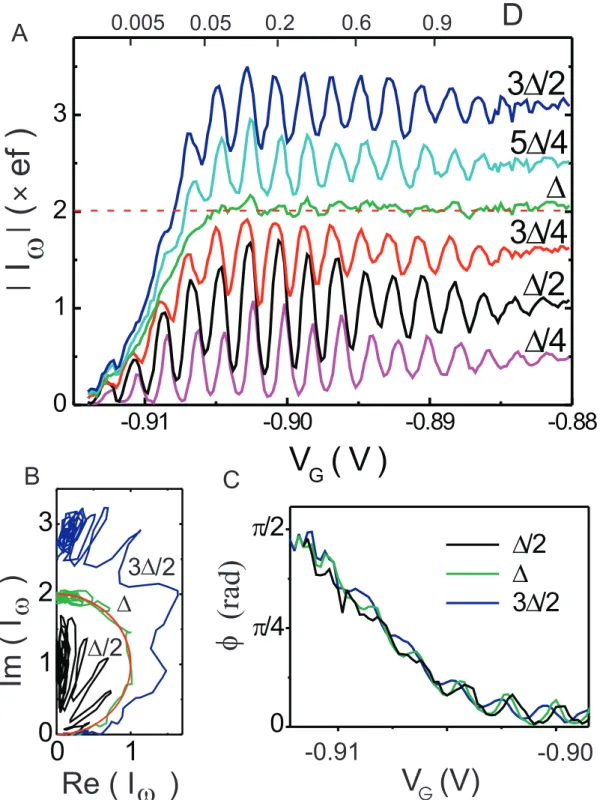
Fig.2A shows |Iω| measured as a function of QPC gate voltage VG at f = 180 MHz for
increasing values of the excitation voltage2eVexc. The range ofVG maps the full transmission
excursion D = 0-1. The low excitation 2eVexc = ∆/4 data nearly correspond to the linear
response reported in Ref.[25]. The current exhibits strong oscillations reflecting the variation withVGof the dot density of states at the Fermi energy. At larger excitation voltages, the current
peaks are broadened as expected from Eq.2 when2eVexcgets larger thankBT . For 2eVexc= ∆,
the oscillations disappear completely and |Iω| = 2ef , down to a low transmission threshold
D ∼ 0.05. The oscillations reappear for larger excitations. The constant current |Iω| = 2ef is
the frequency-domain counterpart of the constant charge regime observed in the time-domain, for the injection/absorption of a single electron per half period. The cut-off observed for D .
0.02 corresponds to the limit ωτ & 1 where the escape time τ exceeds T /2. The constant fCq
regime obtained for2eVexc= ∆ can be viewed on a striking manner in a Nyquist representation
of Fig.2B. The corresponding diagram is the half-circle characteristic of an RC circuit with a constant capacitance e2
/∆ and transmission dependent resistance. By contrast the curves
obtained for larger or smaller excitations exhibit strong capacitance oscillations.
Fig.2C represents the phaseφ = arctan(ωτ ) of the current as a function of VGfor different
excitation voltages. φ shows a quasi monotonic π/2 sweep in increasing transmission. The
absence of significant oscillations proves that τ is nearly insensitive to the dot potential. As
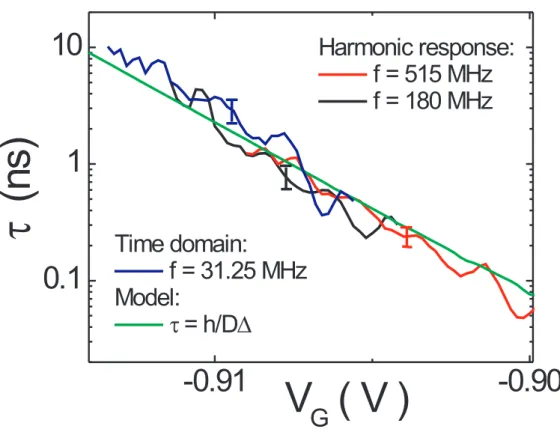
seen in the figure,τ is also independent of Vexc. In Fig.3, we have gathered the values ofτ (VG)
obtained from 1GHz bandwidth time-domain measurements at 31.25 MHz repetition rate and from frequency-domain measurements at 180 and 515 MHz. The whole measurements probe a very broad transmission range (D = 0.002 − 0.2) corresponding to escape times varying from
10 ns to 100 ps. In the overlapping range, the different independent determinations coincide within error bars, agreeing quantitatively with the prediction τ = h/D∆ also represented in
Fig.3, where the dependenceD(VG) is deduced from the linear regime [25].
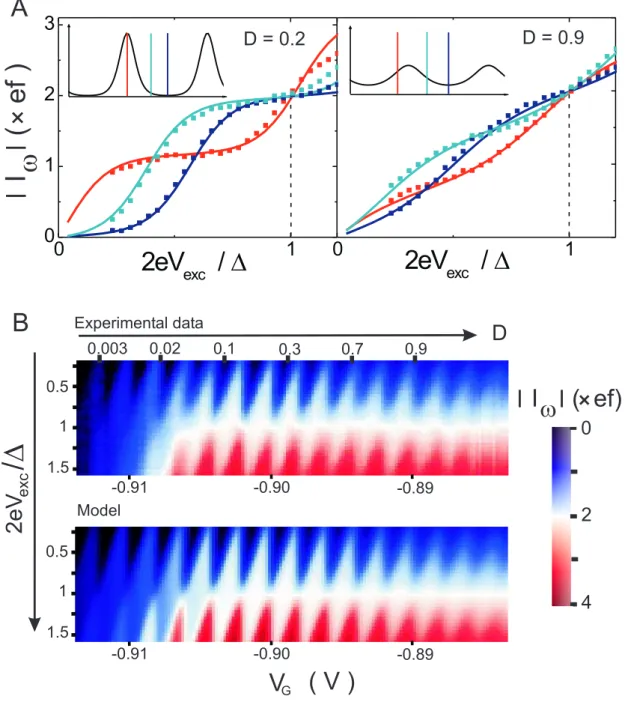
We now discuss the conditions for single electron injection leading to a good quantization of the ac current as a figure of merit of single charge injection. Fig.4A represents|Iω| as function
of Vexcfor typical values of the dc dot potential at fixed transmissionsD ≈ 0.2 and D ≈ 0.9.
Transmission D ≈ 0.2 is low enough for the electronic states to be well resolved, as sketched
in the inset of Fig.4A (left), but still large for the escape time to be shorter than T /2. When
the Fermi energy lies exactly in the middle of a density of states valley, we observe a well pronounced|Iω| = 2ef current plateau centered on 2eVexc = ∆. Whereas the current plateau
resolution is noise limited to better than1% (for a 10 seconds acquisition time), the plateau value
is determined with an uncertainty of5% due to systematic calibration error. We note that at this
working point the plateau is robust upon variation of the parameters. By contrast, if the Fermi energy lies on a peak, there is still a current plateau but its value is arbitrary and very sensitive to parameter variations. These two working points illustrate the importance of having a well defined charge in the dot prior to injection. In the first case the charge is well defined and
suit-able for charge injection. In the second case the equilibrium dot charge fluctuates. In particular, when the energy level is exactly resonant with the Fermi energy, its mean occupation at equilib-rium is1/2 and the measured value of the plateau is 1/2 × 2ef = ef (see Fig.4A (left)). Thus,
this working point is not suitable for a single electron source. Upon increasing transmission, even for a suitable working point, the dot charge quantization can be lost because of quantum fluctuations. First, the width of the ac current plateaus reduces and finally nearly vanishes for
D ≈ 0.9. Note that for different transmissions, all curves cross at |Iω| = 2ef for 2eVexc= ∆
re-flecting the constant value of fCqdiscussed above. Finally, domains of good charge quantization
are best shown on the two-dimensional color plot of Fig.4.B-upper where the modulus of the current is represented in color scale. The vertical axis stands for the excitation voltageVexcand
the horizontal axis for the gate voltage VG. The white diamonds correspond to large domains
of constant current |Iω| = 2ef suitable for single electron injection. At high transmissions the
diamonds are blurred by dot charge fluctuations as discussed previously. On the opposite, for small transmissions, even when the dot charge quantization is good, current quantization is lost because of long escape time ωτ >> 1, and the current goes to zero. At 180MHz, optimal
working conditions are obtained forD ≈ 0.2. Experimental results of Fig.4 are compared with
our theoretical model (Eqs.2 and 3) without any adjustable parameter (solid lines in Fig.4a and lower plot in Fig.4b)[30]. The agreement between measurements and theoretical predictions is excellent which shows that our single electron source lends itself to quantitative modeling.
The availability of a coherent source of single electrons emitted on demand from a single energy level on nanosecond time scale opens the way for a new generation of experiments never possible before. Synchronization of similar sources could be used in the future to probe electron anti-bunching, electron entanglement in multi-lead conductors or to generate electronic flying qubits in ballistic conductors.
The LPA is the CNRS-ENS UMR8551 associated with universities Paris 6 and Paris 7. The research has been supported by SESAME Ile-de-France and ANR-05-NANO-028 contracts.
[1] A. Imamoglu, Y. Yamamoto, Phys. Rev. Lett. 72, 210-213 (1994).
[2] For a review see : N. Gisin, G. Ribordy, W. Tittel and H. Zbinden, Rev. Mod. Phys. 74, 145-195 (2002).
[3] P. Kok et al., Rev. Mod. Phys. 79, 135-174 (2007).
[4] A. Bertoni, P. Bordone, R. Brunetti, C. Jacoboni, and S. Reggiani, Phys. Rev. Lett. 84, 5912-5915 (2000).
[5] R. Ionicioiu, G. Amaratunga, and F. Udrea, Int. J. Mod. Phys. 15, 125-133 (2001). [6] T. M. Stace, C. H. W. Barnes, and G. J. Milburn, Phys. Rev. Lett. 93, 126804-7 (2004).
[7] see for example: W. van Haeringen and D. Lenstra, Analogies in Optics and Micro Electronics, (Kluwer, Dordrecht, 1990).
[8] M. B ¨uttiker, Phys. Rev B 46, 12485-12507 (1992).
[9] Ya. M. Blanter and M. B ¨uttiker, Phys. Rep. 336, 2-166 (2000).
[10] C. W. J. Beenakker, C. Emary, M. Kindermann, J. L. van Velsen, Phys. Rev. Lett. 91, 147901-147904 (2003).
[11] P. Samuelsson, E. V. Sukhorukov, and M. B ¨uttiker, Phys. Rev. Lett. 92, 026805-026808 (2004). [12] C.W.J. Beenakker, in Quantum Computers, Algorithms and Chaos, International School of Physics
Enrico Fermi, (IOS Press, Amsterdam, 2006) vol. 162, edited by G. Casati, D.L. Shepelyansky, P.
Zoller, and G. Benenti, pp. 307-347.
[13] C. W. J. Beenakker and H. van Houten, Solid State Physics 44, 1-228 (1991)
[14] Y. Ji, Y. Chung, D. Sprinzak, M. Heiblum, D. Mahalu and H. Shtrikman, Nature 422, 415-418 (2003)
[15] single electrons detectors have been realized but are yet too slow compare with the electron transit time in the measurement leads.
[16] B. J. van Wees et al., Phys. Rev. Lett. 60, 848-850 (1988). [17] D. A. Wharam et al., J. Phys. C 21, L209-214 (1988). [18] L. J. Geerligs et al., Phys. Rev. Lett. 64, 2691-2694 (1990).
[19] H. Pothier, P. Lafarge, C. Urbina and M.H. Devoret, Europhys. Lett. 17, 249-254 (1992).
[20] L. P. Kouwenhoven, A. T. Johnson, N. C. van der Vaart, and C. J. P. M. Harmans, Phys. Rev. Lett.
67, 1626-1629 (1991).
[21] A. Fujiwara, N.M. Zimmerman, Y. Ono, a,d Y. Takahashi, Appl. Phys. Lett. 84, 1323-1325 (2004). [22] L. S. Levitov, H. Lee, and G. B. Lesovik, J. Math. Phys. 37 4845 (1996)
[23] T. Jonckheere, M. Creux, and T. Martin, Phys. Rev. B 72 205321 (2005) [24] J. Keeling, I. Klich, and L. S. Levitov Phys. Rev. Lett. 97 116403 (2006)
[25] J. Gabelli, G. F`eve, J.-M. Berroir, B. Placais, A. Cavanna, B. Etienne, Y. Jin, and D.C. Glattli,
Science 313, 499-502 (2006).
[26] For additional experimental results see : G. F`eve, Thesis, Universit´e Pierre et Marie Curie (2006), (available at http://tel.archives-ouvertes.fr/tel-00119589).
[27] M. B ¨uttiker, H. Thomas, and A. Prˆetre, Phys. Lett. A180, 364-369 (1993). [28] M. B ¨uttiker, A. Prˆetre, H. Thomas, Phys. Rev. Lett. 70, 4114-4117 (1993). [29] A. Prˆetre, H. Thomas, and M. B ¨uttiker, Phys. Rev. B 54, 8130-8143 (1996).
[30] We use the 1D modeling of our circuit (density of states, transmission, dot-gates coupling) de-scribed in reference [25]
D
V
excD
Time
2eV (t)
exc VG 1 2 3 1 2 3A
B
V
excV
excV
exc8
16 24 32
0
8
16 24 32
-1
0
1
8
16 24 32
2
e
V
e xc/
D
x3
1
0
time (ns)
I
(a
.u
)
time (ns)
x1
x1.5
time (ns)
VG D = 0.03 t = 0.9 ns t = 3.6 ns D = 0.005 D = 0.002 t = 10 nsFIG. 1: Single charge injection. A) Schematic of single charge injection. Starting from an antiresonant situation where the Fermi energy lies between two energy levels of the dot (step 1), the dot potential is increased by∆ bringing one occupied level above the Fermi energy (step 2). One electron then escapes
the dot on the mean time τ = D∆h . The dot potential is then brought back to its initial value (step 3) where one electron can enter it, leaving a hole in the Fermi sea. Inset: The quantum RC circuit : one edge channel is transmitted inside the submicrometer dot with transmissionD tuned by the QPC gate voltage VG. The dot potential is varied by a radiofrequency excitationVexcapplied on a macroscopic gate located on top of the dot. The electrostatic potential can also be tuned by VGdue to the electrostatic coupling between the dot and the QPC. B) Time-domain measurement of the average current (black curves) on one period of the excitation signal (red curves) at2eVexc = ∆ for three values of the transmission D. The relaxation timeτ is deduced from an exponential fit (blue curve).
0
1
0
1
2
3
p/4
p/2
0
D/2
D
3D/2
-0.91
-0.90
-0.89
-0.88
0
1
2
3
5D/4
3D/2
D
3D/4
D/2
D/4
V
G
( V )
A
B
C
f
(ra
d)
0.005
0.05
0.2
0.6
0.9
w
Re ( I
)
w
Im(I)
V (V)
G-0.91
-0.90
D/2
D
D
3 /2
D
wI(ef)
FIG. 2: Iωas a function ofVGatf = 180 MHz for different values of the excitation amplitude 2eVexc. Transmission D is also indicated. A) Modulus |Iω|. The dashed line is the constant value |Iω| = 2ef . B) Nyquist representation (Im(Iω) vs Re(Iω)). The red curve corresponds to an RC circuit of constant capacitancee2
-0.91
-0.90
0.1
1
10
Time domain:
f = 31.25 MHz
Model:
t = h/DD
Harmonic response:
f = 515 MHz
f = 180 MHz
t
(n
s)
V
G
( V )
FIG. 3: Escape time τ in logarithmic scale as a function of QPC gate voltage VG : experiments and model.
0
1
0
1
2
3
2eV
exc/ D
0
2eV
exc/ D
1
D = 0.9
D = 0.2
B
A
Experimental data Model 0.5 1 1.5 -0.91 -0.90 -0.89( V )
V
G 0.003 0.1 0.3 0.7 0.9D
0
2
4
0.5 1 1.5 exc2eV
/D
-0.91 -0.90 -0.89 0.02wI(ef)
w
I
( ef)
FIG. 4: Quantization of the ac current. A)|Iω| as a function of 2eVexc/∆ for different dot potentials at
D ≈ 0.2 (left) and D ≈ 0.9 (right). Points correspond to experimental values and lines to theoretical
predictions. Insets: schematic representation of the dot density of statesN (ǫ). The color bars indicate
the dot potential for the corresponding experimental data. B) Color plot of|Iω| as a function of 2eVexc/∆ andVG: experiments (upper) and model (lower).