HAL Id: hal-00981353
https://hal.archives-ouvertes.fr/hal-00981353
Submitted on 22 May 2014
HAL is a multi-disciplinary open access
archive for the deposit and dissemination of
sci-entific research documents, whether they are
pub-lished or not. The documents may come from
teaching and research institutions in France or
abroad, or from public or private research centers.
L’archive ouverte pluridisciplinaire HAL, est
destinée au dépôt et à la diffusion de documents
scientifiques de niveau recherche, publiés ou non,
émanant des établissements d’enseignement et de
recherche français ou étrangers, des laboratoires
publics ou privés.
A Matter of Time - Intrinsic or Extrinsic - for Diffusion
in Evolving Complex Networks
Alice Albano, Jean-Loup Guillaume, Sébastien Heymann, Bénédicte Le Grand
To cite this version:
Alice Albano, Jean-Loup Guillaume, Sébastien Heymann, Bénédicte Le Grand.
A Matter of
Time - Intrinsic or Extrinsic - for Diffusion in Evolving Complex Networks. Conference on
Ad-vances in Social Networks Analysis and Mining, Aug 2013, Niagara Falls, Canada.
pp.202-206,
�10.1145/2492517.2492634�. �hal-00981353�
A Matter of Time - Intrinsic or Extrinsic - for
Diffusion in Evolving Complex Networks
Alice Albano
∗, Jean-Loup Guillaume
∗, S´ebastien Heymann
∗and B´en´edicte Le Grand
†∗Universit´e Pierre et Marie Curie, LIP6-CNRS
Email: firstname.lastname@lip6.fr
†Universit´e Paris 1 Panth´eon-Sorbonne, CRI
Email: benedicte.le-grand@univ-paris1.fr
Abstract—Diffusion phenomena occur in many kinds of real-world complex networks, e.g., biological, information or social networks. Because of this diversity, several types of diffusion models have been proposed in the literature: epidemiological models, threshold models, innovation adoption models, among others. Many studies aim at investigating diffusion as an evolving phenomenon but mostly occurring on static networks, and much remains to be done to understand diffusion on evolving networks. In order to study the impact of graph dynamics on diffusion, we propose in this paper an innovative approach based on a notion of intrinsic time, where the time unit corresponds to the appearance of a new link in the graph. This original notion of time allows us to isolate somehow the diffusion phenomenon from the evolution of the network. The objective is to compare the diffusion features observed with this intrinsic time concept from those obtained with traditional (extrinsic) time, based on seconds. The comparison of these time concepts is easily understandable yet completely new in the study of diffusion phenomena. We experiment our approach on synthetic graphs, as well as on a dataset extracted from the Github sofware sharing platform.
I. INTRODUCTION ANDCONTEXT
Diffusion phenomena occur in many kinds of real-world complex networks, such as biological, information or social networks. These various contexts lead to different types of dif-fusion, like disease spreading, information broadcast or adop-tion of innovative products. Several classes of diffusion models have therefore been proposed in the literature, among which epidemiological models such as Susceptible-Infected (SI), Removed (SIR) or Susceptible-Infected-Susceptible (SIS) [1], and adoption models [2].
Many studies aim at investigating diffusion as an evolving phenomenon but mostly occurring on static networks [3], although most real-world networks evolve over time with the creation of new nodes or links, or their disappearance. It is already known that this dynamic behaviour has an impact on the diffusion process [4] and that this impact should not be neglected [5]. Networks dynamics may eventually become an asset as it may be used to slow down diffusion speed with regard to static networks [6], e.g., to limit the propagation of an epidemy [7].
One way to study diffusion in evolving networks is em-pirical, consisting in studying real networks, in observing them and finally in proposing a diffusion model consistent with the observations. The authors of [8] have applied this methodology to analyze the spreading of H1N1 virus -modeled with a SEIR model- in a dynamic contact network. Other
works have studied diffusion processes in a phone network [9]. However, this approach is global, as it does not distinguish the observations which are entirely related to the type of diffusion, from the ones which are mostly due to the evolution of the graph structure.
The goal of our work is to understand, while observing a diffusion process, which part is intrinsically related to the type of diffusion -and therefore which part is merely due to the evolution of the network. It is not possible to completely sep-arate diffusion from graph dynamics, as both phenomena are strongly related; the goal is rather to attempt to normalize our observations, e.g., to see whether a very significant diffusion at a given moment is due to a sudden growth of the graph. In this paper, we propose a simple yet innovative approach to study the impact of graph dynamics on diffusion. This methodology does not require any new computation once the diffusion process has been measured; instead of observing the diffusion phenomenon as a function of usual time -e.g., measured in seconds- which we call here extrinsic time, we propose to observe it as a function of what we call intrinsic time [10]. Indeed, this time is intrinsically related to graph dynamics as an intrinsic time slot is not absolute: it corresponds to the appearance of new links in the network, as explained in the following of the paper.
This article is organized as follows. In Section II, we propose our approach for studying diffusion in evolving net-works, which relies on the intrinsic time concept. In Section III we describe the graphs on which we have applied our methodology, starting with synthetic Barab´asi-Albert (BA) graphs [11], as these graphs have often been used in works on diffusion [12] [13]. We then introduce the real-world evolving network we have used, extracted from the Github software sharing network [14]. Section IV and Section V are dedicated to the experiments we have conducted, describing respectively the results obtained with BA graphs and with the Github network. We finally conclude this paper and propose perspectives for future work in Section VI.
II. METHODOLOGY A. Intrinsic versus Extrinsic Time
Time is a controversial concept that one can see as a dimension in which changes occur in sequence. In this per-spective, time is considered as absolute, i.e., changes happen independently from the flow of time [15], [16]. But if we consider time as a relative concept, time then depends on
space. Many techniques exist to measure it. The unit adopted by the International System of Units is the second, which is defined as the transition between two states of the caesium-133 atom [17]. This unit is therefore related to movements measured in the physical space.
In this paper we use a concept of relative time from a network perspective, called intrinsic time of the network, as opposed to extrinsic time, which is a concept of absolute time. Let the extrinsic time of the network be the time measured using the second (or its derivative units like days and years). We call it extrinsic because its flow is independent from the changes that occur in the network. Let the intrinsic time of the network be the time measured by the transition between two states of the network. The unit is thus the (spatial) change of the network, i.e., the addition or removal of one node or one link. We call it intrinsic because time depends on the changes that occur in the network, and changes depend on such time to happen.
Whereas the extrinsic time is broadly used without notice, we have found out in [10] that these two different concepts of time have a high impact on the measurement of statistical properties of temporal networks. Our previous results seem to suggest that intrinsic time is better at characterizing the endogenous dynamics of the network, because extrinsic time is more likely to capture exogenous patterns like day-night activity of users in information networks.
B. Diffusion Model
In this work, we have chosen to study the impact of graph dynamics on a very well-known diffusion model: the Susceptible-Infected (SI) model. This model has been proposed by [1] in 1927, and it has been widely used since then. In an SI model, each node of the graph may be either in susceptible (sane) or infected state. A susceptible node with an infected neighbor has the probability p of becoming infected too.
This model is particularly interesting in this case as it has very few parameters, namely the contamination probability p and the choice of infected nodes at the beginning, i.e., from which the spreading starts. In the following, the values of both parameters are fixed in order to focus on the correlation between graph dynamics and diffusion process. As this model has only two parameters, it will be easier later to distinguish observations directly related to the model from those related to the graph topology or the time notion used.
III. STUDIEDNETWORKS
In this Section, we describe the graphs to which we have applied our methodology. We have tested it first with synthetic growing graphs, built with Barab´asi-Albert (BA) model [11], then with a real-world evolving network extracted from the Github software sharing platform. On these two graphs, we have computed the total -cumulated- number of infected nodes as a function of time.
A. Barab´asi-Albert Graphs
In the first place, we have investigated the concept of
intrinsic versus extrinsic time scales on a random graph with a known topology. We have chosen the BA model because
Fig. 1. Number of nodes an links in the Github graph, restricted to the largest connected component.
nodes are added one by one to the network. Each new node is connected to a fixed number of existing nodes of the graph according to the preferential attachment principle: the higher the degree of node x in the graph, the more likely the new node connects to x. The BA model is characterized by four parameters: the initial and final numbers of nodes in the network, the time step between the creation of new nodes and finally the preferential attachment parameter, noted m, which corresponds to the number of edges generated by the creation of new node.
B. Github Network
1) Dataset Description: Github.com is an online platform created in 2008 to help developers share open source code and collaborate. The Github dataset we use here describes the complete activity between users and repositories on the platform from March 11, 2012 to July 18, 2012. We have extracted the data from the Github Archive [14], which is a record of every public activity on Github. Then we built the graph of ”who contributes to which repository”, where nodes represent users and repositories, and where links represent any kind of activity users have on repositories. Our dataset contains a bit more than 336 000 nodes and 2.2 million links. In order to study a diffusion model on this dataset, we consider only the largest connected component of the graph, which has a little more than 60,000 nodes.
2) A Few Statistics: Figure 1 shows the total number of nodes and links in the network as a function of (usual) time. We see on this figure that the total numbers of nodes and links grow rather slowly, then suddenly increase significantly. This change happens on July, 4th 2012 and it is correlated to a sudden increase in the maximum degree of the sub-graph. We discover that the Try-Git project interacts with 506 users, which explains this high degree. This project is a tutorial for Git, one of Github’s underlying tools; the first action required from the user in this tutorial is to create a clone with a new project (by sending this user a CreateEvent message). The instant of the event corresponds to the moment when
Try-Git was made public, on July 4th, 2012 at 5 pm (this information was confirmed by a post on the Github.com blog1).
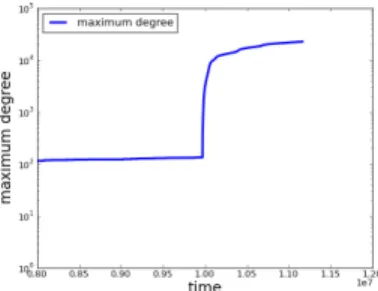
This event radically modifies the structure of the network. This is confirmed by the maximal node degree in the graph, illustrated in Figure 2, whose order of magnitude changes significantly after the appearance of a node with a very high degree, corresponding to the event described above.
Fig. 2. Evolution of the maximal node degree in the Github graph, with y-axis in a logarithmic scale.
IV. DIFFUSION ONBA GRAPHS
The BA graphs considered in this Section contain 500 nodes initially, and we generate 500 additional nodes using the BA model, leading to a graph with 1000 nodes. In order to investigate the concepts of intrinsic and extrinsic time scales and their correlation with the diffusion process, we have sim-ulated 3 different types of dynamics. The difference between these dynamics is the inter-arrival delays which are generated using three distinct probability laws. We use different laws for the generation of links because there is no extrinsic notion of time in the BA model, only the creation of links (which is for us an intrinsic notion of time). More precisely, the three laws we have used are: (i) a discrete uniform distribution where each inter-arrival delay in the interval is equally likely to happen, (ii) a negative exponential distribution, i.e., the probability of observing long delays decreases exponentially fast and (iii) a power law distribution where the probability of observing long delays decreases polynomially. We choose the parameters of these laws so that the average inter-arrival delay is equal for the three laws. Finally, whatever the time unit considered, we perform one step of the SI diffusion per time unit.
For each type of BA dynamics, we compare the different time scales using three representations of the total number of infected nodes over time:
• intrinsic time, i.e., we represent the speed of infection versus the number of created links. Since the intrinsic time does not take inter-arrival delays into account, the diffusion should behave similarly regardless of the delays, i.e., regardless of graph dynamics.
• extrinsic time which is the classical notion of time. • converted extrinsic time: we convert the extrinsic
time into intrinsic time to observe the diffusion. For instance, if the second link is created at extrinsic time 15, its intrinsic time is 2. The number of infected nodes at extrinsic time 15 will therefore correspond to the same number of infected nodes at intrinsic time 2. The diffusion observed with extrinsic and extrinsic converted is the same.
We have simulated a diffusion with a SI model for these three types of dynamics. We fixed the probability of being infected p = 0.005.
A. Simulations in Intrinsic Time
The goal here is to show that SI simulated as a function of intrinsic time is somehow immune to dynamics. Figure 3 shows the results of these simulations.
Fig. 3. SI diffusion on a BA graph, from 500 to 1000 nodes. The time between the creation of 2 new nodes follows 3 distinct probability laws: uniform, exponential and power-law. All SI simulations on this Figure are made with the intrinsic time scale of the graph.
We observe on this Figure that the three plots have identical behaviours. Indeed, the notion of intrinsic time only considers the modification of the topology and not the delays between these modifications, therefore the different inter-arrival laws have no impact when observed with intrinsic time and we perform one SI diffusion step per link creation.
B. Simulation in Extrinsic Time
We perform the same experiments as before but in extrinsic time and the results are presented in Figure 4. This Figure exhibits very different behaviors and the variation of inter-arrival delays drastically modifies the diffusion behavior. This result is natural, indeed it is very likely that the random inter-arrival time generated at a given moment is higher than 1. In extrinsic time if we generate, for instance, a delay of 10 between the arrival of two consecutive nodes, then we will perform ten SI diffusion steps instead of one in intrinsic time.
C. Diffusion Represented with Extrinsic Converted Time
So as to compare extrinsic and intrinsic time notions, and to understand better the diffusion behavior in extrinsic time, we convert the previous results obtained with extrinsic time, into intrinsic time. We therefore perform a non uniform scaling of Figure 4 to obtain Figure 5.
The infection spreads quickly at the beginning up to a moment when there is a strong inflexion in the speed of diffusion (except for the power law distribution). Then all curves follow a linear behaviour. This observation is strongly related to the network dynamics and the SI model. Indeed, at the beginning many nodes are susceptible of being infected, which explains the fastly growing phase. This phase can also be observed in extrinsic time in Figure 4. After this phase, most nodes are infected and the infection therefore spreads at the speed of the creation of new nodes which is exactly one per time unit in intrinsic time.
This example shows the very important impact of graph dynamics on the spreading behavior.
Fig. 4. SI diffusion on a BA graph, from 500 to 1000 nodes. The time between the creation of 2 new nodes follows 3 distinct probability laws: uniform, exponential and power-law. All SI simulations on this Figure are made with the extrinsic time scale of the graph.
Fig. 5. SI diffusion on a BA graph, from 500 to 1000 nodes. The time between the creation of 2 new nodes follows 3 distinct probability laws: uniform, exponential and power-law. All SI simulations on this Figure are made with the extrinsic time scale of the graph converted into intrinsic time.
Fig. 6. SI diffusion on the Github graph in intrinsic time, in linear scale (top) and in y-logarithmic scale (bottom)
In the following, we perform the same experiments on the Github dataset. Extrinsic time is the second and intrinsic time corresponds to the creation of a new link in the network.
Fig. 7. In blue: SI diffusion on the Github graph in extrinsic time. The time between two trials of diffusion is 30 seconds. In green: number of nodes in the graph at each time step.
V. DIFFUSION ONGITHUB A. Simulation in Intrinsic Time
The diffusion using the intrinsic time on the Github dataset is presented in Figure 6. We do not see a radical change in the diffusion at the time of the creation of the tutorial Try-Git (which corresponds to time 50,000 in intrinsic time). Indeed, the curve looks like a standard diffusion with the SI model: we see an exponential growth, with a slow start, then a growing number of nodes that accelerates quickly.
We do not observe the saturation phenomenon at the end of the simulation, because the number of infected nodes in the network is relatively far from the total number of nodes. These results are confirmed by the representation of the same curve on a logarithmic scale, which shows a linear aspect.
Finally, this confirms that diffusion using intrinsic time is rather immune to changes of topology in the network.
B. Simulation in Extrinsic Time
We start the study of the diffusion using the extrinsic time, i.e., the second. For the simulation we make an infection test every 30 seconds. On average, there is a new link every 91 seconds in the Github network, therefore, there are fewer diffu-sion steps in intrinsic time than in extrinsic time. However, we do not compare the actual speed of diffusion on a quantitative basis.
The results are presented in Figure 7. For interpretation purposes, we have added the number of nodes at each time step. We observe that the diffusion process has a slow start and a fast growing phase, as expected with an exponential infection. We can easily observe the impact of the creation of the tutorial Try-Git on July 4th, 2012: the number of nodes in the network increases fastly and similarly the diffusion itself undergoes an acceleration. The acceleration comes from the presence of the new high degree node which facilitates the diffusion.
C. Simulation in Extrinsic to Intrinsic Converted Time
Finally, we perform the conversion of time from extrinsic to intrinsic as in section IV. The results of this conversion are presented in Figure 8.
We observe a very different behaviour from the extrinsic time representation from Figure 7. At intrinsic time 50, 000, which corresponds to the event of July 4th, 2012, the growth
Fig. 8. SI diffusion on the Github graph in extrinsic time converted back to intrinsic time.
of the number of infected nodes slows down drastically. This can be explained as follows: after the event, the creation of links becomes much faster, i.e., there are much more links per seconds than before the event. Intrinsic time does not take this into account since it does not consider the speed of link creation. Conversely, in extrinsic time the difference is noticeable, as observed on Figure 7.
When the extrinsic time is converted to intrinsic time, we naturally observe a plateau in the diffusion correlated with the acceleration in intrinsic time. Indeed, in intrinsic time we perform one infection test per link creation, while in extrinsic time there are more than one link created per diffusion time step.
Another way to understand this phenomenon is to consider the number of links creation over time. Figure 1 shows this number on which we can observe a fast increase at time 1x10⁷
and smaller accelerations at times 1.04x10⁷ and 1.07x10⁷. Each increase in the number of links corresponds to a plateau in the number of infected nodes, at intrinsic times 50000, 65000 and 71000 respectively. The increase slope is correlated with the length of the plateau.
VI. CONCLUSION AND FUTURE WORK
In this article, we have used the concepts of intrinsic and extrinsic times to study diffusion phenomena in evolving networks. We have first observed the impact of these two concepts of time on diffusion in growing synthetic graphs. This study has shown that intrinsic time allows us to somehow isolate the network dynamics from the diffusion phenomenon. Subsequently, we have observed these concepts on a real dataset from the Github platform. Our results on this dataset have shown significant differences in the diffusion in the extrinsic, extrinsic converted into intrinsic and intrinsic cases. Indeed, in intrinsic time, the diffusion is not really impacted by the evolution of the network topology. In extrinsic time on the contrary, this network topology plays a major role. We have shown that it is very interesting to study the same diffusion with extrinsic time and extrinsic time converted into intrinsic time, as converted time provides additional information for th interpretation of diffusion in extrinsic time. In our future work, we will first focus on the generalization of intrinsic time notion. Indeed, for the moment, this concept is only defined for networks which grow over time. We will therefore study how can we extend this notion for other types of dynamics. Thereafter, we will use these extended definitions to study diffusion on other datasets, with different topologies and different dynamics, where links and nodes can
appear and disappear. Once this generalization is done, we will test it on synthetic graphs where links can appear and disappear. We will also study other types of diffusion models: at first, other epidemiological models like SIS or SIR, and other classes of diffusion models like threshold models.
ACKNOWLEDGMENT
This work is supported in part by the French National Research Agency contract DynGraph ANR-10-JCJC-0202 and by the DiRe project, funded by the city of Paris ´Emergence
program.
REFERENCES
[1] M. Kermark and A. Mckendrick, “Contributions to the mathematical theory of epidemics. part i,” in Proc. R. Soc. A, vol. 115, no. 5, 1927, pp. 700–721.
[2] R. Jensen, “Adoption and diffusion of an innovation of uncertain profitability.” Journal of economic theory, vol. 27, no. 1, pp. 182–193, 1982.
[3] M. Barthelemy, A. Barrat, R. Pastor-Satorras, and A. Vespignani, “Dynamical patterns of epidemic outbreaks in complex heterogeneous networks,” Journal of theoretical biology, vol. 235, no. 2, pp. 275–288, 2005.
[4] A. Albano, J.-L. Guillaume, and B. Le Grand, “File diffusion in a dynamic peer-to-peer network,” in Mining Social Network Dynamics,
in conjunction with the World Wide Web conference. ACM, 2012, pp. 1169–1172.
[5] N. Fefferman and K. Ng, “How disease models in static networks can fail to approximate disease in dynamic networks,” Physical Review E, vol. 76, no. 3, p. 031919, 2007.
[6] S.-Y. Liu, A. Baronchelli, and N. Perra, “Contagion dynamics in time-varying metapopulation networks,” Physical Review E, vol. 87, no. 3, p. 032805, 2013.
[7] S. Lee, L. E. Rocha, F. Liljeros, and P. Holme, “Exploiting temporal network structures of human interaction to effectively immunize popu-lations,” PLoS One, vol. 7, no. 5, p. e36439, 2012.
[8] K. T. Eames, N. L. Tilston, E. Brooks-Pollock, and W. J. Edmunds, “Measured dynamic social contact patterns explain the spread of h1n1v influenza,” PLoS Computational Biology, vol. 8, no. 3, p. e1002425, 2012.
[9] G. Miritello, E. Moro, and R. Lara, “Dynamical strength of social ties in information spreading,” Physical Review E, vol. 83, no. 4, p. 045102, 2011.
[10] S. Heymann and B. L. Grand, “Monitoring user-system interactions through graph-based intrinsic dynamics analysis,” in Proceedings of
the 7th IEEE International Conference on Research Challenges in Information Science, 2013.
[11] A.-L. Barab´asi and R. Albert, “Emergence of scaling in random networks,” science, vol. 286, no. 5439, pp. 509–512, 1999.
[12] Z. Dezs˝o and A.-L. Barab´asi, “Halting viruses in scale-free networks,”
Physical Review E, vol. 65, no. 5, p. 055103, 2002.
[13] R. Pastor-Satorras and A. Vespignani, “Epidemic spreading in scale-free networks,” Physical review letters, vol. 86, no. 14, pp. 3200–3203, 2001.
[14] Github archive. [Online]. Available: http://www.githubarchive.org [15] I. Newton, PhilosophiæNaturalis Principia Mathematica, 1687. [16] I. Kant, Kritik der reinen Vernunft, 1781.
[17] O. I. de la Convention du M`etre, “The international system of units (SI),” Bureau International des Poids et Mesures, Tech. Rep. 8, 2006.