HAL Id: hal-01510363
https://hal.sorbonne-universite.fr/hal-01510363
Submitted on 19 Apr 2017HAL is a multi-disciplinary open access archive for the deposit and dissemination of sci-entific research documents, whether they are pub-lished or not. The documents may come from teaching and research institutions in France or abroad, or from public or private research centers.
L’archive ouverte pluridisciplinaire HAL, est destinée au dépôt et à la diffusion de documents scientifiques de niveau recherche, publiés ou non, émanant des établissements d’enseignement et de recherche français ou étrangers, des laboratoires publics ou privés.
Confinement Effects on an Electron Transfer Reaction in
Nanoporous Carbon Electrodes
Zhujie Li, Guillaume Jeanmairet, Trinidad Méndez-Morales, Mario Burbano,
Matthieu Haefele, Mathieu Salanne
To cite this version:
Zhujie Li, Guillaume Jeanmairet, Trinidad Méndez-Morales, Mario Burbano, Matthieu Haefele, et al.. Confinement Effects on an Electron Transfer Reaction in Nanoporous Carbon Electrodes. Journal of Physical Chemistry Letters, American Chemical Society, 2017, 8, pp.1925 - 1931. �10.1021/acs.jpclett.7b00458�. �hal-01510363�
Confinement Effects on an Electron Transfer
Reaction in Nanoporous Carbon Electrodes
Zhujie Li,
†,‡,¶Guillaume Jeanmairet,
‡,¶Trinidad Méndez-Morales,
†,¶Mario
Burbano,
†,¶Matthieu Haefele,
†and Mathieu Salanne
∗,†,‡,¶Maison de la Simulation, CEA, CNRS, Univ. Paris-Sud, UVSQ, Université Paris-Saclay, F-91191 Gif-sur-Yvette, France, Sorbonne Universités, UPMC Univ Paris 06, CNRS, Laboratoire PHENIX, F-75005 Paris, France, and Réseau sur le Stockage Électrochimique de l’Énergie
(RS2E), FR CNRS 3459, France
E-mail: [email protected]
∗To whom correspondence should be addressed
†Maison de la Simulation, CEA, CNRS, Univ. Paris-Sud, UVSQ, Université Paris-Saclay, F-91191 Gif-sur-Yvette,
France
‡Sorbonne Universités, UPMC Univ Paris 06, CNRS, Laboratoire PHENIX, F-75005 Paris, France ¶Réseau sur le Stockage Électrochimique de l’Énergie (RS2E), FR CNRS 3459, France
Abstract
Nanoconfinement generally leads to drastic effect on the physical and chemical properties of ionic liquids. Here we investigate how the electrochemical reactivity in such media may be impacted inside nanoporous carbon electrodes. To this end, we study a simple electron transfer reaction using molecular dynamics simulations. The electrodes are held at constant electric potential by allowing the atomic charges on the carbon atoms to fluctuate. We show that the Fe3+/Fe2+ couple dissolved in an ionic liquid exhibits a deviation with respect to Marcus theory. This behavior is rationalized by the stabilization of a solvation state of the Fe3+cation in the disordered nanoporous electrode that is not observed in the bulk. The simulation results are fitted with a recently proposed two solvation state model, which allows us to estimate the effect of such a deviation on the kinetics of electron transfer inside nanoporous electrodes.
TOC graphic:
Nanoconfinement effects strongly impact on many liquid properties, such as transport, diffu-sion coefficients, phase transitions, and solvation structures.1–4They are particularly important for supercapacitors, which have emerged as a complimentary energy storage solution to batteries.5 This is due to the fact that supercapacitors display faster charging times, and consequently higher power deliveries than batteries, while attaining longer life cycles. However, the energy density of batteries is higher. In supercapacitors energy storage is realized through the adsorption of ions at the surface of two oppositely polarized electrodes, forming a so-called electrical double layer.6
Nanoconfinement has been observed to have a significant influence on the performance of super-capacitors, as has been demonstrated by experiments7,8 and simulations,9–12 where it was shown that the use of materials with sub nanometric pores as electrodes greatly increase the capacitance of these devices.
Within the realm of electrochemical applications, room temperature ionic liquids (RTILs) have attracted a considerable attention.13,14 In principle, the properties of RTILs are tunable due to the wide variety of cations and anions from which they can be prepared. Because RTILs are solely made of charged species, it would have been expected that using them to replace standard electrolytes would increase the performance of supercapacitors. Yet, the interfacial capacitance of RTILs and acetonitrile-based electrolyte supercapacitors remain somewhat similar. This rather disappointing observation has been attributed to the more important correlations between ions in RTILs, which is due to the absence of electrostatic screening by the solvent.15
An alternative could be to take advantage of the tunability of RTILs to develop new storage concepts. Recently, Mourad et al. reported a large enhancement of the energy stored due to si-multaneous capacitive and Faradic processes when biredox RTILs are used as electrolytes in a supercapacitor.16 Among the various questions raised by this study, the most important ones are: How is the electron transfer rate affected by confinement? Does the charging of such a superca-pacitor remain dominated by the ionic diffusion?
From the theoretical point of view, electron transfer reactions in solution are usually studied in the framework of Marcus theory, which aims at accounting for the influence of solvent fluctuations on the rate of electron transfer.17 Marcus theory has been widely used to interpret experiments and simulations with an undeniable success. However, some systems exhibiting a deviation from Marcus linear behavior have been reported.18,19 Several extensions to the theory were proposed to account for them.20,21 A reason why Marcus theory might fail arises from the fact that one of its key assumptions is that the fluctuations of the solvent around the reactant and the product are similar. Yet, if the solvation states of the two species are structurally different, this hypothesis can be wrong as evidenced by the use of density functional theory-based Molecular Dynamics
simulations of aqueous copper and silver ions.19,21In experiments as well, introducing asymmetry in Marcus theory22 was necessary to fit the voltammetric data of various RTILs.23 Finally, in the case of interfacial systems several studies have underlined the importance of field penetration into the metal and of solvent spatial correlations.24,25
Confinement might have a drastic influence on the solvation shell of the adsorbed species.26,27 Thus, it is worth investigating this effect on the electron transfer rate.28We report here a molecular dynamics study of the Fe3+/Fe2+ electron transfer reaction which has already been proposed in previous redox supercapacitor concepts.29,30 The experimental studies involve complex species, so that we focus on a simplified system in order to gain a first insight on electron transfer reactions in carbon nanopores. In particular, our study corresponds to infinite dilution since it is known that inorganic salts have low solubilities in imidazolium-based RTILs.31The studied ionic liquid is the 1-ethyl-3-methylimidazolium tetrafluoroborate (EMIM-BF4), which is put in contact with model
carbide-derived carbon (CDC) nanoporous electrodes. We show that the free energy profiles for the electron transfer reaction strongly deviate from Marcus theory due to the presence of two solvation states for the Fe3+species.
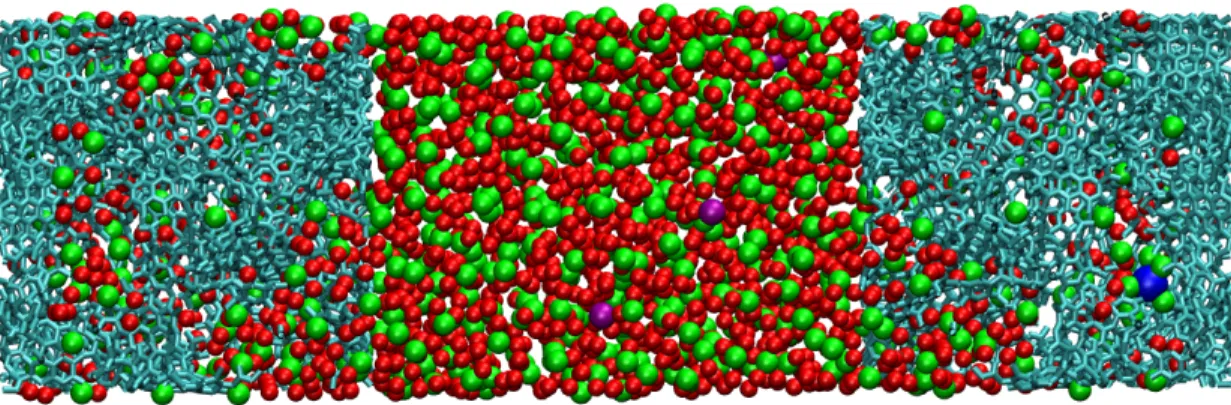
Figure 1: The simulation cell is constituted of two porous electrodes held at constant potential (cyan C atoms). The electrolyte is composed of a FeCl3 or FeCl2 unit dissolved in EMIM-BF4,
modeled using a coarse-grained force-field32 (red: the three interaction sites of EMIM+, green: the single site of BF−4, blue: Fe (III) cation and violet: Cl− anions).
We build on previous work by using a simulation cell similar to the one we used to investigate the origin of increased capacitance in nanoporous carbon-based supercapacitors.10 We employ a coarse-grained model of the EMIM-BF4with, respectively, 3 and 1 interaction sites for the cation
and the anion,33 to which we add one iron ion and the appropriate number of chloride counter ions. We keep the electric potential inside the electrodes constant and equal to 0 V by using the procedure developed by Sprik et al.34, which allows the charge on the electrode to adjust in response to the local electric potential due to the electrolyte ions. Each electrode is represented by a model of CDC containing 3821 carbon atoms.35 To address the effect of the local environment experienced by the redox species we ran several simulations in which the initial position of the iron ion is set in different pores of the disordered carbon material. In order to study the following redox half-reaction:
Fe2+→ Fe3++ e−
we performed simulations of the reduced species Fe2+ and of the oxidized one Fe3+. It has been shown by Warshel36,37 that a relevant reaction coordinate to study electron transfer reaction is the vertical energy gap ∆E, which is defined as
∆E({RN}) = E1({RN}) − E0({RN}), (1)
where E1and E0 are the instantaneous potential energies of a system with either the reduced
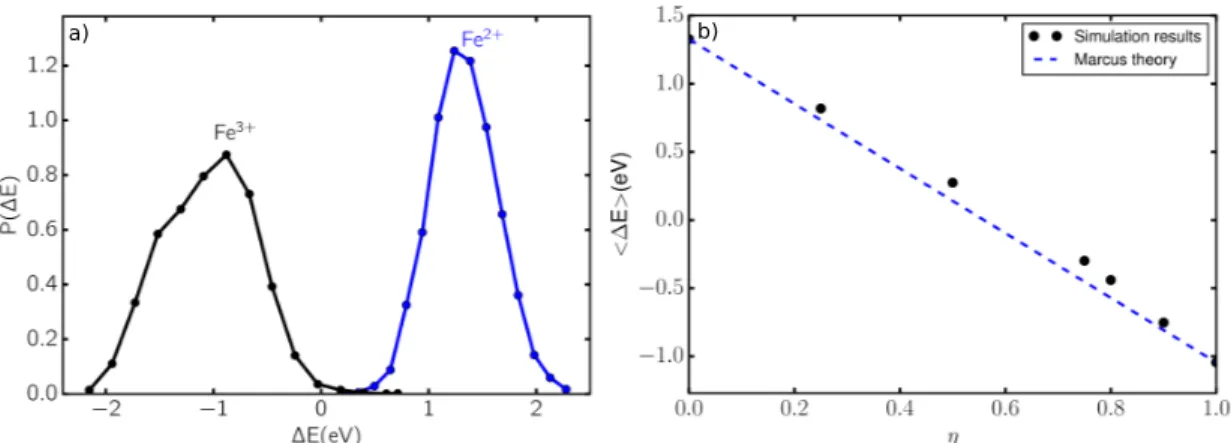
or the oxidized state of the redox-active species for a given microscopic configuration {RN}. We recall here that in the linear response assumption in Marcus theory,17,38 the distribution of the order parameter is Gaussian39 and, in particular, the shape of the distribution of ∆E obtained by performing simulations with the Hamiltonian of the reactant or the product should be identical. As shown in Figure 2a, this is clearly not the case, the distribution for the Fe2+being almost Gaussian, while the one for the Fe3+ is not. This is a first indicator that this system does not follow Marcus theory picture.
In order to increase the statistical accuracy, we use the free-energy perturbation method. This variant of umbrella sampling introduces a coupling parameter (η) between the reduced and oxi-dized states.40The simulations are then performed with an intermediate Hamiltonian associated to the potential energy surface Eη defined as the linear superposition:
a) b)
Figure 2: a) Probability distribution of the vertical energy gap in reduced and oxidized states, b) Average vertical energy gap for Fe3+/Fe2+in RTILs with various coupling parameters η.
Eη = (1 − η)E0+ ηE1 (2)
A direct consequence of the linear assumption of Marcus theory is that Eη should vary linearly
with η.40 To test this, we carried out simulations with different values of the coupling parameter η = 0, 0.25, 0.5, 0.75, 0.8, 0.9 and 1.0. It is clear for Figure 2b that the Marcus picture is violated, since the corresponding vertical energy gaps do not follow the expected linear variation.
As pointed out in the introduction, discrepancy with Marcus theory often originates from strong changes in the solvation shell between the reduced and oxidized states. To investigate if that is in-deed the case here, we examine the coordination number of the iron cation along the simulations. The radius of the first solvation shell is taken equal to the first minimum of the Fe-BF−4 radial distribution function in the absence of electrodes (3.8 Å). We observe that the coordination num-ber (CN) of the Fe3+ cation fluctuates between values of 4 and 6 during the simulation. This is clearly an effect of the confinement since the cation remains close to the carbon electrode, and the corresponding CN is 4 in the pure RTIL. In contrast, the Fe2+cation has a CN that remains equal to 4 during the whole simulations, as shown in Supplementary Figure S1.
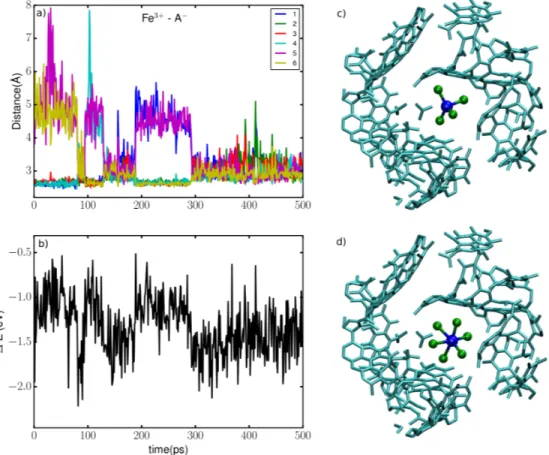
The distances between Fe3+ and the six nearest anions along a representative trajectory are displayed in Figure 3a; the other simulations display similar variations. The alternation between two coordination environments is confirmed by the fact that during some parts of the simulations
Figure 3: a) Distance between Fe3+ and the six closest anions, b) Vertical energy gaps of the oxidized state Fe3+, c) and d) Snapshots of the two different solvation structures.
we detected that 4 anions are closely coordinated to the Fe3+ with a Fe-BF4 distance of 2.8 Å,
the two remaining anions being located further away from the iron with a distance greater than 4 Å, while in other parts the 6 anions are coordinated with Fe3+ with metal-ligand distances fluc-tuating between 2.6 and 3.8 Å. Figure 3c and Figure 3d show representative snapshots of the two coordination states which appear to be tetrahedral and octahedral, respectively. The corresponding fluctuations of the vertical energy gap are shown on Figure 3b. Sudden changes occur concommi-tently with the jumps in CN in Figure 3a, which shows that the confinement effect on the solvation of Fe3+ is at the origin of the departure from Marcus theory discussed above.
Among all models available in the literature to extend Marcus theory to non-linear behavior41 we use the one proposed by Vuilleumier et al.21 In particular, we employed their two-Gaussian solvation (TGS) state model, which allows the reactant and product to experience two different solvation states (S0and S1). This leads to four (two pairs) diabatic free energy parabolas instead
of two in the case of Marcus theory. For each of the states S0 or S1, the Landau free energy is
assumed to be quadratic, which corresponds to a Gaussian probability distribution Pη. The authors
also derived the necessary equations to compute the average energy gap h∆Eiη and the Landau free energies.
Marcus theory involves only 2 parameters: ∆A measures the relative position of the two parabo-las while λ is the reorganization energy of the solvent, which fixes the curvature of the parabola and also the width of the Gaussian distribution of the reaction coordinate. In the TGS model, 4 parameters are required, one reorganization energy for each state λS0 and λS1 and the relative
po-sitions of the two parabola for each solvation state ∆AS0 and ∆AS1. Moreover, a fifth parameter is
necessary to set the relative position of the two pairs of parabolas, for instance the difference in free energy between the two solvation states of the reduced species ∆SA0= AFe
2+
S1 − A
Fe2+ S0 .
The effect of the confinement was not investigated by the authors of the TGS model, since they only carried out simulations in bulk. However, it has been shown from simulation studies of the Eu3+/Eu2+ redox couple in potassium chloride molten salt at an fcc metallic electrode that the reorganization energy strongly depends on the distance between the ion and the electrode.42 This reorganization energy is expected to decrease when the redox species get closer to the elec-trode. We mention that this behavior had previously been predicted theoretically by Marcus for perfect conductors,38,43but this effect should decrease if the role of field penetration into the metal electrode was accounted.24,25
To quantify this effect in our system, we performed additional simulations with a planar graphite electrodes. They confirm the dependency on the distance to the electrode of the reorganization en-ergy, as shown in Supplementary Figures S2 to S4. In nanoporous electrodes it is not possible to define a simple distance to the electrode, the fit of the TGS model should therefore yield an aver-aged contribution of all the possible distances. However we observed that the iron does not go into contact with the carbon during the whole simulation data, regardless of the iron solvation state, the nature of the pore in which it is solvated or its coordination number. For this reason and for the sake of simplicity we made the additional assumption that the reorganization energies should
be equal for both states, turning the original 5-parameter model TGS into a 4 parameter-one. The different parameters obtained by fitting the simulation data are given in Table 1.
Table 1: TGS model parameters for Fe3+/Fe2+obtained by fitting simultaneously on Pη(∆E)
and h∆Eiη.
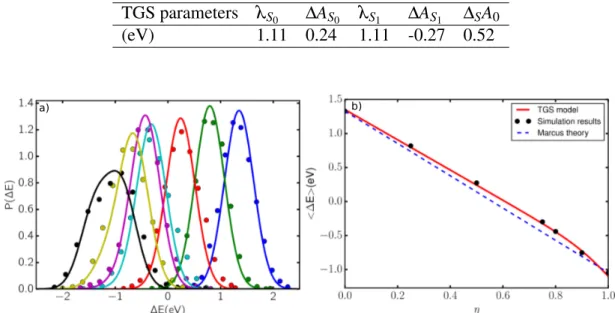
TGS parameters λS0 ∆AS0 λS1 ∆AS1 ∆SA0
(eV) 1.11 0.24 1.11 -0.27 0.52
a) b)
Figure 4: a) Probability distribution of the vertical energy gap, as a function of the coupling pa-rameter η. Points are the simulation data, and lines are the TGS model with the papa-rameters from Table 1. b) Comparison between the simulated average vertical energy gap for Fe3+/Fe2+in RTILs with various coupling parameters η (points) and the TGS model (red line).
Figure 4 compares the results obtained by simulations to the TGS model with the parameters given in Table 1. The left hand panel shows the probability distribution of the vertical energy gap, for the simulations realized with different values of the η parameter. The fitted TGS model agrees well with the whole set of distribution. The right hand panel reproduces the data of Figure 2 i.e. the vertical energy gap as a function of η. While those data could not be well reproduced by assuming linear response, the use of the TGS model allows an almost perfect fit to the data.
The diabatic free energy curves for the reduced and oxidized species in Fe3+/Fe2+ predicted by the TGS model with the parameters of Table 1 are plotted in Figure 5. The two parabolas for the reduced or oxidized state (η = 0 or 1) correspond to a given solvation state. The free energy dif-ference (∆SA0) between the hexacoordinated and the tetracoordinated forms of Fe2+is large (0.52
Figure 5: Diabatic free energy curves of the reduced and oxidized species obtained by TGS model with the parameters of Table 1. “CN4” and “CN6” labels refer to the tetra and hexacoordinated solvation states and correspond to S0and S1respectively.
eV) with respect to the thermal energy kBT (34.5 meV at T = 400 K). The hexacoordinated state
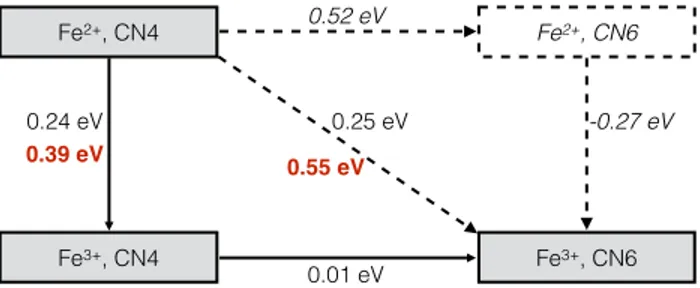
is therefore very unlikely, which explains why it is never observed in our equilibrium simulations. On the other hand, the free energies of the two coordination states are very close from each other for Fe3+. Fe2+, CN4 Fe2+, CN6 Fe3+, CN4 Fe3+, CN6 0.24 eV 0.25 eV 0.01 eV 0.52 eV -0.27 eV 0.39 eV 0.55 eV
Figure 6: Mechanistic diagram of the electron transfer reaction under confinement. Black numbers: free energy differences; red numbers: activation energies (labelled ∆A†1and ∆A†2on Figure 5).
The thermodynamic and kinetic informations extracted from Figure 5 are summarized in a mechanistic diagram in Figure 6. We can see that the electron transfer from tetracoordinated Fe2+ to hexacoordinated Fe3+ is as likely as the transfer to the tetracoordinated Fe3+ from a thermo-dynamic point of view, since the corresponding free energy differences are very similar, 0.24 and 0.25 eV respectively. From a kinetic point of view the picture is completely different since the cor-responding activation energy, taken at the intersection between the two parabolas, is much higher (0.55 eV vs. 0.39 eV). As a consequence, the effect of the confinement is likely to have a
nega-tive impact on the kinetic rate of the electron transfer reaction. Indeed, it allows for the existence of hexacoordinated Fe3+, which is not stable in the bulk liquid in our simulations. The electron transfer from Fe2+to this chemical species has a very large activation energy barrier, making such events unlikely to occur. This result contrasts with the observation of Remsing et al. who observed an enhancement of the electron transfer due to the confinement44 in a very different system. This is easily explained because in their work both the reduced and oxidized species where desolvated with respect to the bulk, while we observe the opposite behavior.
In conclusion, the aim of this work was to investigate the free energy properties of an elec-tron transfer reaction in a nanoporous carbon electrode. We performed MD simulations of the Fe3+/Fe2+redox couple dissolved in EMIM-BF4RTIL in contact with CDC electrodes. The latter
were maintained at a constant potential of 0 V during the simulations. The vertical energy gap between the redox species was used as the reaction coordinate, which enabled us to interpret the microscopic solvent fluctuation properties. The computed probability distribution of the vertical energy gaps and the equilibrium value of energy gaps do not follow the linear response approxi-mation of standard Marcus theory. We demonstrated the strong influence of the nanoconfinement effect on the solvation shell of the iron cations, which is the main reason for this departure from Marcus theory. In particular, the Fe3+ cation, which is tetracoordinated in the bulk, admits two stable solvation states in the nanoporous material: tetracoordinated and hexacoordinated. To ac-count for this deviation we used the two-Gaussian solvation model ,21 from which the free energy curves for all the redox species in their various solvation states were extracted. This allowed us to qualitatively analyse the effect of the confinement on the electron transfer reaction. The fluctu-ations in the structure of the solvation shell of Fe3+ were shown to have a negligible effect from a thermodynamic point of view. Rather, it was shown that the activation energy of the associated electron transfer process is much higher for the hexacoordinated form. It is therefore likely that the stabilization of this solvation state will result in a slow down of the electron transfer reaction kinetic. This work is a first step towards a deeper understanding of the influence of the confinement on the electron transfer in redox supercapacitor devices,29 which will be extended in future years
to promising systems such as biredox RTILs.16 To this end, it will be necessary to simulate more complex redox probes and to account systematically for the various complexation states. Another important aspect will be to decouple the contribution of the electron transfer event from the work-term that controls the approach of the ion to the interface in nanoconfinement.28 The techniques develop in this work could also provide useful information for the development of ionic liquids-based thermo-electrochemical cells.45
Methods
We performed molecular dynamics (MD) simulations of the present systems using coarse-grained force fields. The non-bonded interactions are represented using Lennard-Jones and Coulomb potentials, and the corresponding parameters for carbon atoms and EMIM-BF4interaction sites we
used herein are obtained from our previous work.32,46The parameters for the chloride and the iron ions are respectively taken from references47 and48 (the chloride anions were added in order to maintain the electroneutrality of the simulation cell, however their effect on the vertical energy gap was not studied since we focus on infinite dilution conditions). The simulations were conducted in the NVT ensemble, with the temperature set at 400 K using a Nosé-Hoover thermostat (relaxation time: 10 ps). The simulation cell is orthorhombic, with x = y = 4.37 nm, z = 14.86 nm, which reproduces the density of the RTILs compared with experimental results. Periodic boundary con-ditions are employed along x and y directions only through the use of a 2D-Ewald summation.49 For all the simulations, the time step is 2 fs and the time scales of productions are over 500 ps after equilibration. The electrodes are maintained at a constant potential (0 V in our present study) during the production runs. The vertical energy gap is sampled every 1 ps during the simulation. Following our previous work, a constant has been added to the energies calculated in the simula-tion to represent the (gas-phase) ionisasimula-tion potential of Fe2+and the work function of the metal;42 in practice, the value (15.78 eV) was chosen to bring the calculated redox potential close to the typical experimental values for the Fe3+/Fe2+couple in RTILs.50
Acknowledgement
This work was supported by the French National Research Agency (Labex STORE-EX, Grant No. ANR-10-LABX-0076). We acknowledge support from EoCoE, a project funded by the European Union Contract No. H2020-EINFRA-2015-1-676629, from the DSM-énergie programme of CEA and from the Eurotalent programme. We are grateful for the computing resources on OCCIGEN (CINES, French National HPC) and CURIE (TGCC, French National HPC) obtained through the project x2016096728.
Supporting information available: Distance between the anions and Fe2+ inside the CDC electrode, snapshot of the simulated graphite-based electrochemical cell, potentials of mean force with respect to the distance to the graphite, corresponding reorganization energies (PDF)
References
(1) Alba-Simionesco, C.; Coasne, B.; Dosseh, G.; Dudziak, G.; Gubbins, K. E.; Radhakrish-nan, R.; Sliwinska-Bartkowiak, M. Effects of Confinement on Freezing and Melting. J. Phys.: Condens. Matter2006, 18, R15–R68.
(2) Jiang, X.; Huang, J.; Sumpter, B. G.; Qiao, R. Electro-Induced Dewetting and Concomitant Ionic Current Avalanche in Nanopores. J. Phys. Chem. Lett. 2013, 4, 3120–3126.
(3) Pean, C.; Daffos, B.; Rotenberg, B.; Levitz, P.; Haefele, M.; Taberna, P. L.; Simon, P.; Salanne, M. Confinement, Desolvation, and Electrosorption Effects on the Diffusion of Ions in Nanoporous Carbon Electrodes. J. Am. Chem. Soc. 2015, 137, 12627–12632.
(4) Agrawal, K. V.; Shimizu, S.; Drahushuk, L. W.; Kilcoyne, D.; Strano, M. S. Observation of Extreme Phase Transition Temperatures of Water Confined Inside Isolated Carbon Nan-otubes. Nat. Nanotech. 2017, 12, 267–273.
Simon, P. Efficient Storage Mechanisms for Building Better Supercapacitors. Nat. Energy 2016, 1, 16070.
(6) Kornyshev, A. A. Double-layer in Ionic Liquids: Paradigm Change? J. Phys. Chem. B 2007, 111, 5545–5557.
(7) Chmiola, J.; Yushin, G.; Gogotsi, Y.; Portet, C.; Simon, P.; Taberna, P. L. Anomalous Increase in Carbon Capacitance at Pore Sizes Less Than 1 Nanometer. Science 2006, 313, 1760–1763. (8) Raymundo-Piñero, E.; Kierzek, K.; Machnikowski, J.; Béguin, F. Relationship Between the Nanoporous Texture of Activated Carbons and Their Capacitance Properties in Different Electrolytes. Carbon 2006, 44, 2498–2507.
(9) Kondrat, S.; Perez, C. R.; Presser, V.; Gogotsi, Y.; Kornyshev, A. A. Effect of Pore Size and Its Dispersity on the Energy Storage in Nanoporous Supercapacitors. Energy Environ. Sci. 2012, 5, 6474–6479.
(10) Merlet, C.; Rotenberg, B.; Madden, P. A.; Taberna, P.-L.; Simon, P.; Gogotsi, Y.; Salanne, M. On the Molecular Origin of Supercapacitance in Nanoporous Carbon Electrodes. Nat. Mater. 2012, 11, 306–310.
(11) He, Y.; Huang, J.; Sumpter, B. G.; Kornyshev, A. A.; Qiao, R. Dynamic Charge Storage in Ionic Liquids-filled Nanopores: Insight from a Computational Cyclic Voltammetry Study. J. Phys. Chem. Lett.2015, 6, 22–30.
(12) Vatamanu, J.; Bedrov, D. Capacitive Energy Storage: Current and Future Challenges. J. Phys. Chem. Lett.2015, 6, 3594–3609.
(13) Silvester, D. S.; Compton, R. G. Electrochemistry in Room Temperature Ionic Liquids: A Review and Some Possible Applications. Z. Phys. Chem 2006, 220, 1247–1274.
(14) Armand, M.; Endres, F.; MacFarlane, D. R.; Ohno, H.; Scrosati, B. Ionic-liquid Materials for the Electrochemical Challenges of the Future. Nat. Mater. 2009, 8, 621–9.
(15) Burt, R.; Breitsprecher, K.; Daffos, B.; Taberna, P.-L.; Simon, P.; Birkett, G.; Zhao, X. S.; Holm, C.; Salanne, M. Capacitance of Nanoporous Carbon-Based Supercapacitors Is a Trade-Off between the Concentration and the Separability of the Ions. J. Phys. Chem. Lett. 2016, 7, 4015–4021.
(16) Mourad, E.; Coustan, L.; Lannelongue, P.; Zigah, D.; Mehdi, A.; Vioux, A.; Freun-berger, S. A.; Favier, F.; Fontaine, O. Biredox Ionic Liquids with Solid-like Redox Density in the Liquid State for High-energy Supercapacitors. Nat. Mater. 2017, 16, 446–453.
(17) Marcus, R. A. On the Theory of Oxidation-Reduction Reactions Involving Electron Transfer. I. J. Chem. Phys. 1956, 24, 966–978.
(18) Small, D. W.; Matyushov, D. V.; Voth, G. A. The Theory of Electron Transfer Reactions: What May Be Missing? J. Am. Chem. Soc. 2003, 125, 7470–7478.
(19) Blumberger, J. Cu+aq/Cu2+aq Redox Reaction Exhibits Strong Nonlinear Solvent Response Due to Change in Coordination Number. J. Am. Chem. Soc. 2008, 130, 16065–16068.
(20) Matyushov, D. V.; Voth, G. A. Modeling the Free Energy Surfaces of Electron Transfer in Condensed Phases. J. Chem. Phys. 2000, 113, 5413–5424.
(21) Vuilleumier, R.; Tay, K. A.; Jeanmairet, G.; Borgis, D.; Boutin, A. Extension of Marcus Picture for Electron Transfer Reactions with Large Solvation Changes. J. Am. Chem. Soc. 2012, 134, 2067–2074.
(22) Laborda, E.; Henstridge, M. C.; Batchelor-McAuley, C.; Compton, R. G. Asymmetric Marcus–Hush Theory for Voltammetry. Chem. Soc. Rev. 2013, 42, 4894–4905.
(23) Tanner, E. E. L.; Barnes, E. O.; Tickell, C. B.; Goodrich, P.; Hardacre, C.; Compton, R. G. Ap-plication of Asymmetric Marcus-Hush Theory to Voltammetry in Room-Temperature Ionic Liquids. J. Phys. Chem. C 2015, 119, 7360–7370.
(24) Dzhavakhidze, P. G.; Kornyshev, A. A.; Krishtalik, L. I. Activation Energy of Electrode Re-actions: the Non-Local Effects. J. Electroanal. Chem. 1987, 228, 329–346.
(25) Phelps, D. K.; Kornyshev, A. A.; Weaver, M. J. Nonlocal Electrostatic Effects on Electron-Transfer Activation Energies: Some Consequences for and Comparisons with Electrochemi-cal and Homogeneous-Phase Kinetics. J. Phys. Chem. 1990, 94, 1454–1463.
(26) Merlet, C.; Péan, C.; Rotenberg, B.; Madden, P. A.; Daffos, B.; Taberna, P.-L.; Simon, P.; Salanne, M. Highly Confined Ions Store Charge More Efficiently in Supercapacitors. Nat. Commun.2013, 4, 2701.
(27) Prehal, C.; Koczwara, C.; Jäckel, N.; Schreiber, A.; Burian, M.; Amenitsch, H.; Hart-mann, M. A.; Presser, V.; Paris, O. Quantification of Ion Confinement and Desolvation in Nanoporous Carbon Supercapacitors with Modelling and in Situ X-ray Scattering. Nat. En-ergy2017, 2, 16215.
(28) Bai, P.; Bazant, M. Z. Charge Transfer Kinetics at the Solid–solid Interface in Porous Elec-trodes. Nat. Commun. 2014, 5, 3585.
(29) Akinwolemiwa, B.; Peng, C.; Chen, G. Z. Redox Electrolytes in Supercapacitors. J. Elec-trochem. Soc.2015, 162, A5054–A5059.
(30) Su, L.-H.; Zhang, X.-G.; Mi, C.-H.; Gao, B.; Liu, Y. Improvement of the Capacitive Perfor-mances for Co–Al Layered Double Hydroxide by Adding Hexacyanoferrate into the Elec-trolyte. Phys. Chem. Chem. Phys. 2009, 11, 2195–2202.
(31) Pereiro, A. B.; Araújo, J. M. M.; Oliveira, F. S.; Esperança, J. M. S. S.; Canongia Lopes, J. N.; Marrucho, I. M.; Rebelo, L. P. N. Solubility of Inorganic Salts in Pure Ionic Liquids. J. Chem. Thermodyn.2012, 55, 29–36.
Liquids for Bulk and Interfacial Molecular Simulations. J. Phys. Chem. C 2012, 116, 7687– 7693.
(33) Roy, D.; Maroncelli, M. An Improved Four-Site Ionic Liquid Model. J. Phys. Chem. B 2010, 114, 12629–12631.
(34) Siepmann, J. I.; Sprik, M. Influence of Surface Topology and Electrostatic Potential on Wa-ter/Electrode Systems. J. Chem. Phys. 1995, 102, 511–524.
(35) Palmer, J. C.; Llobet, A.; Yeon, S. H.; Fischer, J. E.; Shi, Y.; Gogotsi, Y.; Gubbins, K. E. Modeling the Structural Evolution of Carbide-derived Carbons Using Quenched Molecular Dynamics. Carbon 2010, 48, 1116–1123.
(36) Warshel, A. Dynamics of Reactions in Polar Solvents. Semiclassical Trajectory Studies of Electron-transfer and Proton-transfer Reactions. J. Phys. Chem. 1982, 86, 2218–2224. (37) Hwang, J. K.; Warshel, A. Microscopic Examination of Free-energy Relationships for
Elec-tron Transfer in Polar Solvents. J. Am. Chem. Soc. 1987, 109, 715–720.
(38) Marcus, R. A. On the Theory of Electron-Transfer Reactions. VI. Unified Treatment for Ho-mogeneous and Electrode Reactions. J. Chem. Phys. 1965, 43, 679–701.
(39) Georgievskii, Y.; Hsu, C.-P.; Marcus, R. A. Linear Response in Theory of Electron Transfer Reactions as an Alternative to the Molecular Harmonic Oscillator Model. J. Chem. Phys. 1999, 110, 5307–5317.
(40) King, G.; Warshel, A. Investigation of the Free Energy Functions for Electron Transfer Re-actions. J. Chem. Phys. 1990, 93, 8682–8692.
(41) Blumberger, J. Recent Advances in the Theory and Molecular Simulation of Biological Elec-tron Transfer Reactions. Chem. Rev. 2015, 115, 11191–11238.
(42) Pounds, M. A.; Salanne, M.; Madden, P. A. Molecular Aspects of the Eu3+ /Eu2+ Redox Reaction at the Interface Between a Molten Salt and a Metallic Electrode. Mol. Phys. 2015, 113, 2451–2462.
(43) Marcus, R. A. Reorganization Free Energy for Electron Transfers at Liquid-liquid and Di-electric Semiconductor-liquid Interfaces. J. Phys. Chem. 1990, 94, 1050–1055.
(44) Remsing, R. C.; McKendry, I. G.; Strongin, D. R.; Klein, M. L.; Zdilla, M. J. Frustrated Solvation Structures Can Enhance Electron Transfer Rates. J. Phys. Chem. Lett. 2015, 6, 4804–4808.
(45) Abraham, T. J.; MacFarlane, D. R.; Pringle, J. M. Seebeck Coefficients in Ionic Liquids –prospects for Thermo-electrochemical Cells. Chem. Commun. 2011, 47, 6260–6262. (46) Merlet, C.; Péan, C.; Rotenberg, B.; Madden, P. A.; Simon, P.; Salanne, M. Simulating
Su-percapacitors: Can We Model Electrodes As Constant Charge Surfaces? J. Phys. Chem. Lett. 2013, 4, 264–268.
(47) Dang, L. X. Mechanism and Thermodynamics of Ion Selectivity in Aqueous Solutions of 18-Crown-6 Ether: A Molecular Dynamics Study. J. Am. Chem. Soc. 1995, 117, 6954–6960. (48) Ando, K. Solvent Nuclear Quantum Effects in Electron Transfer Reactions. III. Metal Ions in
Water. Solute Size and Ligand Effects. J. Chem. Phys. 2001, 114, 9470–9477.
(49) Reed, S. K.; Lanning, O. J.; Madden, P. A. Electrochemical Interface Between an Ionic Liquid and a Model Metallic Electrode. J. Chem. Phys. 2007, 126, 084704.
(50) Yamato, Y.; Katayama, Y.; Miura, T. Effects of the Interaction Between Ionic Liquids and Redox Couples on Their Reaction Entropies. J. Electrochem. Soc. 2013, 6, H309–H314.