HAL Id: hal-02915584
https://hal.archives-ouvertes.fr/hal-02915584
Submitted on 15 Aug 2020
HAL is a multi-disciplinary open access archive for the deposit and dissemination of sci-entific research documents, whether they are pub-lished or not. The documents may come from teaching and research institutions in France or
L’archive ouverte pluridisciplinaire HAL, est destinée au dépôt et à la diffusion de documents scientifiques de niveau recherche, publiés ou non, émanant des établissements d’enseignement et de recherche français ou étrangers, des laboratoires
Nanosecond Tracer Diffusion as a Probe of the Solution
Structure and Molecular Mobility of Protein Assemblies:
The Case of Ovalbumin
Christian Beck, Marco Grimaldo, Felix Roosen-Runge, Michal Braun, Fajun Zhang, Frank Schreiber, Tilo Seydel
To cite this version:
Christian Beck, Marco Grimaldo, Felix Roosen-Runge, Michal Braun, Fajun Zhang, et al.. Nanosecond Tracer Diffusion as a Probe of the Solution Structure and Molecular Mobility of Protein Assemblies: The Case of Ovalbumin. Journal of Physical Chemistry B, American Chemical Society, 2018, 122 (35), pp.8343-8350. �10.1021/acs.jpcb.8b04349�. �hal-02915584�
Nanosecond Tracer Diffusion as a Probe of the Solution
Struc-ture and Molecular Mobility of Protein Assemblies: The Case
of Ovalbumin
Christian Becka,b, Marco Grimaldoa, Felix Roosen-Rungec, Michal K. Braunb, Fajun Zhangb, Frank Schreiberb and Tilo Seydela,∗
a Institut Max von Laue – Paul Langevin (ILL), B.P.156, F-38042 Grenoble, France. b Institut f¨ur Angewandte Physik, Universit¨at T¨ubingen, Auf der Morgenstelle 10,
72076 T¨ubingen, Germany.
c Division of Physical Chemistry, Department of Chemistry, Lund University,
Naturve-tarv¨agen 16, SE-22100 Lund, Sweden.
Abstract
Protein diffusion is not only an important process ensuring biological function, but can also be used as a probe to obtain information on structural properties of pro-tein assemblies in liquid solutions. Here, we explore the oligomerization state of ovalbumin at high protein concentrations by means of its short-time self-diffusion. We employ high-resolution incoherent quasi-elastic neutron scattering to access the self-diffusion on nanosecond time scales, on which interparticle contacts are not al-tered. Our results indicate that ovalbumin in aqueous (D2O) solutions occurs in
increasingly large assemblies of its monomeric subunits with rising protein concen-tration. It changes from nearly monomeric towards dimeric and ultimately larger than tetrameric complexes. Simultaneously, we access information on the internal molecular mobility of ovalbumin on the nanometer length scale and compare it to results obtained for bovine serum albumin, immunoglobulin and β-lactoglobulin.
1
Introduction
Protein assemblies such as clusters in liquid solutions are of fundamental interest regarding biological self-organization1–3. It is often difficult to understand such assemblies by solely employing static methods such as small-angle scattering, and experiments probing the protein dynamics are therefore performed in addition4–8. This observation holds in particular when protein assemblies are not static but dynamic or transient9.
Self-assembled protein aggregates can be reasons for diseases such as eye cataract10, sickle cell anemia11, Alzheimer’s disease and Parkinson’s disease12, but are also in-teresting for medical applications.
In this context, incoherent quasi-elastic neutron scattering (QENS) allows to un-ambiguously access the self-diffusion of particles with nanometer hydrodynamic radii suspended in aqueous solutions. Using deuterated solvents, neutron backscattering spectroscopy becomes predominantly sensitive to the prevailing incoherent scatter-ing from the protein tracer particles13. Systematic studies of the diffusive dynamics of protein solutions permit to address the effect of macromolecular crowding14,15 on both the global and internal motions of proteins16–18. It has been shown that these two contributions can be reliably separated using high-resolution QENS13,17–19.
Moreover, it has been shown that the translational center-of-mass diffusion of glob-ular proteins as a function of the protein concentration in the solution can be quan-titatively described in terms of the diffusion of colloidal hard spheres17. Besides macromolecular crowding, the diffusive dynamics depends also on control param-eters such as the sample temperature20,21 and the charge state influenced by the possible presence of salt ions in the solution19,22. Changes in the diffusive behav-ior due to structural changes induced by denaturation20,23 or by mutations24 could also be investigated. These studies on simplified model systems composed of a single target protein in water complement other neutron spectroscopy studies on more com-plex systems which mimic in vivo conditions, including the diffusion of selectively labeled proteins in deuterated living cells25. By comparing spectra collected with deuterated and hydrogenated solvents, it is also possible to determine the dynamics of the solvent in vivo26,27.
Ultimately, the aggregation of proteins from a monomeric suspension into clus-ters caused by the presence of multivalent salt ions has been explored using high-resolution incoherent neutron spectroscopy19,28 and can be interpreted in terms of the theory of so-called patchy colloidal particles29,30. This agreement points to the future perspective of quantitatively understanding and controlling dynamic
pro-cesses governing the formation of protein clusters and larger protein aggregates. A very useful observation made in several previous studies on the diffusion of model proteins in aqueous solutions is that the protein center-of-mass undergoes a strictly Brownian diffusion on the nanosecond and nanometer observation scales of QENS and even in “physiologically” crowded suspensions (i.e. at volume fractions of up to approximately 30%)13,17–19,31,32. Importantly, this observation is made without imposing it as an assumption in the model fitting, implying that the dependencies of the different contributions from the global and internal motions of proteins are obtained independently from the same data set. The Brownian character of the center-of-mass diffusion has in particular been further corroborated on backscat-tering spectrometers with an intermediate resolution and broader energy transfer range. Due to the increasingly broad spectral contribution of the center-of-mass diffusion from dilute suspensions at high scattering vectors q, these spectrometers best access the high-q range.13,19
The observed Brownian center-of-mass diffusion strictly obeys a Stokes-Einstein temperature dependence20 and, importantly, as already indicated above, a depen-dence on the protein volume fraction in the solution that follows the model for the short-time diffusive properties of colloidal hard-sphere suspensions17. Given this
previous observation, it is now possible to conversely infer the size of a macromolec-ular assembly such as a protein cluster via its effective hydrodynamic radius which defines its Brownian center-of-mass diffusion28. In this way, a possible dependence of the formation of protein assemblies on external parameters such as the protein concentration can be explored. Moreover, the observation time-scale of the employed spectrometer, given by the energy resolution of the instrument, provides information on the life time of such an assembly.
In addition to the information on the center-of-mass motion of the assemblies, the elastic incoherent structure factor33 (EISF) and a characteristic linewidth associated with the internal molecular fluctuations, that can be compared between different proteins, are obtained.
Here we present a high-resolution neutron backscattering study of ovalbumin (OVA) protein suspensions in heavy water (D2O). We investigate the
oligomeriza-tion based on the results of the global diffusion and we compare the internal dy-namics to bovine serum albumin (BSA), immunoglobulin (Ig), and β-lactoglobulin (BLG) protein solutions. The global diffusion of BSA, Ig and BLG was investigated by Grimaldo et al. in 201520 and 201418 and by Braun et al.28, respectively. Oval-bumin is an approximately globular protein, and aqueous ovalOval-bumin solutions have
been studied previously using small-angle scattering34. Its structure has been un-derstood in terms of tetrameric assemblies that constitute the basic building blocks of ovalbumin crystals studied in protein crystallographic experiments. In liquid solutions, it appears that the ovalbumin tetramer may dissociate into dimers and monomers. However, this possible dissociation has been subject to debate, because SAXS measurements and other physicochemical measurements such as analytical ul-tracentrifugation resulted in conflicting results35. Our results using QENS suggest that the dissociation of Ovalbumin tetramers may occur at sufficiently low protein concentrations.
2
Experiments and Methods
Chicken egg-white ovalbumin OVA (A5503, ≥ 98% purity), bovine serum albu-min BSA (A3059, ≥ 98% purity), the polyclonal immunoglobulin bovine gamma-globulin Ig (G5009 ≥ 99% purity), and β-lactogamma-globulin BLG (L3908, ≥ 90% purity) were obtained as lyophilized powders from Sigma-Aldrich and used without further purification.
Solutions were prepared by a direct dissolution of the mass mp of protein powder
cp := mp/V . The resulting dry protein volume fraction in the solution is calculated
as17
ϕ = mpνp V + mpνp
, (1)
where νp = 0.746 ml/g is the specific volume of ovalbumin at 25◦C36–38.
The dry volume fraction ϕ from equation 1 can be linked to the real protein concentration cp,real = ϕ/νp.
The experimental data were recorded on the neutron backscattering spectrom-eter IN16B at the Institut Max von Laue - Paul Langevin, Grenoble, France39, using Si(111) monochromator and analyzer crystals, setting the elastic wavelength to 6.27 ˚A. A phase space transformer40 was used to optimize the neutron flux at the sample position. The energy resolution function R(ω) had an approximative width of ≈ 0.9 µeV FWHM and was described analytically by a fit of two Gaussian functions of the measured spectrum from a Vanadium sample13. The spectrometer chamber was kept in vacuum during the acquisition. The samples were filled into cylindrical, indium-sealed Aluminium sample holders and held in a standard Orange cryofurnace during the data acquisition. In total, 18 detectors were used to cover a scattering vector q-range of approximately 0.2 ˚A−1 ≤ q ≤ 1.9 ˚A−1.
-20
0
20
10
-4
10
-3
10
-2
0
2
0
5
10
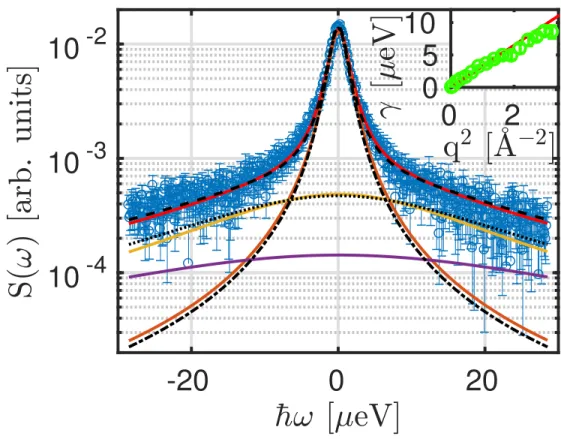
Figure 1: Example spectrum of ovalbumin (cp = 200 mgml) in water (D2O) (symbols) recorded on
IN16B at T = 295 K and q = 0.56 ˚A−1. The solid lines denote the results from the fit of the individual spectrum according to equation 2 without imposing any q-dependence. The red solid line superimposed on the symbols denotes the fit result composed of the Lorentzian with the width γ modeling the global diffusion (narrow brown line); the broader Lorentzian with the width Γ for internal dynamics (yellow line); and the nearly flat fixed water contribution (lower violet line). The dashed and dash-dotted lines superimposed on the solid lines depict the fit result and fit components in the case of the fit approach that imposes Brownian diffusion for the global motion and jump diffusion for the internal motion (see text). The water contribution is handled in the same way for both approaches. The inset shows γ versus q2 from the q-dependent fit (symbols). The solid line in the inset reports a fit of γ(q) = D q2.
employed model for the scattering function S depending on the scattering vector q and energy transfer ~ω was
S(q, ω) = R ⊗ { β(q) [ A0(q) L(γ(q), ω)
+ ( 1 − A0(q) ) L(γ(q) + Γ(q), ω)]
+ βD2O(q) L(γD2O(q), ω) } . (2)
Therein, R = R(q, ω) denotes the spectrometer resolution function, L(γ, ω) repre-sents a Lorentzian function with the width γ, β(q) is an intensity scaling factor, and A0(q) the EISF of the proteins. Importantly, in the present study, two types of
fits using this model, equation 2, were carried out: (a) individual fits of the spec-tra for the different q-values (q < 1.8 ˚A−1) separately; and (b) fits of the spectra for all q-values simultaneously20, denoted global fits. In the second case (b), the dependencies γ(q) = D q2 and41
Γ(q) = Dintq
2
1 + Dintq2τ
(3)
were imposed. Thus, the global diffusion associated with γ(q) was assumed to be Brownian, and the internal diffusion of the proteins associated with Γ(q) was assumed to obey a so-called jump diffusion41 with the internal diffusion coefficient Dint and the residence time τ . In contrast, the first approach (a) confirmed the
validity within the errors of imposing γ = D q2 and the jump diffusion determining Γ(q), equation 3, in accordance with earlier studies13,17–19.
Example data and fits using equation 2 are depicted in Figure 1. In the plot, dash-dotted and dash-dotted lines in the figure represent the result from the simultaneous fit of the spectra for all q at once, and solid lines report the result from the fits without imposing any q-dependence. We observe a good agreement of these two different fit approaches. The inset of Figure 1 displays the obtained γ(q) for the case of the individual fits for each q (symbols). This inset illustrates that the center-of-mass diffusion for the ovalbumin solutions follows Brownian dynamics without imposing it. The small deviation of the fit results from γ(q) = Dq2 at the highest q-values is presumably due to cross-talking of the signals from the Lorentzian contributions with the widths Γ and γ.
The EISF A0(q) resulting from the fit of equation 2 was fitted by18,33,42
A0(q) = p0 + (1 − p0) [ p1A3−jump(q)
+ (1 − p1) Asphere(q) ] . (4)
Therein, p0 denotes the fraction of hydrogen atoms that appear immobile on the
observation time scale of our experiment. p1 is the fraction of the mobile hydrogen
atoms, (1 − p0)(1 − p1) are assumed to undergo a diffusion inside an impermeable
sphere with the confinement radius Rs. A3−jump(q) and Asphere(q) are described as
follows18,33,42: A3−jump(q) = 1 3 [1 + 2j0(qa)] (5) and Asphere(q) = 3j1(qRs) qRs 2 , (6)
where j0 = sin(x)/x and j1(x) denote the spherical Bessel functions of the zeroth
and first order, respectively. The three-site jump diffusion, equation 5 is assumed to be due to the reorientation of methyl groups -CH3, associated with a fixed jump
distance a = 1.715 ˚A18,33,42.
All data reductions and fits were performed using MATLAB (The MathWorks, Inc.), partly involving MATLAB “mex”-files employing the GNU Scientific Libraries for numerical integration and root finding13,17.
3
Theory and Modeling
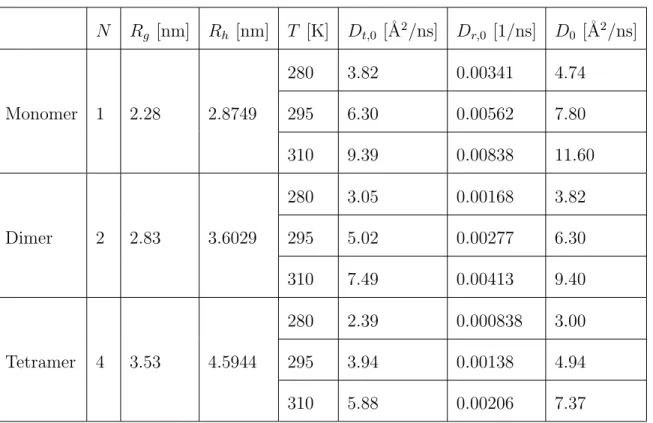
From the tetrameric crystal structure (N = 4) of ovalbumin (PDB 1ova, four chains)43, we have extracted a dimeric structure (N = 2) by using only the closely-bound chains A and B from the tetrameric structure. For the monomer structure
(N = 1) we used chain A.
For each of the three structures, HYDROPRO44 was used to calculate the trans-lational and rotational diffusion coefficients in the limit of infinite dilution, Dt0 =
Dt0(N ) and Dr0 = Dr0(N ) as well as the radius of gyration Rg = Rg(N ), as
sum-marized in Table 1.
The hydrodynamic radii Rh(N ) were calculated from the translational diffusion
coefficients Dt0 determined with HYDROPRO.
For consistency with the neutron data, the HYDROPRO calculations were per-formed using the viscosity and solution density of D2O45.
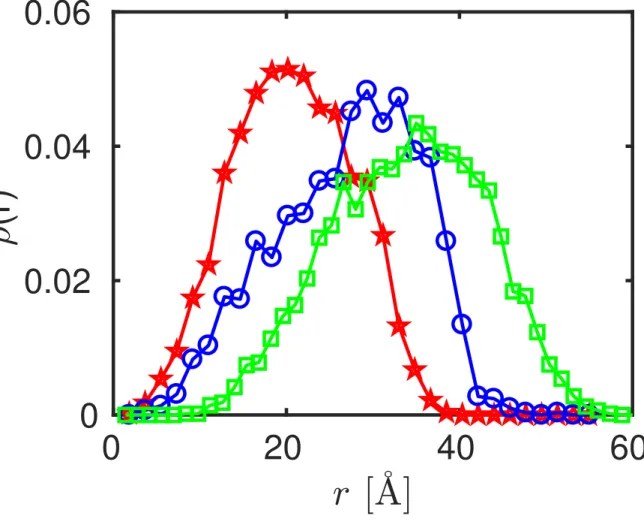
Moreover, the GROMACS46 tool pdb2gmx was used to add the missing hydrogen atoms. Mathematica was used to extract the positions of the hydrogen atoms in these protein monomer, dimer, and tetramer structures. From the thus obtained hydrogen coordinates, the radial hydrogen density distribution functions ρ(r, N ) for these three structures were calculated (Figure 2).
The diffusion coefficients depend on the effective volume fraction
φ = ϕ · (Rh/R)3 (7)
0
20
40
60
0
0.02
0.04
0.06
(r)
Figure 2: Radial hydrogen density distribution functions ρ(r, N ) of the ovalbumin monomer (star symbols), dimer (circles), and tetramer (squares), obtained from the associated protein data bank (PDB) structure files as described in the text.
N Rg [nm] Rh [nm] T [K] Dt,0 [˚A2/ns] Dr,0 [1/ns] D0 [˚A2/ns] Monomer 1 2.28 2.8749 280 3.82 0.00341 4.74 295 6.30 0.00562 7.80 310 9.39 0.00838 11.60 Dimer 2 2.83 3.6029 280 3.05 0.00168 3.82 295 5.02 0.00277 6.30 310 7.49 0.00413 9.40 Tetramer 4 3.53 4.5944 280 2.39 0.000838 3.00 295 3.94 0.00138 4.94 310 5.88 0.00206 7.37
Table 1: Table of properties of ovalbumin monomers, dimers, and tetramers calculated using HY-DROPRO44 for D2O solutions (see text). The hydrodynamic radii Rh are calculated from the
translational diffusion coefficients in the dilute limit Dt,0. D0 is the apparent diffusion coefficient in
the dilute limit calculated by equation 9 with Dt= Dt,0 and Dr = Dr,0. Rg is the radius of gyration.
molar mass Mw17,18,47,48: R =r 33 4π νpMw NA (8) with the Avogadro constant NA and the molecular weight of a monomer Mw =
42.7 kDa49.
By rescaling the volume fraction using an effective radius, anisotropy effects and influences due to the hydration layer are taken into account17.
and fr(φ) (Ref.51 Eq. (21)) were used to rescale the translational and rotational
diffusion coefficients, respectively for the different protein oligomers, i.e. Dt(φ) =
Dt0ft(φ) and Dr(φ) = Dr0fr(φ) which were then used to calculate the volume
frac-tion dependent apparent diffusion coefficient.
The apparent diffusion coefficient D can be obtained from the solution of the implicit equation13,17 n X l=0 Bl(q) Drl(l + 1) + (Dt − D)q2 [Drl(l + 1) + (Dt + D)q2]2 = 0 , (9)
where n has to be chosen large enough to obtain convergence on the desired q-range13. For our case, we chose n = 75.
Bl(q) in Eq. 9 is determined by the radial distribution of hydrogens ρ(r, N ) by
Bl(q) = (2l + 1) ∞
R
0
drρ(r, N )jl2(qr) (10) with the lth order spherical Bessel functions of first kind, jl(x).
The values for D from HYDROPRO for the monomer are consistent with pub-lished results for native ovalbumin obtained using Dynamic Light Scattering in H2O
4
Results and discussion
4.1 Rotational and translational diffusion
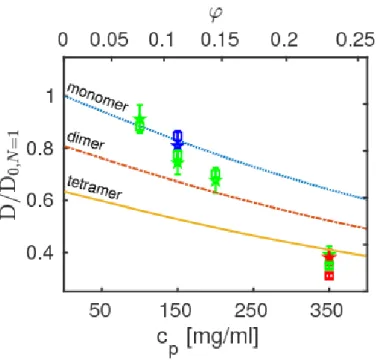
The observable apparent diffusion coefficients D of ovalbumin given by γ(q) = Dq2 with the fitted γ according to equation 2 are depicted in Figure 3. The exper-imental values of D are depicted for the two distinct fit approaches explained in the Experiment and Methods section: (a) by a fit without a priori imposing γ(q) = D q2 (star symbols); and (b) by a global fit imposing γ(q) = D q2 and Γ(q) = Dintq2/(1 + Dintq2τ ) (square symbols, cf. Experiments and Methods). The
results for both approaches agree very well.
The observed apparent diffusion coefficients scale with the temperature and pro-tein concentration as expected, i.e. the diffusion increases with rising temperature and decreases with rising protein concentration. For a better readability of the plot, the diffusion coefficients are normalized by the monomer diffusion coefficient in the dilute limit at the given temperature.
Figure 3 also reports an interpretation of these results for D by plotting the calculated apparent diffusion coefficients D(φ) = f (Dr(φ), Dt(φ)) using equation 9
for ovalbumin monomers (dash-dotted), dimers (dotted) and tetramers (solid) based on colloid models for the short-time self-diffusion of hard spheres. This calculation is
Figure 3: Normalized apparent diffusion coefficients of ovalbumin (symbols) obtained from the fits. Square symbols denote results obtained from a global fit imposing the q-dependence of the global apparent diffusion γ(q) = Dq2 and jump diffusion for the internal dynamics. Star-symbols denote
results obtained by fitting γ(q) = Dq2 to the fit results for γ(q). The samples were measured at the temperatures T = 280, 295, and 310 K (blue, red, and green symbols, respectively). The lower x-axis denotes the nominal protein concentrations cp (equation 1) from the sample preparation, i.e. the
weighed dry protein powder mass per volume of D2O that it was dissolved in, and the upper
x-axis represents the calculated dry protein volume fraction ϕ (equation 1). The lines indicate the theoretical apparent diffusion coefficients for ovalbumin monomers (dotted), dimers (dash-dotted), and tetramers (solid), respectively, calculated using equation 9.
based on equations 7 and 9 with the assumptions for Dt = Dt(φ, N ), Dr = Dr(φ, N )
and ρ(r, N ) (Figure 2) as explained in the Theory section. The samples are prepared with the nominal concentration cp of the proteins in D2O (lower x-axis in Figure 3),
resulting in the dry protein volume fraction ϕ using equation 1 (upper x-axis in Figure 3).
By comparing the experimental observation and theory, our results indicate that at T = 295 K ovalbumin assemblies are, on average, nearly monomeric at cp = 100 mgml, approximately dimeric at 200mgml, and tetrameric at cp = 350 mgml. The
distribution may depend slightly on temperature as suggested by the slight spread of the symbols for cp = 150 mgml. We assume that a distribution of N -mers is present
that increasingly shifts to a tetrameric assembly with rising protein volume fraction. Here we emphasize that in the present picture, the oligomers are seen as rigid assem-blies in our experiment with an observation time on the order of one nanosecond.
The oligomers may be subject to internal fluctuations of the monomeric building blocks relative to each other, or be subject to a dissociation of these building blocks, on longer time scales. Moreover, a distribution of N -mers with different N may result in an average apparent N due to the limited accuracy and ensemble-averaging in our experiment.
0
0.5
1
1.5
0.4
0.6
0.8
1
BLG
Ig
BSA
OVA
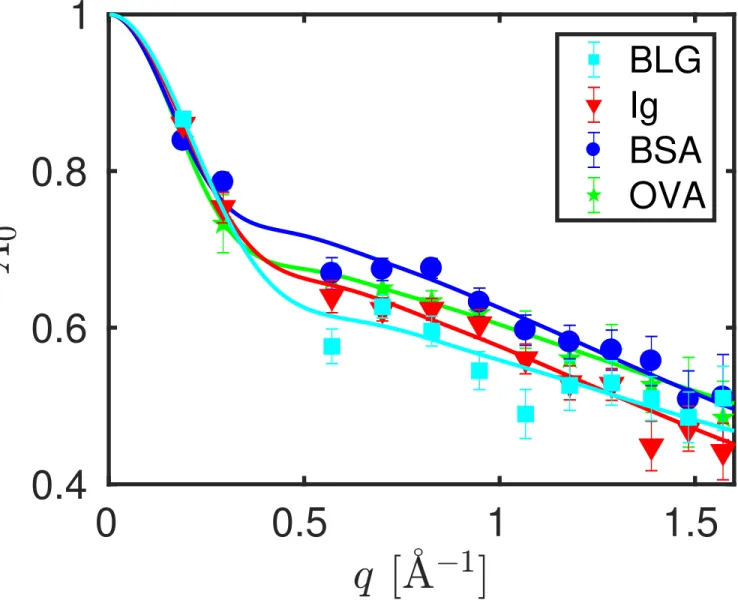
Figure 4: Fit results (symbols) from equation 2 for the Elastic Incoherent Structure Factor (EISF) A0(q) at T = 295 K and cp = 200mgml (Ig, BSA, OVA) and cp = 300mgml (BLG), and fit of equation 4
to these results (lines). Square symbols denote BLG, triangle symbols Ig, circle symbols BSA, and star symbols OVA, respectively.
4.2 Internal diffusion
Simultaneously with the fit results for D, we obtain results on the internal molecular nanosecond relaxation motion of ovalbumin in D2O. Our experiment observes these
internal diffusive motions on a nanometer length scale, and, thus, displacements smaller than the protein radius. For the internal diffusion, we employ the individ-ual fit approach for the spectra at each q separately, because the jump diffusion model, equation 3, only constitutes an approximate model of the internal diffusion. This model has nevertheless been shown to be sufficiently suitable for proteins at physiological temperatures18,20,54. We obtain Γ(q) and A0(q) (equation 2) from this
fit. Figure 4 depicts the resulting EISF A0(q) associated with the internal diffusive
motions of the proteins and the fits of equation 4. The resulting fit parameters for the EISF are given in Table 2. The EISF from the different proteins are nearly indistinguishable within the limits of the present experimental accuracy, as well as independent from the crowding. The latter observation is consistent with ear-lier findings18. The value for BSA is in good agreement with the value found at T = 295 K in an earlier study using a different neutron spectrometer20.
The confinement radius Rs does appear to have a systematic dependence on the
0
1
2
3
4
0
10
20
30
40
50
[
eV]
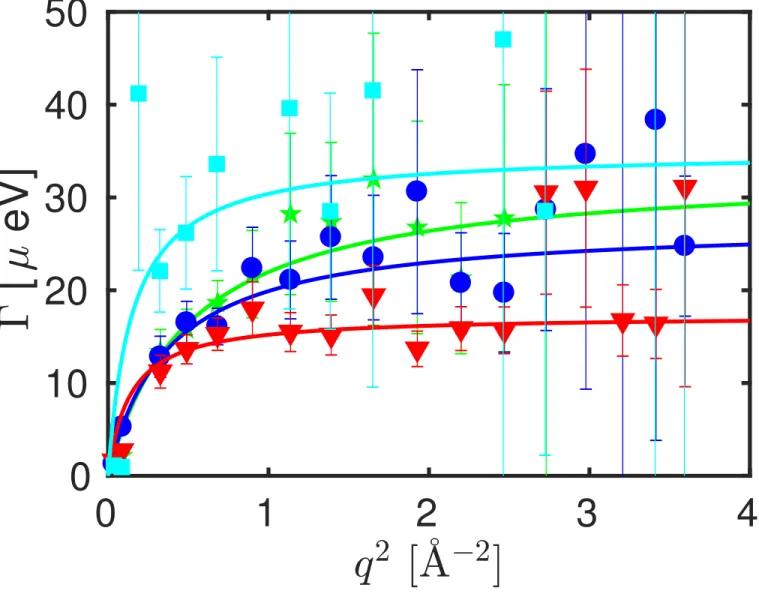
Figure 5: Fit results for the linewidth of the Lorentzian contribution Γ(q) associated with the internal molecular mobility of the proteins at T = 295 K and cp = 200mgml as a function of the scattering vector
q (equation 2), and fit of equation 3 (0.4 ˚A−2 < q2 < 3.3 ˚A−2) to these results (lines). Square symbols
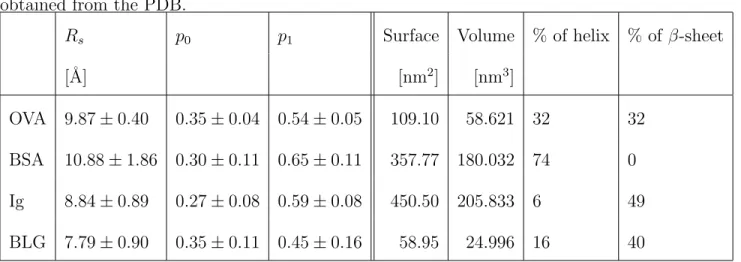
Table 2: Fit parameters for the EISF in Figure 4 and protein properties calculated with the 3V software55 (surface and volume) and percentage of amino-acids in helical structure and in β-sheet obtained from the PDB.
Rs p0 p1 Surface Volume % of helix % of β-sheet
[˚A] [nm2] [nm3]
OVA 9.87 ± 0.40 0.35 ± 0.04 0.54 ± 0.05 109.10 58.621 32 32 BSA 10.88 ± 1.86 0.30 ± 0.11 0.65 ± 0.11 357.77 180.032 74 0 Ig 8.84 ± 0.89 0.27 ± 0.08 0.59 ± 0.08 450.50 205.833 6 49 BLG 7.79 ± 0.90 0.35 ± 0.11 0.45 ± 0.16 58.95 24.996 16 40
at the lowest values for q which are measured with the lowest two detectors. For these two detectors, we may have systematic errors, because the overall linewidth is small and thus approaches the resolution. Therefore, the results depend sensitively on the model of the resolution function. In addition, the intensity at low q might be affected by coherent scattering.
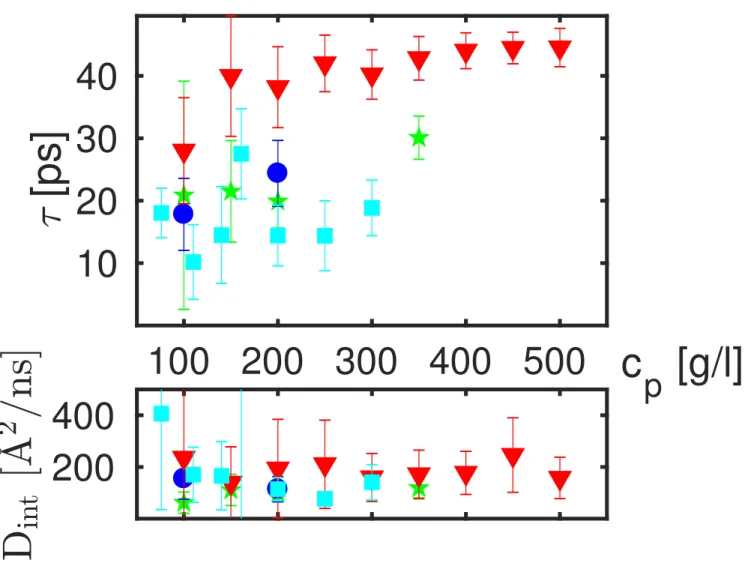
The values for the linewidth Γ(q) associated with the internal dynamics are shown in Figure 5 for exemplary data sets. We subsequently fit equation 3 to Γ(q). The resulting fit parameters Dint and τ for all data sets are summarized in Figure 6 for
different proteins with different concentrations measured at T = 295 K.
Overall, the present results show that different proteins are characterized by re-markably distinct internal fluctuations. We have therefore looked for systematic
200
400
100 200 300 400 500
c
p
[g/l]
10
20
30
40
[ps]
Figure 6: Top: Residence times at T = 295 K associated with the internal protein motions as a function of the protein concentration cp obtained from a fit of equation 3 to the widths Γ(q) (see
Figure 5) based on q-dependent fits. Square symbols denote BLG, triangle symbols Ig, circle symbols BSA, and star symbols OVA, respectively. Bottom: Internal diffusion coefficients obtained from the same fits.
correlations with properties of the proteins, namely the percentage of β-sheets or helices in the secondary structure of the protein, the protein surface and surface-to-volume ratio, as determined with the 3V software55, by using the PDB structures 1OVA Chain A43, 3V0356, 1IGT57 and 4Y0P58 for OVA, BSA, Ig and BLG, respec-tively. The corresponding values are also displayed in table 2.
We have not found a parameter that would link the results for all four investigated proteins in a monotonous way (see Figure S2), i.e. no obvious correlations were found.
4.3 Limitations of the current analysis and interpretation
We stress that all analysis presented in this work is subject to assumptions and modeling, and the interpretation of the results is subject to the validity of these assumptions, which we tentatively summarize here.
Regarding the analysis of the rotational and translational diffusion (subsection 4.1), we have used a colloidal hard-sphere model. In this context, the following issues have to be noted:
First, the excluded volume fraction ϕ by the proteins is calculated based on an effective sphere volume of compact clusters. In the case of less compact clusters, this assumption might not hold anymore, and a larger effective ϕ would be expected.
Second, the theoretical ϕ-dependence of the diffusion of the oligomers is calculated based on the assumption of non-charged colloidal spheres50,51. The validity of this approximation might break down in case of a strong interaction between the clusters, as well as for strongly non-spherical clusters. In fact, for attractive systems, a decay of D as a function of ϕ faster than expected for uncharged hard spheres has been observed15. Third, since our QENS experiment accesses an ensemble-average, the clusters may be subject to a size distribution with unknown dispersity, but an average size that increases with ϕ (as previously observed in lysozyme solutions7).
For a full picture regarding the cluster formation, both comprehensive SAXS data and neutron spin echo data recorded under the same sample conditions (i.e. at the same protein concentrations in D2O solutions without additional buffers) would be
required in addition to our neutron backscattering data28, ideally employing protein samples from the same production batch. In the absence of such comprehensive data, our interpretation of cluster formation may remain ambiguous.
Regarding the internal molecular diffusive motions we note: The possibility to observe the internal motions on IN16B is presently limited by the explored maxi-mum energy range |~ω| ≤ 30µeV. Moreover, the jump diffusion model, equation 3, for the internal diffusion obviously constitutes an approximation of more complex
motions16,20,54. More fundamentally, even the Lorentzian Γ(q) in equation 2 ac-counting for the internal motions in the fit constitutes an approximation only of a more complex scattering function. There is no strong physical but only a heuris-tic justification of the jump-diffusion model, because it reproduces the observed q-dependence of Γ(q) quite well. Nevertheless, the residence time τ showing the main differences could also be extracted by taking an average of the asymptotic val-ues at high q valval-ues. Furthermore, the energy-landscape of a protein contains many local minima which the hydrogens have to overcome to get to a new position. It is therefore reasonable to assume that the atoms stay at one position during the resi-dence time τ before performing a diffusive jump. For this reason, the jump diffusion model appears justified to some level. To identify the driving parameters leading to distinct dynamics in different proteins, backscattering spectrometers having a broader energy range but broader energy resolution may be employed in addition in further studies20,59,60. Moreover, the internal motions may in the future be further investigated by molecular dynamics simulations. A scattering function calculated from such simulation results would then replace Γ(q) in the fits.
5
Conclusions
The ensemble-averaged short-time protein center-of-mass self-diffusion in aqueous (D2O) ovalbumin solutions observed using neutron backscattering spectroscopy is
not consistent with the picture of rigidly bound ovalbumin tetramers over the entire range of protein concentrations explored. In contrast, both ovalbumin monomers and dimers may be present at low concentration. The results for the nominal protein concentrations of 100 and 150 mgml point to a suspension consisting predominantly of monomers and dimers, and solely of dimers at 200 mgml. At 350 mgml tetramers or even larger aggregates appear to prevail. However, the aggregation state of ovalbumin may depend sensitively on various environmental parameters and even the specific protein batch explored. We also point out that our aqueous sample solutions were based on D2O without any buffer, and results can differ if H2O61,62 or if an additional
buffer are used. Moreover, we used an effective hard sphere model to rescale the diffusion coefficients, obtained from the pdb structures in the dilute limit, to the desired volume fraction.
Our results illustrate the general possibility and describe the methodological framework, using QENS, to infer on the assembly size and in this way, more gener-ally, on solution structure properties. Since the scattering signal from the proteins
in our samples is mainly incoherent, we unambiguously detect the self-diffusion, or, synonymously, tracer diffusion of the protein N -mers, clusters, or aggregates inde-pendent from their size. Moreover, another advantage of incoherent QENS over complementary scattering methods consists in the linear dependence of the scat-tering signal on the size of the assemblies, aggregates, or clusters, i.e. the possible presence of large aggregates at a comparatively small partial number density in a dispersed suspension would not “cover up” the scattering signal from any possibly prevailing monomers.
We emphasize that our current work addresses and illustrates the methodology of neutron backscattering data analysis, and our resulting picture of the cluster for-mation in the ovalbumin protein solution system is based on the observed global diffusion. For a complete picture, a combination of other experimental techniques including small-angle scattering and neutron spin-echo spectroscopy is required in addition to neutron backscattering28, ideally complemented by simulations. Without such complementary information, ambiguities may remain regarding the interpreta-tion of the results.
We simultaneously obtain information on the internal molecular mobility of the investigated proteins. By comparing those of ovalbumin with the other model
pro-teins β-lactoglobulin, bovine serum albumin, and immunoglobulin, we observe clear differences, which do not correlate in an obvious manner with the structural prop-erties of the protein such as the percentage of β-sheet or helices or the surface-to-volume ratio. Further studies will be needed to better understand how internal motions on the subnanosecond timescale are tuned in different proteins.
Supporting Information
The Supporting Information contains the diffusion coefficients calculated for spheres with equivalent hydrodynamic radii compared with the ones calculated for the dif-ferent clusters and the averaged residence times as a function of the radii of gyration for different proteins. The neutron data are permanently curated by the ILL and accessible via http://dx.doi.org/10.5291/ILL-DATA.9-13-477 (OVA, Ig, and BSA), and http://dx.doi.org/10.5291/ILL-DATA.8-04-724 (BLG).
Acknowledgements
This work was supported in part by the DFG and the ANR (contract no. ANR-16-CE92-0009-01) and the Knut and Alice Wallenberg Foundation (project grant KAW 2014.0052). C. B. acknowledges support by a studentship co-funded by the ILL and
the University of T¨ubingen. We thank R. Ammer (ILL) for help during the IN16B experiment.
References
[1] Dinsmore, A.; Dubin, P.; Grason, G. Clustering in Complex Fluids J. Phys. Chem. B 2011 115, 7173–7174.
[2] Johnston, K.; Maynard, J.; Truskett, T.; Borwankar, A.; Miller, M.; Wilson, B.; Dinin, A.; Khan, T.; Kaczorowski, K. Concentrated Dispersions of Equilibrium Protein Nanoclusters That Reversibly Dissociate into Active Monomers ACS Nano 2012 6, 1357–1369.
[3] Yearley, E.; Godfrin, P.; Perevozchikova, T.; Zhang, H.; Falus, P.; Porcar, L.; Nagao, M.; Curtis, J.; Gawande, P.; Taing, R.; et al. Observation of Small Cluster Formation in Concentrated Monoclonal Antibody Solutions and Its Im-plications to Solution Viscosity Biophys. J. 2014 106, 1763 – 1770.
[4] Stradner, A.; Sedgwick, H.; Cardinaux, F.; Poon, W.; Egelhaaf, S.; Schurten-berger, P. Equilibrium Cluster Formation in Concentrated Protein Solutions and Colloids Nature 2004 432, 492–495.
P.; Liu, Y. Formation of the Dynamic Clusters in Concentrated Lysozyme Pro-tein Solutions J. Phys. Chem. Lett. 2010 1, 126–129.
[6] Liu, Y.; Porcar, L.; Chen, J.; Chen, W.-R.; Falus, P.; Faraone, A.; Fratini, E.; Hong, K.; Baglioni, P. Lysozyme Protein Solution with an Intermediate Range Order Structure J. Phys. Chem. B 2011 115, 7238–7247.
[7] Cardinaux, F.; Zaccarelli, E.; Stradner, A.; Bucciarelli, S.; Farago, B.; Egelhaaf, S. U.; Sciortino, F.; Schurtenberger, P. Cluster-Driven Dynamical Arrest in Concentrated Lysozyme Solutions J. Phys. Chem. B 2011 115, 7227–7237. [8] Okumura, H.; Higashi, M.; Yoshida, Y.; Sato, H.; Akiyama, R. Theoretical
Approaches for Dynamical Ordering of Biomolecular Systems Biochim. Biophys. Acta, Gen. Subj. 2018 1862, 212 – 228.
[9] Nawrocki, G.; Wang, P.-h.; Yu, I.; Sugita, Y.; Feig, M. Slow-Down in Diffusion in Crowded Protein Solutions Correlates with Transient Cluster Formation J. Phys. Chem. B 2017 121, 11072–11084.
[10] Benedek, G. B. Cataract as a Protein Condensation Disease: The Proctor Lec-ture. Invest. Ophthalmol. Visual Sci. 1997 38, 1911–1921.
[11] Galkin, O.; Chen, K.; Nagel, R. L.; Hirsch, R. E.; Vekilov, P. G. Liquid–Liquid Separation in Solutions of Normal and Sickle Cell Hemoglobin Proc. Natl. Acad.
Sci. U. S. A. 2002 99, 8479–8483.
[12] Ross, C.; Poirier, M. Protein Aggregation and Neurodegenerative Disease Nat. Med. (N.Y., NY, U.S.) 2004 10, S10–S17.
[13] Grimaldo, M.; Roosen-Runge, F.; Jalarvo, N.; Zamponi, M.; Zanini, F.; Hennig, M.; Zhang, F.; Schreiber, F.; Seydel, T. High-Resolution Neutron Spectroscopy on Protein Solution Samples EPJ Web Conf. 2015 83, 02005.
[14] Ellis, R. Macromolecular Crowding: An Important but Neglected Aspect of the Intracellular Environment Curr. Opin. Struct. Biol. 2001 11, 114–119.
[15] Bucciarelli, S.; Myung, J. S.; Farago, B.; Das, S.; Vliegenthart, G. A.; Holderer, O.; Winkler, R. G.; Schurtenberger, P.; Gompper, G.; Stradner, A. Dramatic Influence of Patchy Attractions on Short-Time Protein Diffusion under Crowded Conditions Sci. Adv. 2016 2, e1601432.
[16] Monkenbusch, M.; Stadler, A.; Biehl, R.; Ollivier, J.; Zamponi, M.; Richter, D. Fast Internal Dynamics in Alcohol Dehydrogenase J. Chem. Phys. 2015 143, 075101.
[17] Roosen-Runge, F.; Hennig, M.; Zhang, F.; Jacobs, R. M. J.; Sztucki, M.; Schober, H.; Seydel, T.; Schreiber, F. Protein Self-Diffusion in Crowded So-lutions Proc. Natl. Acad. Sci. U. S. A. 2011 108, 11815–11820.
[18] Grimaldo, M.; Roosen-Runge, F.; Zhang, F.; Seydel, T.; Schreiber, F. Diffusion and Dynamics of γ- Globulin in Crowded Aqueous Solutions J. Phys. Chem. B 2014 118, 7203–7209.
[19] Grimaldo, M.; Roosen-Runge, F.; Hennig, M.; Zanini, F.; Zhang, F.; Zamponi, M.; Jalarvo, N.; Schreiber, F.; Seydel, T. Salt-Induced Universal Slowing Down of the Short-Time Self-Diffusion of a Globular Protein in Aqueous Solution J. Phys. Chem. Lett. 2015 6, 2577–2582.
[20] Grimaldo, M.; Roosen-Runge, F.; Hennig, M.; Zanini, F.; Zhang, F.; Jalarvo, N.; Zamponi, M.; Schreiber, F.; Seydel, T. Hierarchical Molecular Dynamics of Bovine Serum Albumin in Concentrated Aqueous Solution Below and Above Thermal Denaturation Phys. Chem. Chem. Phys. 2015 17, 4645–4655.
[21] Hennig, M.; Roosen-Runge, F.; Zhang, F.; Zorn, S.; Skoda, M. W. A.; Jacobs, R. M. J.; Seydel, T.; Schreiber, F. Dynamics of Highly Concentrated Protein Solutions Around the Denaturing Transition Soft Matter 2012 8, 1628–1633. [22] Heinen, M.; Zanini, F.; Roosen-Runge, F.; Fedunova, D.; Zhang, F.; Hennig,
M.; Seydel, T.; Schweins, R.; Sztucki, M.; Antalik, M.; et al. Viscosity and Diffusion: Crowding and Salt Effects in Protein Solutions Soft Matter 2012 8, 1404–1419.
[23] Ameseder, F.; Radulescu, A.; Khaneft, M.; Lohstroh, W.; Stadler, A. M. Homo-geneous and HeteroHomo-geneous Dynamics in Native and Denatured Bovine Serum Albumin Phys. Chem. Chem. Phys. 2018 20, 5128–5139.
[24] Stadler, A. M.; Garvey, C. J.; Embs, J. P.; Koza, M. M.; Unruh, T.; Artmann, G.; Zaccai, G. Picosecond Dynamics in Haemoglobin from Different Species: A Quasielastic Neutron Scattering Study Biochim. Biophys. Acta, Gen. Subj. 2014 1840, 2989 – 2999.
[25] Anunciado, D.; Nyugen, V.; Hurst, G.; Doktycz, M.; Urban, V.; Langan, P.; Mamontov, E.; ONeill, H. In Vivo Protein Dynamics on the Nanometer Length Scale and Nanosecond Time Scale J. Phys. Chem. Lett. 2017 8, 1899–1904. [26] Tehei, M.; Franzetti, B.; Wood, K.; Gabel, F.; Fabiani, E.; Jasnin, M.; Zamponi,
M.; Oesterhelt, D.; Zaccai, G.; Ginzburg, M.; et al. Neutron Scattering Reveals Extremely Slow Cell Water in a Dead Sea Organism Proc. Natl. Acad. Sci. U.S.A. 2007 104, 766–771.
[27] Stadler, A. M.; Embs, J. P.; Digel, I.; Artmann, G. M.; Unruh, T.; B¨uldt, G.; Zaccai, G. Cytoplasmic Water and Hydration Layer Dynamics in Human Red Blood Cells J. Am. Chem. Soc. 2008 130, 16852–16853.
Sztucki, M.; Zhang, F.; Schreiber, F.; Seydel, T. Crowding-Controlled Cluster Size in Concentrated Aqueous Protein Solutions: Structure, Self-and Collective Diffusion J. Phys. Chem. Lett. 2017 8, 2590–2596.
[29] Matsarskaia, O.; Braun, M. K.; Roosen-Runge, F.; Wolf, M.; Zhang, F.; Roth, R.; Schreiber, F. Cation-Induced Hydration Effects Cause Lower Critical Solu-tion Temperature Behavior in Protein SoluSolu-tions J. Phys. Chem. B 2016 120, 7731–7736.
[30] Roosen-Runge, F.; Zhang, F.; Schreiber, F.; Roth, R. Ion-activated Attractive Patches as a Mechanism for Controlled Protein Interactions Sci. Rep. 2014 4, 7016.
[31] Stadler, A. M.; van Eijck, L.; Demmel, F.; Artmann, G. Macromolecular Dy-namics in Red Blood Cells Investigated Using Neutron Spectroscopy J. R. Soc., Interface 2011 8, 590–600.
[32] Doster, W.; Longeville, S. Microscopic Diffusion and Hydrodynamic Interac-tions of Hemoglobin in Red Blood Cells Biophys. J. 2007 93, 1360 – 1368. [33] B´ee, M. A Physical Insight into the Elastic Incoherent Structure Factor Phys.
B (Amsterdam, Neth.) 1992 182, 323–336.
Callow, S.; Pr´evost, S.; Schreiber, F. Protein-Protein Interactions in Ovalbumin Solutions Studied by Small-Angle Scattering: Effect of Ionic Strength and the Chemical Nature of Cations J. Phys. Chem. B 2010 114, 3776–3783.
[35] Scott, D.; Patel, T.; Besong, D.; Stetefeld, J.; Winzor, D. Examination of the Discrepancy between Size Estimates for Ovalbumin from Small-Angle X-ray Scattering and Other Physicochemical Measurements J. Phys. Chem. B 2011 115, 10725–10729.
[36] Dayhoff, M. O.; Perlmann, G. E.; MacInnes, D. A. The Partial Specific Volumes, in Aqueous Solution, of Three Proteins J. Am. Chem. Soc. 1952 74, 2515–2517. [37] Charlwood, P. A. Partial Specific Volumes of Proteins in Relation to
Composi-tion and Environment J. Am. Chem. Soc. 1957 79, 776–781.
[38] Zamyatnin, A. A. Protein Volume in Solution Prog. Biophys. Mol. Biol. 1972 24, 107–123.
[39] Frick, B.; Mamontov, E.; van Eijck, L.; Seydel, T. Recent Backscattering In-strument Developments at the ILL and SNS Z. Phys. Chem. (Muenchen, Ger.) 2010 224, 33–60.
[40] Hennig, M.; Frick, B.; Seydel, T. Optimum Velocity of a Phase-Space Trans-former for Cold-Neutron Backscattering Spectroscopy J. Appl. Crystallogr.
2011 44, 467–472.
[41] Singwi, K.; Sj¨olander, A. Diffusive Motions in Water and Cold Neutron Scat-tering Phys. Rev. 1960 119, 863–871.
[42] Fitter, J. Confined Molecular Motions of Globular Proteins Studied in Powder Samples and in Solution J. Phys. IV 2000 10, 265–270.
[43] Stein, P.; Leslie, A.; Finch, J.; Carrell, R. Crystal Structure of Uncleaved Oval-bumin at 1.95 ˚A Resolution J. Mol. Biol. 1991 221, 941–959.
[44] Ortega, A.; Amor´os, D.; de La Torre, J. Prediction of Hydrodynamic and Other Solution Properties of Rigid Proteins from Atomic- and Residue-Level Models Biophys. J. 2011 101, 892–898.
[45] Cho, C. H.; Urquidi, J.; Singh, S.; Robinson, G. W. Thermal Offset Viscosities of Liquid H2O, D2O, and T2O J. Phys. Chem. B 1999 103, 1991–1994.
[46] Berendsen, H.; van der Spoel, D.; van Drunen, R. GROMACS: A Message-Passing Parallel Molecular Dynamics Implementation Comp. Phys. Comm. 1995 91, 43–56.
[47] Svergun, D.; Richard, S.; Koch, M.; Sayers, Z.; Kuprin, S.; Zaccai, G. Pro-tein Hydration in Solution: Experimental Observation by X-ray and Neutron Scattering Proc. Natl. Acad. Sci. U.S.A. 1998 95, 2267–2272.
[48] Perticaroli, S.; Ehlers, G.; Stanley, C.; Mamontov, E.; ONeill, H.; Zhang, Q.; Cheng, X.; Myles, D.; Katsaras, J.; Nickels, J. Description of Hydration Water in Protein (Green Fluorescent Protein) Solution J. Am. Chem. Soc. 2017 139, 1098–1105.
[49] Nisbet, A. D.; Saundry, R. H.; Moir, A. J. G.; Fothergill, L. A.; Fothergill, J. E. The Complete Amino-Acid Sequence of Hen Ovalbumin Eur. J. Biochem. 1981 115, 335–345.
[50] Tokuyama, M.; Oppenheim, I. Dynamics of Hard-Sphere Suspensions Phys. Rev. E 1994 50, R16–R19.
[51] Banchio, A. J.; N¨agele, G. Short-Time Transport Properties in Dense Suspen-sions: From Neutral to Charge-Stabilized Colloidal Spheres J. Chem. Phys. 2008 128, 104903.
[52] Nemoto, N.; Koike, A.; Osaki, K.; Koseki, T.; Etsushiro, D. Dynamic Light Scattering of Aqueous Solutions of Linear Aggregates Induced by Thermal De-naturation of Ovalbumin Biopolymers 1993 33, 551–559.
[53] Weijers, M.; Visschers, R.; Nicolai, T. Light Scattering Study of Heat-Induced Aggregation and Gelation of Ovalbumin Macromolecules 2002 35, 4753–4762. [54] Roosen-Runge, F.; Bicout, D.; Barrat, J.-L. Analytical Correlation Functions
for Motion through Diffusivity Landscapes J. Chem. Phys. 2016 144, 204109. [55] Voss, N. R.; Gerstein, M. 3V: Cavity, Channel and Cleft Volume Calculator
and Extractor Nucleic Acids Res. 2010 38, W555–W562.
[56] Majorek, K. A.; Porebski, P. J.; Dayal, A.; Zimmerman, M. D.; Jablonska, K.; Stewart, A. J.; Chruszcz, M.; Minor, W. Structural and Immunologic Charac-terization of Bovine, Horse, and Rabbit Serum Albumins Mol. Immunol. 2012 52, 174 – 182.
[57] Harris, L. J.; Larson, S. B.; Hasel, K. W.; McPherson, A. Refined Structure of an Intact IgG2a Monoclonal Antibody, Biochemistry 1997 36, 1581–1597. [58] Loch, J. I.; Bonarek, P.; Polit, A.; Jaboski, M.; Czub, M.; Ye, X.; Lewiski, K.
β-Lactoglobulin Interactions with Local Anaesthetic Drugs Crystallographic and Calorimetric Studies Int. J. Biol. Macromol. 2015 80, 87 – 94.
[59] van Eijck, L.; G´erard, L.; Frick, B.; Seydel, T.; Schober, H. A Case Study for Using Neutron Backscattering Instruments at Reactors in Inverted Time-of-Flight Mode Nucl. Instrum. Methods Phys. Res., Sect. A 2012 672, 64–68. [60] Mamontov, E.; Herwig, K. W. A Time-of-Flight Backscattering Spectrometer
at the Spallation Neutron Source, BASIS Rev. Sci. Instrum. 2011 82, 085109. [61] Braun, M. K.; Wolf, M.; Matsarskaia, O.; Da Vela, S.; Roosen-Runge, F.;
Sz-tucki, M.; Roth, R.; Zhang, F.; Schreiber, F. Strong Isotope Effects on Effective Interactions and Phase Behavior in Protein Solutions in the Presence of Multi-valent Ions J. Phys. Chem. B 2017 121, 1731–1739.
[62] Bucciarelli, S.; Mahmoudi, N.; Casal-Dujat, L.; Jhannin, M.; Jud, C.; Stradner, A. Extended Law of Corresponding States Applied to Solvent Isotope Effect on a Globular Protein J. Phys. Chem. Lett. 2016 7, 1610–1615.
Supporting Information
Nanosecond Tracer Diffusion as a Probe of the Solution
Struc-ture and Molecular Mobility of Protein Assemblies: The Case
of Ovalbumin
Christian Becka,b, Marco Grimaldoa, Felix Roosen-Rungec, Michal K. Braunb, Fajun Zhangb, Frank Schreiberb and Tilo Seydela,∗
a Institut Max von Laue – Paul Langevin (ILL), B.P.156, F-38042 Grenoble, France.
b Institut f¨ur Angewandte Physik, Universit¨at T¨ubingen, Auf der Morgenstelle 10,
72076 T¨ubingen, Germany.
c Division of Physical Chemistry, Department of Chemistry, Lund University,
Naturve-tarv¨agen 16, SE-22100 Lund, Sweden.
∗ Corresponding author, e-mail: seydel@ill.eu
280 290 300 310 Temperature [K] 0 5 10 15 Monomer Dimer Tetramer (r) determined from pdb homogeneous sphere
Figure S1: Apparent diffusion coefficients Dapp in the dilute limit (cp → 0mgml) calculated using the
hydrogen distribution functions extracted from the pdb structure (open symbols) and the hydro-gen distribution function from a homohydro-geneous sphere (filled symbols). Triangles, stars and circles represent the diffusion coefficients of monomers, dimers and tetramers, respectively.
0
20
40
60
10
20
30
40
50
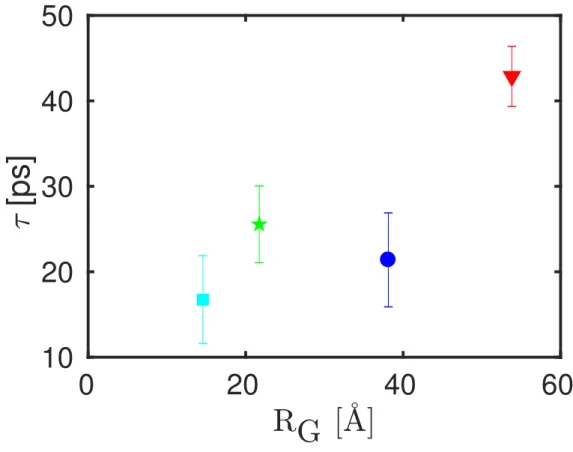
[ps]
Figure S2: Error-weighted average of the residence time τ (equation 3 in the main article) versus the radius of gyration RG. No obvious correlation between residence time and the radius can be seen.