https://doi.org/10.4224/12328582
READ THESE TERMS AND CONDITIONS CAREFULLY BEFORE USING THIS WEBSITE. https://nrc-publications.canada.ca/eng/copyright
Vous avez des questions? Nous pouvons vous aider. Pour communiquer directement avec un auteur, consultez la
première page de la revue dans laquelle son article a été publié afin de trouver ses coordonnées. Si vous n’arrivez pas à les repérer, communiquez avec nous à [email protected].
Questions? Contact the NRC Publications Archive team at
[email protected]. If you wish to email the authors directly, please see the first page of the publication for their contact information.
For the publisher’s version, please access the DOI link below./ Pour consulter la version de l’éditeur, utilisez le lien DOI ci-dessous.
Access and use of this website and the material on it are subject to the Terms and Conditions set forth at Stability of Grounded Spray Ice Structures
Barker, Anne; Timco, Garry
https://publications-cnrc.canada.ca/fra/droits
L’accès à ce site Web et l’utilisation de son contenu sont assujettis aux conditions présentées dans le site LISEZ CES CONDITIONS ATTENTIVEMENT AVANT D’UTILISER CE SITE WEB.
NRC Publications Record / Notice d'Archives des publications de CNRC:
https://nrc-publications.canada.ca/eng/view/object/?id=581fe7bb-8269-47ca-a148-e3c83e1121df https://publications-cnrc.canada.ca/fra/voir/objet/?id=581fe7bb-8269-47ca-a148-e3c83e1121df
SLIDING RESISTANCE OF GROUNDED SPRAY ICE
STRUCTURES
A. Barker and G.W. Timco Canadian Hydraulics Centre National Research Council of Canada
Ottawa, ON K1A 0R6 Canada
Prepared for:
Program of Energy Research and Development (PERD) And
Devon Canada Corporation
Technical Report CHC-TR-017
ABSTRACT
In the 1970’s and 1980’s, a number of grounded ice islands were used as drilling platforms in the Beaufort Sea. These islands were constructed by spraying sea water into the air to form ice, gradually building up a large platform area that eventually grounded on the seabed. One important factor in the feasibility of using ice in such a manner concerns the sliding resistance of the grounded spray ice. Reports and papers from ice islands, relief well ice pads and spray ice barriers were studied in detail. This study provides both qualitative and quantitative knowledge on the sliding resistance of grounded spray ice structures. It illustrates that these structures were very stable with respect to seabed sliding.
TABLE OF CONTENTS
ABSTRACT... I TABLE OF CONTENTS ... III LIST OF FIGURES ...V LIST OF TABLES...VII
1. INTRODUCTION ... 9
2. ISSUES AND UNCERTAINTIES ... 11
3. BASIC CONCEPTS ... 14
3.1 Global Failure ... 14
3.1.1 Failure along the Ice-Seabed Interface... 14
3.1.2 Failure through the Seabed ... 17
3.1.3 Failure through the Ice... 17
3.2 Local Failure ... 17
3.3 Method for Analysis ... 18
3.4 Sources of Information... 19
4. MARS ICE ISLAND ... 21
4.1 Construction Details... 21
4.2 Island Geometry and Performance Monitoring ... 21
4.3 Ice Island Stability... 23
5. ANGASAK ICE ISLAND... 24
5.1 Construction Details... 24
5.2 Island Geometry and Performance Monitoring ... 25
5.3 Ice Island Stability... 27
6. KARLUK ICE ISLAND... 28
6.1 Construction Details... 28
6.2 Island Geometry and Performance Monitoring ... 28
6.3 Ice Island Stability... 30
7. NIPTERK ICE ISLAND ... 31
7.1 Construction Details... 32
7.2 Island Geometry and Performance Monitoring ... 32
7.3 Ice Island Stability... 36
8. ALERK SPRAY ICE RELIEF WELL PAD ... 39
8.1 Construction Details... 39
8.2 Pad Geometry and Performance Monitoring ... 40
8.3 Ice Pad Stability ... 42
9. TARSIUT SPRAY ICE RELIEF WELL PAD... 43
9.1 Construction Details... 43
9.2 Pad Geometry and Performance Monitoring ... 44
9.3 Ice Pad Stability ... 47
10. KADLUK SPRAY ICE RELIEF WELL PAD ... 49
10.1 Construction Details... 49
10.2 Pad Geometry and Performance Monitoring ... 51
10.3 Ice Pad Stability ... 53
11.2 Single Steel Drilling Caisson (SSDC) – Uviluk Location ... 59
11.3 Single Steel Drilling Caisson (SSDC) – Kogyuk Location ... 60
12. FIELD STUDY OF SLIDING RESISTANCE... 67
12.1 Instruments and Measurements ... 68
12.2 Results... 70
13. ANALYSIS... 75
14. CONCLUSIONS ... 82
15. ACKNOWLEDGMENTS... 83
LIST OF FIGURES
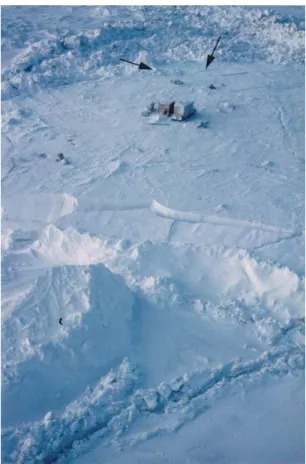
Figure 1: Photograph showing the Nipterk spray ice island. Note the high
freeboard of the island compared to the surrounding ice sheet. ...10
Figure 2: Illustration of the factors affecting the stability of ice pads ...11
Figure 3: Schematic illustration of an ice pad showing three possible modes of global failure. ...14
Figure 4: Schematic illustration showing the mechanism of global sliding along the seabed. ...15
Figure 5: Location of Mars Ice Island ...21
Figure 6: Schematic of Mars Ice Island (measurement in feet)...22
Figure 7: Photograph of Mars Ice Island ...22
Figure 8: Location of Angasak Ice Island ...24
Figure 9: Schematic of Angasak Ice Island ...26
Figure 10: Anagasak Ice Island geometry as of February 1, 1987...26
Figure 11: Angasak instrumentation locations ...27
Figure 12: Location of Karluk Ice Island...28
Figure 13: Karluk Ice Island geometry (distances in feet) ...29
Figure 14: Karluk instrumentation locations ...29
Figure 15: Karluk measured island movement...30
Figure 16: Location of Nipterk spray ice island ...31
Figure 17 Photograph of Nipterk spray ice island ...33
Figure 18: As-built contours of Nipterk ice island ...34
Figure 19: Location of monitoring instrumentation at Nipterk ice island. ...35
Figure 20: Measured horizontal island movement ...37
Figure 21: Manual inclinometer reading compared to in-place inclinometer reading...37
Figure 22: Measured movement at various instrumentation stations ...38
Figure 23: Plots of ice forces recorded by different ice load panels, the global ice force and the horizontal island movement for Nipterk ice island. ...38
Figure 24: Location of Alerk spray ice relief well ...39
Figure 25: Profile plot of Alerk ice pad ...40
Figure 26: Topographic plan of Alerk ice pad...40
Figure 27: Aerial photograph showing ice pad and instrumentation locations...41
Figure 28: Schematic of ice pad resistances at Alerk ...42
Figure 29: Location of the Tarsiut N-44 spray ice relief well pad (as well as other Gulf drill sites) ...43
Figure 30: Growth of ice at Tarsiut...44
Figure 31: Design and actual layout of Tarsiut relief well pad ...45
Figure 32: Ice thickness contours at Tarsiut relief well pad...45
Figure 33: Two views of the Tarsiut spray ice relief well pad ...46
Figure 34: Measured ice movement from survey pins at Tarsiut ...48
Figure 35: Location of Kadluk spray ice relief well ...49
Figure 36: Spraying ice at Kadluk ...50
Figure 38: Kadluk drill site and ice pad aerial photograph after ice event (pad
outlined in red) ...52
Figure 39: Location of instrumentation...52
Figure 40: Kadluk ice pad showing passive slope failures and rubble river after ice event ...54
Figure 41: Drawing showing the sheared edges of the Kadluk ice pad...55
Figure 42: Open water edge after March 11 retreat of landfast ice edge ...56
Figure 43: Plot of cumulative movement of stations at Kadluk ice pad ...56
Figure 44: Photograph of the CIDS and sketch of the Antares location ...58
Figure 45: Topography of ice rubble around the CIDS...58
Figure 46 Photograph of SSDC at Uviluk...59
Figure 47: Sketch of SSDC at Uviluk location, showing ice pad ...60
Figure 48: Two views of the SSDC at Kogyuk location – spray ice pad on right side of photos ...62
Figure 49: Bulldozing the ice pad...63
Figure 50: Spraying ice from the Kigoriak ...63
Figure 51: Kogyuk ice pad topography ...64
Figure 52: Plan view of ice pad geometry at Kogyuk ...65
Figure 53: Kogyuk plot of seasonal movement from one survey station ...65
Figure 54: Two photographs showing instrumentation hazards encountered at the Kogyuk drill site...66
Figure 55: Site map location for the Esso field program to measure sliding resistance ...67
Figure 56: Photograph showing the naturally-occurring grounded rubble at the site. The photograph was taken in mid-December 1990...68
Figure 57: Location of the on-ice instrumentation ...70
Figure 58: Plot of the major principal stress at the NRC south array (after Sayed, 1992) ...71
Figure 59: Plot of the major principal stress at the NRC north array (after Sayed, 1992) ...71
Figure 60: Grounding friction coefficient using upper bound values (after Sayed, 1992). ...72
Figure 61: Lower bound of the grounding resistance. (i.e., the difference between the south and north stresses) (after Sayed, 1992)...73
Figure 62: Grounding friction coefficient assuming all stresses are resisted by grounding (after Sayed, 1992). ...74
Figure 63: Movement of Nipterk ice island, showing movement variations with depth. Movement at the seabed is approximately 200 mm (from Poplin and Weaver, 1991). ...76
Figure 64 Vertical-to-horizontal ratios calculated for structures on sand seabeds ...80
Figure 65 Cohesive strength calculated for structures on clay seabeds ...80
Figure 66 Friction coefficients/vertical-to-horizontal ratio values plotted against the aspect ratio of each ice structure built on sand...81
Figure 67 Cohesive strength values plotted against the aspect ratio of each ice structure built on clay. ...81
LIST OF TABLES
Table 1: Factors Affecting the Uncertainty of the Stability of Ice Pads...11
Table 2: Details of the Instrumentation at the Test Site ...69
Table 3: Spray ice island properties and global load parameters...78
Table 4 Reported design values ...79
SLIDING RESISTANCE OF GROUNDED SPRAY ICE
STRUCTURES
1. INTRODUCTION
During the exploration drilling for oil and gas in the Canadian and US Beaufort Seas in the 1970s and 1980s, several different types of structures were used to support the drilling activities. These structures included artificial islands, floating drill ships, gravity caisson structures, and spray ice islands. Different structures were used depending upon the ice conditions and water depth.
Initially, in the shallow waters (up to 12 m), gravel islands were constructed. For most of these islands, the ice surrounding them was landfast, first-year ice and had little movement during the winter months. These islands were constructed by either dredging the local sea bottom and building-up an island, or by trucking gravel from the shore and dumping it to form an island. The cost of this type of construction was quite high. In the mid-1980s, new innovative technology was developed to use the ice itself as a drilling platform. For many years, ice has been used as a construction material to construct bridges, roads and aircraft runways, and it was used in the form of thickened ice platforms to support drilling activities in the high Arctic. The first spray ice structure to be constructed was the Sohio test island (Goff and Masterson, 1986). This structure was built as a grounded, sprayed test island. Later, four spray ice islands were successfully constructed and used as a drilling platform – two in the Canadian Beaufort Sea and two in the US Beaufort Sea. These islands were formed by spraying sea water into the cold air which would then form a spray ice. Continual spraying built up a large mass of this ice. Eventually, the ice is of sufficient thickness and weight that it grounds on the sea bottom. Further spraying yields a high-freeboard ice pad which is used to support the rig and the attendant equipment used for exploration drilling (Figure 1). The same process is used for smaller ice structures, such as relief well pads and barriers that protect a rig or similar structure.
One of the key factors for using this type of technology is the stability of the ice pad. There are two aspects to its stability. First, it is essential that the ice pad itself remain coherent during the drilling season. Several studies have been performed to measure the properties of spray ice (Weaver and McKeown, 1986; Spencer and Masterson, 1987). These studies generally show that the spray ice, if produced using specific techniques, is a consistent material for construction purposes. Second, it is also essential that the ice pad not move by any appreciable amount due to the loading by the surrounding ice sheet. That is, the ice pad should have sufficiently high sliding resistance to withstand the imposed ice loads. Very few studies have been performed to investigate the stability of this grounded ice.
Figure 1: Photograph showing the Nipterk spray ice island. Note the high freeboard of the island compared to the surrounding ice sheet.
In this report, a detailed study is made of the drilling activities in the Beaufort Sea to try to provide both qualitative and quantitative knowledge of the sliding resistance of grounded spray ice. This is done by reviewing the success of the spray ice structures (islands, relief well pads and barriers) that have been used in the Beaufort Sea. It is important to understand that the emphasis in this report relates directly to the sliding resistance and stability of the grounded spray ice. Although there are many other very important aspects about ice rubble such as its properties, its ability to transfer load to the seabed and attenuate loads on offshore structures, etc., these aspects are not examined in this report.
2. ISSUES AND UNCERTAINTIES
At first glance, the issue of the sliding resistance of a spray ice pad appears to be quite a simple problem. The design engineer must design the size and shape of the ice pad to resist the advancing ice sheet. The ice pad should remain stationary if the ice pad is large enough that its weight and friction with the seabed will overcome the environmental driving forces. There are, however, a large number of uncertainties faced by the design engineer and a number of issues that must be addressed. These are issues are summarized in Figure 2. and in Table 1, and are discussed in this section.
Vertical Load (creep of ice & seabed)
Relative amount above and below
waterline
Width of Spray Ice Pad: - large diameter has more
“catch” area for the load
Seabed material - cohesion, friction depth profiles, etc.
Nature of the interface: - smooth or interlocked - keel geometry Failure behaviour of advancing ice: - crushing, mixed mode, creep? Drainage Channels for unfrozen spray/brine: - lubrication at the interface?
Failure Behaviour of Rubble: - global or local? - rate dependent? Properties of Spray Ice:
- porosity, strength, rheology
Material Behaviour of Ice Rubble: - compressibility under load - cohesion, friction, porosity, strength - Temperature dependence (T = -2 C)? - freeze bonding - cohesive mass?
Seabed Original Rubble
Spray Ice
Figure 2: Illustration of the factors affecting the stability of ice pads Table 1: Factors Affecting the Uncertainty of the Stability of Ice Pads
Vertical Load Horizontal load Friction and cohesion/adhesion
Height of ice pad Environmental driving force Local/global failure of rubble
Diameter of ice pad Ice sheet thickness Seabed cohesion
Waterline location Ice velocity Seabed friction angle
Porosity of spray ice Failure mode at the edge of pad Nature of the ice/seabed interface Porosity of ice rubble Compressibility of ice rubble
Compressibility of ice rubble Ice rubble cohesion Drainage channels Ice rubble friction angle
Height of the Ice Pad - The relative amount of the ice pad above and below the waterline will influence the stability. The ice below the waterline will be buoyantly supported by the seawater and this will decrease (to a large extent) its contribution to the weight of the ice pad on the seabed.
Width of the Ice Pad - The lateral extent of the ice pad is important for several reasons. A large diameter pad will have more “catch” area for the load applied by the ice sheet. This suggests that the ice pad should be narrow and high (to get the necessary weight). However, this arrangement results in a high stress situation that has implications in terms of the creep of the ice pad in the vertical and horizontal directions. Further, although a narrow footprint might be acceptable for a frictional (sand) seabed, it could result in instabilities with a cohesive seabed.
Vertical Load – The ice pad will exert a vertical load both on the ice rubble (or level ice) below it and on the seabed. Both the ice rubble and sand are not rigid materials and they can creep (or, for the ice, crack) under a high vertical load. This is accelerated with increasing weight of the ice pad.
Properties of the Spray Ice – The spray ice is comprised of water, salt and air. Thus, it is a multifarious material that’s properties will be dramatically affected by the temperature. Changes in temperature will affect the porosity, strength and rheology (flow) of the ice. Further, although there have been some tests to measure its properties (Weaver and McKeown, 1986; Spencer and Masterson, 1987), there is little known about the properties of spray ice.
Failure Behaviour of the Ice Sheet – The manner in which the surrounding ice sheet fails when it interacts with the ice pad is extremely important. A recent analysis of ice loads on Beaufort Sea caisson structures has shown that ice loads can be four to five times higher if the ice fails in crushing rather than in bending. Thus, the ice pad should be designed such that a bending failure of the ice sheet would occur along the edge of the pad. Ensuring this will occur is far from certain and the higher loading situation must also be considered.
Failure Behaviour of the Ice Rubble – The mode in which the ice rubble would fail due to the ice loading is uncertain. The ice-pad/ice-rubble system could fail either through the ice, along the ice-seabed interface, or in the seabed. This will be discussed in more detail in Section 3. The failure mode of the rubble could be either as a series of smaller, local failures, or as larger global failure, or a combination of both.
Material Behaviour of the Ice Rubble – Ice pads are often built up on an existing rubble field. This is done since this ice is thicker than a level ice sheet, and its “rough” bottom can better dig into the seabed. There is, however, very little known about the material properties of ice rubble. Understanding the properties is important since the ice rubble forms the basic support system for the ice pad. Uncertainties exist about the compressibility of the rubble under load. Further, although there have been a number of studies examining the behaviour of ice rubble, these have mostly been in small laboratory settings (see e.g. Ettema and
Urroz-Aguirre, 1989 and 1991; Cornett and Timco, 1996). Some larger-scale field studies have been done (Croasdale and Associates Ltd., 1995 and 1996; Smirnov et al., 1999) but these have not examined rubble under load. Critical information on the cohesion, friction, porosity and strength of the rubble is not known. Further, the influence of the higher (-2°C) temperatures below water is not known. At these high temperatures, the ice is essentially at its melting point. Finally, the influence of the high vertical stress on potential cohesive (freeze) bonding of the ice blocks in the rubble is not known.
Drainage Channels – Since the ice rubble and portions of the ice pad (especially below the waterline) are near their melting point, the ice will have high porosity. This can lead to brine drainage channels. These channels can weaken the ice (since the channels themselves are liquid and have no strength). Further, they can transport high salt content brine down to the base of the ice. This could result in a “lubrication” of the ice-seabed interface.
Nature of the Ice Interface – Since the stability of the ice pad can be directly influenced by the friction of the ice along the seabed, the nature of the ice interface is important. Building an ice pad on a level ice sheet will depress the ice below the water to the seabed and result in a relatively smooth interface. On the other hand, building on a rubble field has the potential of have a rough interface that should lock in better with the seabed.
Seabed Material – Tests of the seabed material are usually carried out at the location of the ice pad. Details of the cohesion, friction, depth profiles, etc, are extremely important in the design of the ice pad.
All of the factors discussed above must be considered in the design of an ice pad system. With this large number of uncertainties, an ice pad cannot be designed in the traditional manner of designing a structure or building. The first pads were developed conceptually and field trials were performed to test the concept (Goff and Masterson, 1986; Jahns and Petrie, 1986). The subsequent ice pads were built using information gained from each previous ice pad. Experience is essential in the overall design of an ice pad.
3. BASIC CONCEPTS
Before examining the Beaufort Sea structures, it is important to identify and define the key parameters for the sliding resistance of the ice rubble. In this section, the basic concepts related to the stability of the ice pad are discussed. Two primary failure modes exist: global and local failure.
3.1 Global Failure
The simplest concept for the sliding of the ice pad is to assume that the ice pad fails globally and is pushed off site by the advancing ice sheet. As shown in Figure 1, there are three different potential ways for this to occur:
1. Failure along the ice-seabed interface 2. Failure through the seabed.
3. Failure in the ice
Driving Force
Failure through the Ice
Failure through the Seabed
Failure along the Ice-Seabed Interface
Figure 3: Schematic illustration of an ice pad showing three possible modes of global failure.
Each of these failure modes will be discussed in the following sections. 3.1.1 Failure along the Ice-Seabed Interface
The ice island is considered to be essentially a deformable body. For this type of failure, a global failure mechanism is usually assumed. The movement may further be considered to occur in two stages, where stress deformation occurs with the commencement of the driving force, followed by the initiation of sliding movement along the seabed (see Figure 4). It may be possible to differentiate between the two types of movement, where the former occurs primarily in the surface of the spray ice, by examining detailed movement records, where available. Where such records are not available, and it is unclear if sliding occurred along the seabed, movement is assumed to be purely stress deformation (that is, no failure along or through the seabed, nor through the ice).
B) Stress deformation A) Original form C) Initiation of sliding Driving Force
Horizontal Sliding Resistance Weight of Ice on
Seabed
Figure 4: Schematic illustration showing the mechanism of global sliding along the seabed.
For global failure, the horizontal sliding resistance, FH, is related to the normal
force, N, (i.e the weight of the ice) on the sea bottom by [1] FH = Ac+Ntanβ
where A is the horizontal surface area of the structure, c is a constant and β is a friction angle. Weaver and Poplin (1991) used a similar formula, and indicated that c may be considered as an adhesion factor. Equation 1 is analogous to the expression of shear resistance along a plane within soils. In that case, c and β become the cohesion and angle of internal friction of the soil, respectively. It should be emphasized that in the present work, it is assumed that slip could take place at the interface between the ice and the soil or through the seabed. Therefore the friction parameters, c and β, are necessarily equal to the above mentioned soil parameters. The cohesion and angle of internal friction of the soil give upper bounds for the values of c and β. The horizontal sliding resistance must be higher than the ice driving force or the ice pad will move.
The mechanics of sliding and friction resistance at the interface is not as well understood as the failure of soils. It is possible, however, to consider two extreme cases that are analogous to soil failure. In the one case, the shear resistance is linearly proportional to the normal force, and Equation 1 would be reduced to [2] FH = Ntanβ = fN
where f is a friction coefficient. This case is similar to failure in sand. The stability is directly related to the weight of the ice island. In the other case, shear resistance would have a constant value, independent of the normal force, as
[3] FH = Ac
This case corresponds to failure of clay. Note that in this case, the stability is not directly related to the weight of the island, but is dictated by the area of the ice island. In this report, the stability of the ice islands will be examined in terms of these two extreme cases. To do the analysis, information on the horizontal
driving force, the normal force (weight of the ice island for Equation 2) and the area of the ice island (for Equation 3) is required in order to solve for β or c. The normal force on the sea bottom is a function of the ice thickness and aerial extent, ice density and water depth. Stevens et al. (1984) derived the following equation to calculate the normal force for an ice pad constructed using spray ice on top off previously grounded ice rubble:
[4] NR i g r Zr d ) Zs s g]A 0 . 9 ( ) 1 ( [ρ −δ − + ρ = where NR = normal force (N)
ρi = density of ice either in rubble blocks or in spray ice granules (kg/m3)
δr = ice rubble porosity
Zr = rubble freeboard (m)
d = water depth (m)
Zs = sprayed ice thickness (m)
ρs = bulk average density of spray ice above water (kg/m3)
A = surface area (m2)
If the ice pad is circular, by combining Equations [2] and [4], the total sliding resistance for an ice pad consisting of both rubble ice and spray ice (i.e. FHR,s) is
[5] ρ δ ρ π tanβ 4 ] ) 0 . 9 ( ) 1 ( [ 2 , D g Z d Z g FHRs = i − r r − + s s
If the ice pad is not constructed on grounded ice rubble, but is made using only spray ice, the normal force is given by:
[6] Ns =[(1−es)(ρi −ρw)d g +ρs Zs g]A
where
Ns = normal force due to spray ice
ρw = water density
es = sprayed ice void ratio
If the ice pad is circular, by combining Equations [2] and [6], the total sliding resistance for an ice pad consisting of spray ice (i.e. F ) is Hs
[7] ρ ρ ρ π tanβ 4 ] ) ( ) 1 [( e d g Z g D2 FHs = − s i − w + s s
where
D = ice pad diameter (m)
These equations can be used to predict the size of the ice pad that would be required to resist the applied ice force. Estimates of most of these parameters can be made by measurement of the ice properties. However, the main uncertainty is the friction angle between the ice and the seabed. The determination of this parameter for the given failure mode is the sole focus of this report.
3.1.2 Failure through the Seabed
The ice pad could move if the seabed under it shears due to the applied ice load that is transmitted to it through the ice pad. The sliding resistive force (Fseabed)
would be a function of the shear strength (τseabed) of the seabed. For a global
failure of the seabed under an ice pad, the sliding resistance would be
[8] . 4 2 seabed seabed D F =π τ
For the Beaufort Sea, measurement of the undrained shear strength (τclay) of the
sea bottom clay yielded values of 25 kPa (Stevens et al., 1984), for example. Note that this also corresponds to Equation [3].
3.1.3 Failure through the Ice
Global failure of the ice is another mode in which the ice pad could move due to the applied ice load. Determining the global resistance for this mode is not straightforward. Past attempts to estimate this have used a Mohr-Coulomb representation for the ice. This assumes that the ice has both frictional and cohesive properties. Unfortunately, very little is known about the properties of ice rubble and spray ice. Most approaches to understand the failure of ice rubble have been based on adaptations of soil mechanics models. However these have not proved to be reliable. More recently, numerical methods have been employed and this provides a more realistic approach. However, this is a complicated issue and is beyond the scope of the present report. Further work in this area would benefit an understanding of the behaviour of ice rubble.
3.2 Local Failure
The work that has been done in analyzing the behaviour of ice pads in the Beaufort Sea has treated the issue of sliding resistance in terms of global failure. There is recognition of the fact that the ice pad may fail progressively in a series of local ice failures but this is not dealt with in any detail. Since the present report is meant to summarize the previous work, the issue of local failure of either the ice or the soil will not be addressed. However, it should be kept in mind that the
failure process can occur as a series of smaller failures and not as a single global failure. The present report will extract any relevant information in this area to better understand the failure (sliding) process.
3.3 Method for Analysis
This report focused on determining the friction coefficient between ice and seabed materials, in terms of analyzing global failure along the ice-seabed interface (section 3.1.1). However, analysis of the field data to determine the sliding resistance friction coefficient is not straightforward. There are many unknowns and uncertainties that hinder the interpretation and limit the accuracy of the results. Nevertheless, field data can provide important information. In this report, the field observations are analyzed to determine a lower bound for the friction angle. This is done in a systematic manner as follows:
1. Calculate the normal force (i.e. weight of the ice on the seabed) for the ice pad using either Equation [4] or [6]. The values that are used for the parameters in the equations (i.e. porosity, density, etc.) are taken from the original source whenever possible. If a value is not known, the assumed value is noted.
2. Determine the driving force on the ice pad. Recently, Timco and Johnston (2004) have analyzed the global loads on all of the caisson structures that were used in the Beaufort Sea. They found that the load was a function of the ice thickness, ice macrostructure and the failure mode of the ice. They produced a predictive equation for the average global load as
[7] FH =Tfm wh
where the FH is the driving force (global load) (in MN) on the structure, w is
the width of the structure and h is the ice thickness. Tfm is a failure-mode
parameter with the following values: Tfm = 1.09 MN/m2 for ice crushing
Tfm = 0.83 MN/m2 for long-term creep (i.e. thermally-induced creep)
Tfm = 0.63 MN/m2 for mixed-mode failure
Tfm = 0.18 MN/m2 for bending failures.
In the present case, the ice pads were usually surrounded by landfast ice, long-term creep loads would predominate so a value of 0.83 MN/m2 was used for the failure mode parameter in Equation [7]1.
1
Sanderson (1984) discusses the situation of thermal ice loads on a wide isolated structure in the offshore region. Based on a number of reasonable assumptions, he estimated a typical Line Load of 2 MN/m on a wide structure due to thermal origin. This value is relatively independent of ice thickness over the range of 0.5 m to 2 m. In the present analysis, the loads are calculated using Equation [7] with the design ice thickness, which was typically 2 m. Using this value, Equation [7] would predict a Line Load of 1.66 MN/m of ice pad width. Thus, there is reasonable agreement
3. Calculate the friction coefficient or cohesive strength using Equation [2] or [3] with the Normal force and the ice driving force on the ice pad. If the ice pad did not move on a sand seabed, the sliding resistance was higher than the ice driving force and the calculated ratio vertical-to-horizontal force was assumed to be a lower bound for this situation. If the ice pad did move, the friction coefficient was calculated and was assumed to be an upper bound value. The same idea is applicable to the cohesive strength of a clay seabed.
This method was applied to all available data sources to determine the range of vertical-to-horizontal force ration and cohesive strength values for the Beaufort Sea region.
3.4 Sources of Information
The Canadian Hydraulics Centre (CHC) of the National Research Council of Canada (NRCC) has obtained a large number of the reports, videos and data related to ice forces and ice properties that were collected during the exploration activities in the Beaufort Sea in the 1970s and 1980s. When the Beaufort Sea activity declined in the early 1990s, the Oil Industry redirected its interests to other regions. Since there was a fear that the information and knowledge of the ice loads might be lost, the National Research Council in Ottawa approached the Oil Industry to gain access to, archive, and use this information. The Industry was very responsive to this request and the NRC set-up a Centre of Ice Loads on Structures (Timco 1996, 1998). The Program on Energy Research and Development (PERD) provided funding for this project. The NRC obtained reports, data, and videos from Gulf Canada Resources Ltd., Imperial Esso, and Dome Petroleum (Canmar). At the present time, there are over 2000 reports, 300 films and videos, and original data from the Molikpaq and the Single Steel Drilling Caisson (SSDC). The NRC actively uses this information to better understand ice loads on offshore structures.
For the present work on sliding resistance, the information at NRC was examined to try to extract any information that could provide insight into the sliding resistance of ice pads and ice rubble. The search yielded a considerable amount of potentially useful information. This report focuses on the information obtained from the ice pads that have been constructed as follows:
Section 4 discusses the Mars ice pad that was constructed in 1985/86 in the Alaskan Beaufort Sea. Section 5 provides some details of the Angasak L-03 ice pad that was constructed in the Canadian Beaufort Sea in 1987/88. Section 6 reviews the Karluk ice pad that was constructed in 1988/89 in the Alaskan between these approaches with Sanderson’s theoretical values approximately 20% higher than the measured values of Equation [7].
Beaufort Sea. Section 7 discusses the Nipterk P-32 ice pad that was constructed in 1988/89 in the Canadian Beaufort Sea. The following three sections (8 through 10) discuss spray ice well relief pads. Spray ice barriers are examined in Section 11. Section 12 looks at a field study of sliding resistance. Finally, the sliding resistance of all of these ice structures are studied in Section 13.
It should be mentioned at the outset that this was a testing exercise. Although the concepts used here are quite simple and straightforward, the necessary information to do a complete analysis was rarely available. The as-built islands were, understandably, never the same as the design parameters of the islands. Critical information on the actual ice loads, island movement at the seabed, etc. were not available. Therefore, the present analysis should be viewed with caution. A number of assumptions were necessarily made in order to do the simple analysis outlined above. The values determined here should not be used as design values for an ice island. However, the information can be used as input into the island design and the required factors of safety. Additionally, the report provides an extensive overview of all grounded spray ice structures (with available information) that have been in use in the Beaufort Sea up until 2003.
4. MARS ICE ISLAND
The Mars ice island was the first use of grounded spray ice as a drilling platform. It was constructed in western Harrison Bay in Alaska in early 1986 (Figure 5). Amoco was the operator of the well. The information on the Mars island was found in Funegard et al. (1987).
Figure 5: Location of Mars Ice Island
4.1 Construction Details
A base camp with an airstrip was constructed at Cape Halkett on a dry lake bed by flooding it with fresh water and allowing it to freeze. The airstrip was large enough for a Hercules aircraft. The seabed was clay with an undrained shear strength of 48 kPa (Masterson, personal communication). The water depth was approximately 8 m.
The pumping equipment was brought up on a Hercules aircraft. It consisted of pumping system with a 19 m³/min capacity. The as-built weight of the units exceeded 36 tonnes. Vertical shaft driven centrifugal pumps were used, driven by 800 HP diesel engines through a right angle gear. A conventional fire water monitor was used to direct the spray for azimuth and elevation control. Four pump units were used during the construction. The total logged pumping hours for the construction was 892 hours and 1 006 810 m³ of water were pumped over a 46 day period. Minor cracking of the ice was observed during construction. However this was easily repaired by filling in with new wet spray ice.
4.2 Island Geometry and Performance Monitoring
The original design of the island was for a 122 m diameter drill rig area at an elevation of +6 m, surrounded by a 30 m-wide berm at an elevation of +14 m. During the early construction phase the design changed to a uniformly thick region at an elevation of +8 m over the same footprint area. This change in design resulted from the inability to direct the water flow in a consistent manner, primarily due to the high winds. Figure 6 shows the details of the island layout,
and Figure 7 is a photograph of the ice island. The island was roughly circular with a drill pad area of 215 m diameter and waterline diameter of 290 m.
Figure 6: Schematic of Mars Ice Island (measurement in feet)
The performance of the island was monitored through a comprehensive instrumentation program with sensors installed in and around the island to monitor:
• Natural ice movement
• Magnitude and direction of ice pressure
• Lateral deformation and/or movement of the ice island • Settlement of the ice island
• Settlement of the drill rig • Temperature in the spray ice
• Temperatures in and around the well bore • Meteorological data
The monitoring of movement was done in a real time environment to provide immediate warning if the stability of the island was threatened. There were, however, no events that necessitated restriction of any activities. Details of the results of the monitoring are confidential and are not publicly available.
4.3 Ice Island Stability
Funegard et al (1987) indicated that there were no large scale movements of the ice island during its use as a drilling platform. They did not provide details of the local ice conditions so it was only possible to calculate a quantitative estimate of the grounding stability of this ice pad.
5. ANGASAK ICE ISLAND
The Angasak spray ice island was located in the Canadian Beaufort Sea near Cape Dalhousie (Figure 8) and it was constructed in 1986. Esso Resources Canada Limited was the operator of the well. Information for the Angasak ice island was found in Weaver and Gregor (1988), Weaver (1987), Golder (1986) and Weaver and Foster (1986).
Figure 8: Location of Angasak Ice Island
5.1 Construction Details
Angasak spray ice island was constructed in approximately 5.5 m of water, approximately 1 km from shore. The seabed consisted of a silty sand, with an internal angle of friction of 30° and a shearing resistance of 18 kPa at the island-seabed interface.
Four pumps were used to build up the ice, with an average build-up rate of 0.21 m/day. Two of the pumps were modified marine firefighting centrifugal pumps, which were capable of 8 m³/min. The other two were built specifically for spray ice operations, centrifugal pumps rated at 11 m³/min. Due to unusually warm weather during the construction period, the planned lift size was reduced as was the spraying time. As a result of the warmer weather, the spray ice density was higher, creating a stronger spray ice than would have been produced in colder weather. In total, 398 000 m³ of water was pumped. No tension cracks were observed during construction within the core diameter (135 m), although cracks did form on the underside of the spray ice mound prior to grounding, then on the upper surface of the island during and immediately after grounding. However these cracks would have been covered by the island freeboard. The length of time to construct the island had been estimated to take 30 days at 40 m³/min, with a 30-day contingency. Due to the warmer weather, the island was constructed over a period of 58 days.
5.2 Island Geometry and Performance Monitoring
Design yield strengths for the Angasak spray ice island were chosen as 0.7 times the vertical effective pressure for the horizontal shear plane and 180 kPa for inclined shear planes above sea level. Horizontal elastic and creep deformation of the island were not included in the design ice load, as they were deemed to be insignificant. The island diameter required for drilling was 135 m, but the design grounded diameter was 190 m, which was determined based upon seabed sliding failure load. The final grounded diameter was 203 m. The top of island diameter was 157 m, while the waterline diameter was 214 m. The freeboard was 6.1 m. The landfast ice thickness (in February) was assumed to be 1.2 m, while the projected design ice thickness for the beginning of May was 2.0 m. The design and the as-built geometry of the island are shown in Figure 9 and Figure 10.
The performance monitoring program at Angasak involved collecting data on landfast ice movements and forces, horizontal movement of the island at the surface and subsurface, settlement of the island, spray ice temperatures beneath the substructure and meteorological conditions. In terms of instrumentation for monitoring horizontal island movement, three slope indicators, three in-place inclinometers and trigonometric surveys were used (Figure 11). The slope indicators were to be read once a week, the inclinometer data were recorded automatically twice per minute and the surveys were to be done once per month. The data was collected in real time in order to evaluate island stability as part of an alert program.
Figure 9: Schematic of Angasak Ice Island
Figure 11: Angasak instrumentation locations
5.3 Ice Island Stability
The designers determined that the critical horizontal shear failure mode was sliding of the island at the seabed, where the seabed shear strength was estimated at 15 kPa (the actual value was determined to be 18 kPa). A factor of safety of 1.5 and a maximum ice load of 1.5 MN/m were the minimum requirements for this failure mode. However, the maximum observed ice load was less than 0.2 MN/m. The design normal force for the Angasak spray ice island was 912 MN, with a design global load of 300 MN. From this, the design value of 526 MN was obtained for sliding resistance. The minimum spray ice strength appeared to be greater than 23 kPa. Global shear failures in the order of 0.15 m were determined to be unacceptable. No horizontal movement was mentioned in the reports or papers - total lateral movement of the rig was not to exceed 0.2 m.
6. KARLUK ICE ISLAND
Karluk Ice Island, located in the American Beaufort Sea near Prudhoe Bay, Alaska, was constructed in 1988 (Figure 12). The well operator was Chevron U.S.A. Inc., with Mobil Exploration & Producing U.S. Inc. as a joint venture partner. Details for the Karluk ice island may be found in Bungo et al. (1990).
Figure 12: Location of Karluk Ice Island
6.1 Construction Details
The seabed where the island was constructed was a silty sand, with a minimum friction angle of 36°. The island was located in approximately 7.3 m of water. An ice road, 20 km long and 1.82 m thick, was constructed in order to access the island during construction and drilling. Construction of the ice road began on December 1, 1988, while construction of the ice island began on December 13, 1988 and was completed on January 20, 1989 (39 days).
Ice was applied using four pumps. The pump units each had a 20 m³/min capacity. Two of the units had vertical turbine pumps, each weighing 37 tonnes, and two had centrifugal pumps, weighing 19.5 tonnes. The average rate of spray ice application was 0.9 m/day once the island had grounded. Approximately 613 hours of spraying were required to achieve the required volume of ice.
6.2 Island Geometry and Performance Monitoring
The design dimensions for the island were for an average core thickness of 14 m, total ice volume of 617 000 m³ and a diameter of 270 m. The freeboard of the island was approximately 6.7 m. The final ice volume of the island was
approximately 697 000 m³, while the average core thickness was 14.3 m. Figure 13 shows the geometry of the island.
During drilling, horizontal and vertical ice movement, ice temperature and meteorological conditions were monitored. Five in-place inclinometers at three locations and six manual inclinometer stations were used to monitor horizontal movement of the island. The system was set up to warn of horizontal movement that was outside of design limit parameters (Figure 14).
Figure 13: Karluk Ice Island geometry (distances in feet)
6.3 Ice Island Stability
The maximum horizontal design load for the Karluk ice island was 367 MN, with a load factor of 1.5 for lateral stability. This load is for a return period of 20 years. The load factor for the self-weight of the island was 0.9, used to assess the lateral stability of the island. The critical failure plane was deemed to be through the seabed. The spray ice density requirements were 641 kg/m³ above water, and 1030 kg/m³ below water. The average measured density after construction was completed was 614 kg/m³. The shear strength of the spray ice above water was considered to be cohesive, while the shear strength below the water was considered to be Mohr-Coulomb in nature. The design strength above water was 146 kPa and for the spray ice below water, c = 19.2 kPa and phi = 30°. The shear ice below the water line was assumed to have a shear strength in excess of 40 kPa. Cone penetrometer tests indicated that the spray ice was continuous throughout the island depth and that any weaker layers were discontinuous and prevented the formation of a shear plane through the ice. It was estimated that 100% of the island was grounded.
The in-place inclinometers measured maximum movements of 17.5 mm, 52.5 mm and 57.5 mm (Figure 15). These movements occurred radially, moving away from the island centre. This type of movement was attributed to settlement of the island under self-weight. It was concluded that movement was not excessive.
Figure 15: Karluk measured island movement
7. NIPTERK ICE ISLAND
Nipterk spray ice island was constructed in the Canadian Beaufort Sea in 1988 (Figure 16). The well operator was Esso Resources Canada Limited, in partnership with Chevron Canada, Petro Canada, Home Oil, AT&S and Gulf Canada. Details for the Nipterk Ice Island were pulled from Poplin and Weaver (1991); Weaver et al. (1991); Poplin (1989); and Weaver (1988).
7.1 Construction Details
The Nipterk spray ice island was located near the Mackenzie River delta, approximately 6 km from Pelly Island. This location was more exposed that either the Mars or Angasak ice islands, the seabed soils were weaker and as a result of its proximity to the Mackenzie River delta, the water was less saline (and warmer). The island was located in approximately 6.5 m of water. The water column, in mid-November, 1988, was freshwater to a depth of 4 m below the water surface, and 15 ppt saline water below that. The seabed was a stiff overconsolidated silt, with a thin overlayer of very soft silty clay. The average minimum soil strength was 12 kPa and the soil had a friction angle of 30°. The construction equipment was transported by a 10 km floating ice road between the drill site and Pelly Island. Construction began on November 28, 1988, and was completed on January 20, 1989 (53 days).
Four pumps were used to create the spray ice at Nipterk. Each pump had a 12 m³/min capacity. Spray monitors with several nozzle configurations were used, depending on wind speed and air temperature. Layers were applied in thicknesses ranging from 1.0 m to 3.0 m. The island grounded unevenly, due to the roughness of the first year ice sheet. Cracks that formed as a result of this were filled with reworked spray ice.
7.2 Island Geometry and Performance Monitoring
The average freeboard over the working surface of the island was 4.15 m, with an average freeboard of 3.73 m elsewhere. The final spray ice volume was approximately 825 000 m³. The design island diameter was 320 m, while the working surface diameter was 150 m (Figure 18). A photograph of the island is shown in Figure 17. A back-calculated value of soil shear strength for the soft layer of soil beneath the island was calculated as approximately 6 kPa for the major movement events, with mobilized seabed resistances of 70*ultimate seabed shear strength (in MN). This calculation was based on a 9 mm displacement required to induce failure of the seabed material, and was much lower than the design value of 11 kPa. The average seabed bearing pressure was estimated at 18 kPa, with a normalized resistance of 0.3.
Ice force, level ice movement rate and ice thickness data were collected throughout a performance monitoring program. Additionally, rig floor, spray ice and rig mat temperatures, settlement changes, air temperature, wind speed and direction were monitored. Three in-place inclinometers and five manual inclinometers were used to monitor horizontal movement of the ice island. The in-place inclinometers collected data at 30 s intervals, and averaged over three hour intervals. Geometric corrections were applied to the data, to change them from angular readings to linear displacements. The manual inclinometers were used approximately once a week to collect data for redundancy purposes. These manual readings were taken from January until July, where the island
broke up. All data was collected in real time. The location of the monitoring instrumentation is shown in Figure 19.
7.3 Ice Island Stability
The designers determined that the critical failure plane was along the spray ice-seabed interface. The average density in the ice island freeboard was 580 kg/m³. The surrounding consolidated level ice thickness was approximately 1.3 m on January 20. The design ice thickness, for May 1, was 2.0 m. The design ice load was calculated to be 599 MN and the design sliding resistance was 965 MN. The maximum observed global load was 360 MN. It was noted that the largest loads may have occurred prior to the installation of the data acquisition system in February, however. There was no significant horizontal movement during the early stages of the monitoring period, with a maximum displacement of 12.5 mm. From day 86 to day 110, significant movements were detected, with a maximum amount of movement of 25 mm within the working surface perimeter, along the seabed. An example of the movement recorded is shown in Figure 20. Along the island edge, significantly higher horizontal movement occurred; over 100 mm of movement was detected. This was still within the design limit of 150 mm. However, 250 mm of cumulative movement was recorded at the SSW recording station by the end of the drilling program in April. The predominant direction of movement was north-south. The major ice loading events were considered to be thermal events. For Nipterk, the report by Poplin and Weaver (1991) provides plots that detail the data obtained from the onsite slope indicators and inclinometers. Figure 21, Figure 22 and Figure 23 are plots showing various measurements of movement of the island as well as forces acting on the island.
Figure 20: Measured horizontal island movement
Figure 21: Manual inclinometer reading compared to in-place inclinometer reading
Figure 22: Measured movement at various instrumentation stations
Figure 23: Plots of ice forces recorded by different ice load panels, the global ice force and the horizontal island movement for Nipterk ice island.
8. ALERK SPRAY ICE RELIEF WELL PAD
The Alerk spray ice relief well pad was located north of Tuktoyaktuk in the Canadian Beaufort Sea in 1982, adjacent to the Alerk artificial island well. Esso Resources Canada Limited was the operator. Data about the Alerk site was found in Kemp (1984 and 1983).
Figure 24: Location of Alerk spray ice relief well
8.1 Construction Details
The water depth at the Alerk site ranged from 3.5 – 10.5 m (average of 7 m), as the site was on a sloping berm (Figure 25). The seabed was sandy. The site was in an area of grounded and floating ice rubble. This grounded rubble made up 60% of the final 5 500 m² of the ice pad area. As it was accessible from flat sea ice, an ice road for construction was not necessary. A D7 bulldozer was used initially to level areas of previous grounded rubble. A 4.54 m³/min centrifugal pump was used to apply the spray ice, using a 0.038 m diameter nozzle. Spraying began on January 27, 1982, and was completed fourteen days later on February 10, 1982, with a net spraying time of approximately ten days. Ice growth was 0.3-0.4 m/day. Some mounds formed during spraying, but these were leveled and compacted with D6 and D7 bulldozers. Cracking also occurred, but appeared to cease after grounding of the ice. Overall, 65 000 m³ of water was pumped to create a total volume of ice of approximately 22 000 m³. The difference was attributed to wind losses and brine drainage. Following break-up in mid-July, the last bits of the ice pad disappeared on July 30. The as-built topographic plan of the site is shown in Figure 26.
Figure 25: Profile plot of Alerk ice pad
Figure 26: Topographic plan of Alerk ice pad
8.2 Pad Geometry and Performance Monitoring
Prior to spraying, the grounded rubble that already existed had an average freeboard of 2.0 m. The average freeboard for the entire pad was 3.75 m. The pad area was 5 500 m². In the ungrounded areas, the depth of water beneath the rubble was about 1.5 m. The width of the pad was 80 m.
Measurements taken at Alerk included core samples to measure salinity, density, confined and unconfined compressive strength, temperature profiles and crystallographic analysis. Instrumentation was used to assess ice sheet and ice pad movements included aerial photographs, surveys and wireline movement gauges. The latter two methods were primarily carried out between April and
June, 1982. Figure 27 shows an overhead photograph of the site, with instrumentation locations added.
Figure 27: Aerial photograph showing ice pad and instrumentation locations
8.3 Ice Pad Stability
The design ice thickness was 2.1 m, and the design crushing stress was 1.7 MPa, giving a crushing load of 3.57 MN/m. The mean confined compressive strength of the spray ice (7.3 MPa) was lower than that of the consolidated ice rubble (13.4 MPa). The minimum unconfined compressive strength was 200 kPa. The mean density of the consolidated ice rubble was 870 kg/m³, while the average spray ice density was 740 kg/m³. These values are shown schematically in Figure 28, along with the potential failure planes. The static friction angle of the seabed was 38°.
A small cumulative lateral movement of the Alerk ice pad was detected over the course of the winter, in the order of 0.08 m. This movement was attributed to either slow creep of the ice pad down the Alerk berm, tilting of the survey reflectors due to melting or the accuracy of the surveys. The wireline gauges indicated movement on two separate occasions, once in the order of 2.5 m, and the second time of 1.3 m. However, these measurements were attributed to movement of the ice sheet within the rubble field around Alerk. No movement could be detected from the aerial photographs.
9. TARSIUT SPRAY ICE RELIEF WELL PAD
The Tarsiut N-44 spray ice relief well pad was constructed in the Canadian Beaufort Sea in 1981 (Figure 29). It was the first ice pad constructed at the edge of the landfast ice edge in the Beaufort Sea. The well operator was Dome Petroleum Limited (Gulf Canada Resources Inc./Panarctic Oils Limited) and construction was carried out by Fenco Consultants Limited. Details about Tarsiut were taken from Fenco Consultants Limited (1982/1985); and Neth et al. (1983).
Figure 29: Location of the Tarsiut N-44 spray ice relief well pad (as well as other Gulf drill sites)
9.1 Construction Details
The relief well pad was constructed approximately 150 m from the caisson retained island used for drilling. The water depth was 22 m. The seabed material was sand that had an internal friction angle of 33°. The pad was built on grounded ice that had formed around the caisson’s berm. An ice road was pushed open over the rubble field, leading from the caisson to the location of the relief well pad. Construction began November 30, 1981 and the design ice thickness was reached at the beginning of January, 1982. However, due to major ice events, build-up of the ice pad continued into March, in order to increase the pad’s stability. The pad broke up on July 3, 1982.
The initial construction of the pad involved leveling the grounded ice rubble at the design location. Further build-up of the pad was then accomplished by pushing or cutting rubble from around the design area. Material was carefully chosen for removal, to prevent destabilization of the rubble field. Flooding of the loose rubble in order to consolidate the ice began on December 7, 1981. Four Tait 15-hp submersible pumps, capable of generating 1 500 L/min, were used to generate the spray ice. Fire monitor nozzles were used for spraying the ice. Sea water could not be drawn from the grounded ice rubble, so the pumps were placed outside of the design area. Figure 30 shows the build-up of ice at the site.
Figure 30: Growth of ice at Tarsiut
9.2 Pad Geometry and Performance Monitoring
The diameter of the ice pad was approximately 90 m (the pad was not circular in order to take advantage of the bathymetry in the area and existing rubble). The minimum design thickness for the ice pad was approximately 6.5 m above sea level. This gave a factor of safety of 1.5 against sliding at the seabed, with a surrounding ice thickness of 1.7 m. The design ice pressure was 700 kPa. By the middle of March, 1982, the final thickness of the relief well pad freeboard was 8.0 m. The design and final geometry of the ice pad are shown in Figure 31 and Figure 32. The design average ice density was 800 kg/m³ with a maximum void content of 15%. Figure 33 shows two aerial photographs of the Tarsiut drill site and relief well pad.
The instrumentation around the caisson and ice pad included survey pins, strain gauges, thermistor strings, tidal recorders, inclinometers and MEDOF ice load panels. Additionally, borehole jack tests were carried out, other test holes were drilled to determine the composition and degree of consolidation of the ice and ice ablation was studied near the end of the season. Most of the instrumentation was installed in March, with the inclinometers installed in May. The five survey pins were partially buried into the ice around the relief well pad in February in order to conduct daily surveys relating to potential movement of the ice pad. The surveys were only precise to within 0.1 m for each of the coordinates, primarily due to the environmental conditions, but also due to available time (a precise survey required 2.5 hours in good weather conditions). The maximum recorded pressure on one of the panels was 896 kPa, resulting from a 1.2 m ice sheet crushing onto the ice pad. This was 196 kPa higher than the average design ice pressure.
Figure 31: Design and actual layout of Tarsiut relief well pad
9.3 Ice Pad Stability
The designers considered failure through the sand berm to be the critical failure plane. Prior to February, a large section of the rubble field broke off of the west side of the caisson and ice pad, but no movement within the ice pad was detected. There was movement in the main relief well pad area in February that coincided with the occurrence of cracking in the pad. The largest crack was approximately 1.0 m at its widest section. Any cracks that occurred were repaired through flooding and rubble fill. The maximum movement of the pad was approximately 0.15 m. At the end of March, there was again a 0.15 m movement. As the movement in both cases was close to the survey tolerance, movement had to be substantiated with additional information from strain readings, load panel values and crack observations. Both movement occurrences were generally rotations about the structure, and likely did not involve movement along the seabed (although this was not explicitly stated in any of the reports). These were the only recorded movements during the operational life of the pad. It was noted that the strains and cracks that were observed appeared to be related to the pad geometry, rather than the direction of pad motion.
10. KADLUK SPRAY ICE RELIEF WELL PAD
The Kadluk O-07 sprayed ice pad was constructed in the Canadian Beaufort Sea in 1983-1984 (Figure 35). It was built by Esso Resources Canada Limited. Details about the Kadluk ice pad were found in Kemp et al. (1987); Golder Associates (1984); and Stevens et al. (1984).
Figure 35: Location of Kadluk spray ice relief well
10.1 Construction Details
The sprayed ice pad was built 160 m from the Esso Resources Caisson Retained Island (CRI). It was located within the stable landfast ice; the area was partially covered by a 5.5 – 7.5 m thick ungrounded ice floe. This was approximately 35 000 m³ or 20% of the total required ice volume. The seabed was composed of shallow (1-2 m) clays, with a shear strength of 25 kPa and an internal friction angle of 33°. The water depth at the pad site was 13.4 m. A road to the ice pad from the caisson was constructed by flooding, beginning on October 23, 1983. Spraying at the pad site began on November 7, 1983. The pad was completed on December 12, 1983 (35 construction days). The pad completed melting on July 5, 1984.
The pad was built up using two diesel pump units, each with a capacity of 10 m³/min (Figure 36). Additionally, bulldoziers and a flooding bombardier were used for the pad construction. The general spray schedule involved spraying for 12-15 hours, followed by 12 hours of leveling by the bulldoziers. The ice was
built upon floating first-year and multi-year ice. There was little attempt to ensure that the pad grounded evenly, which resulted in cracking as the pad settled on the bottom (Figure 37). Some of the cracks were up to 2.0 m across. Most cracks were filled with spray ice near the end of the construction period. The weather was very warm throughout this period, so occasionally spraying was halted, or only one pump was used. A total volume of 112 000 m³ of spray ice was used.
Figure 37: Cracking on the ice pad surface during construction
10.2 Pad Geometry and Performance Monitoring
The final diameter of the ice pad was 100 m, although the shape of the pad approximated a triangle, with heavily rounded corners. The freeboard of the ice pad was 6.5 m, lower than the recommended 7.0 m. The area of the pad was 8000 m², although this diminished to 6750 m² in the initial month after completion. Settlement and ablation reduced the freeboard by another 1.0 m. The density of the spray ice was lower than anticipated, at 700 kg/m³. An aerial photograph of the site is shown in Figure 38.
The monitoring program included: • monthly surveys;
• load panels and ice movement stations continuously collecting data; • daily site observations;
• monthly aerial photographs;
• settlement probes, with monthly data collection;
• slope indicator tubes installed in the bottom clays, read monthly;
• collecting ice cores, field vane shear tests, driving cones and testing samples in a small shear box;
• temperature monitoring, using thermistor strings, read manually before February 25, then read twice daily once the data acquisition system was operational.
Figure 38: Kadluk drill site and ice pad aerial photograph after ice event (pad outlined in red)
10.3 Ice Pad Stability
The estimated shear resistance was 200 MN through the bottom clay, which had an undrained shear strength of 25 kN/m². The designers determined that failure through the seabed was not a critical failure mode. Failure from sliding along the seabed was instead determined to be the critical failure plane. Derived values for ice rubble building force across a wide structure were estimated to be 1.5 MN/m. The sliding resistance on the sea bottom was calculated using the methods described in Section 3.1.1, and was determined to be 22.5 – 24.4 kPa. while that of the ice was 22.2 kPa at yield and 37.9 kPa at failure. No safety factors were used. If the pad was to be used as a relief pad, rather than an emergency and research structure, the are and freeboard would have to have been increased. The maximum global forces that could be sustained by the island were calculated to be 204-259 MN at failure, or 125-149 MN at yield. The peak stress for a 1.78 m thick ice sheet was 0.85-1.0 MPa. The cohesive strength of the spray ice was measured as 6 kPa, while the friction angle was 28.5°. These were lower bound values.
There were two main ice movement events at the Kadluk site. The first, on January 6, 1984, occurred when the ice sheet around the site moved 0.8 km in 7.5 hours. The monitoring equipment had not yet been installed, but site surveys were made. A rubble field developed beside the ice pad and ungrounded portions at the side of the pad sheared off. This is shown in Figure 40 and in the schematic drawing of the site, Figure 41. Several cracks reopened as well. The maximum movement measured was 0.83 m, at the surface of the pad. It could not be resolved if this movement was a result of shear through the saturated spray ice, just above the first year and multi-year ice, or through the seabed, due to lack of movement data with depth. Stability analysis determined that for this first major movement the ice force was between the yield and ultimate strength of the ice pad. The ice pad’s shear resistance was calculated to be 149 MN at yield and 256 MN at failure.
On March 11, 1984, the landfast ice edge retreated, leaving the northern side of the pad exposed to open water, shown in Figure 42. All ice movement and load panels on this side of the site were lost. Additionally, it was noted that the survey pins near the edge of the ice pad moved laterally away from the pad centre 0.1-0.2 m per month, but this was associated with slumping at the edge of the pad. Movement near the pad centre, in the order of 0.1 m, was attributed to creep. Overall, the total movement on the surface of the pad was 0.83 m (Figure 43). Movement at the bottom of the relief well ice pad was not noted. This is partially due to cumulative error issues with the slope indicator tube readings. It was noted that the stability of the pad could have been improved upon by increasing the pad’s dimensions.
Figure 40: Kadluk ice pad showing passive slope failures and rubble river after ice event
Figure 42: Open water edge after March 11 retreat of landfast ice edge