Publisher’s version / Version de l'éditeur:
Lighting Research & Technology, 23, 3, pp. 135-144, 1991-09-01
READ THESE TERMS AND CONDITIONS CAREFULLY BEFORE USING THIS WEBSITE. https://nrc-publications.canada.ca/eng/copyright
Vous avez des questions? Nous pouvons vous aider. Pour communiquer directement avec un auteur, consultez la première page de la revue dans laquelle son article a été publié afin de trouver ses coordonnées. Si vous n’arrivez pas à les repérer, communiquez avec nous à [email protected].
Questions? Contact the NRC Publications Archive team at
[email protected]. If you wish to email the authors directly, please see the first page of the publication for their contact information.
NRC Publications Archive
Archives des publications du CNRC
This publication could be one of several versions: author’s original, accepted manuscript or the publisher’s version. / La version de cette publication peut être l’une des suivantes : la version prépublication de l’auteur, la version acceptée du manuscrit ou la version de l’éditeur.
Access and use of this website and the material on it are subject to the Terms and Conditions set forth at
Relative visual performance : a basis for application
Rea, M. S.; Ouellette, M. J.
https://publications-cnrc.canada.ca/fra/droits
L’accès à ce site Web et l’utilisation de son contenu sont assujettis aux conditions présentées dans le site
LISEZ CES CONDITIONS ATTENTIVEMENT AVANT D’UTILISER CE SITE WEB.
NRC Publications Record / Notice d'Archives des publications de CNRC:
https://nrc-publications.canada.ca/eng/view/object/?id=5a72f667-5fd1-4f6f-903a-86f71690cefd https://publications-cnrc.canada.ca/fra/voir/objet/?id=5a72f667-5fd1-4f6f-903a-86f71690cefd
National Research
Consell national
Councll Canada
de recherche8 Canada
Institute for
lnstitut de
Research in
recherche en
Construction
construction
k
Relative Visual Performance:
A
Basis
for Application
by M.S. Rea and
M.J.
Ouellette
Reprinted from
Lighting Research and Technology
Vol. 23. No. 3. 1991
p. 135-i44
(IRC Paper No. 1717)
Ltghtmg Rer Techno1 23(3) 135-144 (1991) Printed in Great B n w
Summay Visual performance is dcfrned in terms of the apeed and accuracy of processing visual informntion. To evaluate illuminated tasks in terms of visual performance, it is necessary
to have a valid camputarional model that relates measurable, salient aspects of the visual envimnment fc.e.
-
careet conmast) to measurable human responses " (e.8. visual response time). A mdel 01 vlrual performance should be mdcpendcn! of the lduencc of non-vtrual lactors as the) m8urn;e rpccd and accuracy. 11 ,r a l r ~ unporcant la have pracucal sppltcauon tools h a t can measure the salient aspects of the visual environment and compute (predict) visual performance for real tasks. This paper describes the basis for a visual performance model and how it can be applied using a computer imaging device.Relative visual performance:
A
basis for application
Mark
S
Reat PhD and Michael J OueUetteS BSct
Libring Research Center, Rensselaer Polytechnic Institute, Troy, NY 1218C-3590, USAt Nadonal Research Council Canada, Institute for Research in Construction, Ottawa, Ontario KIA OR6, Canada Recuved 10 Deceniber 1990, m h a 1 form 30 Aprrl 1991
1 Introduction
Visual performance has traditionally been defined in terms of speed and accuracy of processing visual information. In fact, inferred changes in speed and accuracy for different adaptation levels underlie the rationale for different illu- G a n c e levels recommended by nat~onal t e c h c a l socletles such as the Illununat~ne: Eogineer~na Societv of Norrh Amer- ica and the Chartered 1nstiGtion of Building Services Engin- eers. Consistent with this tradition, visual performance in this report is detined in terms of how quickly and accurately people can process visual stimuli that are defined in terms of adaptation luminance, target contrast and target sue. One goal of lighting and vision research has been to develop a general technique for assessing visual performance in actual environments such as offices, schools and roadways. Such a technique would permit the evaluation of real environments by criteria relevant to the visual system, rather than by intermediary criteria such as illumination levels.
To reach this goal, knowledge is required in two areas. First, a psychophysical model must be established that relates the salient physical features of the visual environment, such as contrast or sue, to measurable responses of human observers such as time or errors. Second, a practical procedure must be developed that can specify accurately the environmental stimuli that are important to visual performance. In other words, a measurement technique must be developed to quantify the salient physical features of the visual environment. Considerable effort has been devoted to reaching this goal over the past sixty years. Luckiesh and Moss"32) and Blackwell'" in particular, have pursued both psycho- physical research and measurement procedures. Extensive psychophysical data have been obtained on threshold visi- bility (the limits of visibility) for targets of different size and shape, targets presented off the visual axis, and for observers of different ages. Blackwell used these threshold data, obtained from parametric manipulation along several stimu- lus dimensions, to develop a computation model of visual performance. This computational model was published by
threshold, instruments were also developed by Luckiesh and Moss, Blackwell and others for assessing the threshold visibility of actual tasks. These instruments, known gen- erally as visibility meters, require an observer to view an actual task through an optical device that could gradually make the task invisible, that is, reduce its visibility to threshold. The Luckiesh and Moss'') visibility meter reduces targets to threshold by reducing adaptation lum- inance. Most other visibility meters, including those desig- ned by Bla~kwell(~), attempt to reduce targets to threshold by modulating their apparent contrast. It is also possible to design a visibility meter that would modulate the spatial frequencies of targets to reach threshold, but this approach has not been pursued. Given an empirical measurement of target threshold, a computational psychophysical model can be used to predict the suprathreshold level of visual per- formance for that target'').
Difficulties with both the theoretical and practical aspects of the threshold approach have been discussed by several authors in a symposium on the Theoretically, it is impossible to extrapolate suprathreshold visibility directly from threshold visibility, primarily because different levels of maximum visual performance are found at different adap- tation l u m i n a n ~ e s ' ~ ~ ~ ~ ] . To overcome this problem a variety of arbitrary, post hoc terms must be introduced to accurately characterise suprathreshold visual performance from threshold
measurement^'^'.
Practically, visibility meters have inherent limitations that prevent adequate characterisation of the visual stimulus for determination of visual performance"". For example, all visibility meters introduce optical infidelities. These include instmment-specific changes in contrast (such as losses in high spatial frequencies), size (such as optical magnification) and adaptation luminance (such as transmission losses or colour differences) that cannot be overcome without sup- plemental measurements and computations. The number of 'correction factors' that are needed to account for the differences between free-viewing and viewing through a visibility meter is large and task specific("'.
the Commission Internationale de I'Eclairage") and a tech- W e s t o n ~ ~ , l ~ l , Boyce(~41, Tinkerfl~181 and Rea and his nical review of this model was published by Public Works c011eagues(10,19,2&Z51,
for example, have pursued a different Canada@'.
B D D ~ O ~ C ~ to osvchoohvsical research. Rather than assess the ~~~~~- ~~~~
Consistent with the psychophysical approach based upon absolute limits of ;isibiiity and then extrapolate to supra-
threshold visual performance, their studies were designed to assess suprathreshold visual response directly in terms of time and errors (alternatively, speed and accuracy). Until recently, only a qualitative understanding of suprathreshold visual performance was possible. As pointed out by Rea(26), there are many subtle yet important experimental controls that must be considered when trying to extract visual per- formance from task performance, which includes motor skills, motivation and intelligence as well as visual per- formance. However, by experimental control and simple transformation of the data, the impact of target contrast, target size, adaptation luminance and observer age on visual response time and errors was obtained. From those data a computational psychophysical model of suprathreshold vis- ual response was d e v e l ~ p e d ( ' ~ ~ ~ ~ ~ " ~ ~ S ) .
Rea and his colleagues have also developed a measurement procedure that is consistent with their psychophysical approach that relates measurable, salient values of the visual stimulus to measurable suprathreshold responses in terms of time and e r r ~ r s ' ~ ~ ~ ' ~ ~ " ~ ' ~ ' . Two approaches were pursued. One approach utilised physical measurements of size and adaptation luminance as well as a 'contrast matching' tech- nique, whereby the brightness of one of a large number of achromatic reflectance cards was matched to the actual target. Not only was this approach tedious to perform, but the contrast matching technique produced systematic errors when targets of different colour were compared with the achromatic reflectance cards("'. A more sophisticated but simpler approach employs modern computer image pro- cessing t e c h n i q u e ~ ( ~ ~ J . From a calibrated video image of the task, the salient visual features (such as adaptation luminance, target contrast and target size) are measured and then used as input parameters for the suprathreshold psychophysical model of visual performance which, con- veniently, resides in the computer.
The basics of both the psychophysical model and the computer imaging system (CapCalc, which stands for capture and calculate) have been described in detail e l ~ e w h e r e " ~ ~ ~ ~ ~ ' " . This report serves two purposes. Primar- ily, links between two independent experiments are pre- sented for the first time and these links provide the basis for a valid set of visual performance equations. Further, equations are presented that document the presumed age- dependent changes in visual performance from twenty to sixtv-five years. Secondarily, the report documents thevisual performance equations res~dent in ;he current CapCalc soft- ware. Thus. this oaocr describes the basis for relative visual performance and'how it can be applied using CapCalc.
2 T h e numerical verification task
The numerical verification task was developed by Smith and Rea"O' to assess the impact of task luminance and target contrast on the speed and accuracy of processing visual information at a controlled, simulated realistic task. The numerical verification task was used subsequently in a var-
t
it was argued that time and errors likely provided the same information about visual performance, but that h e rime data were more complete and thereby provided a more accurate representation of visual performance.t:
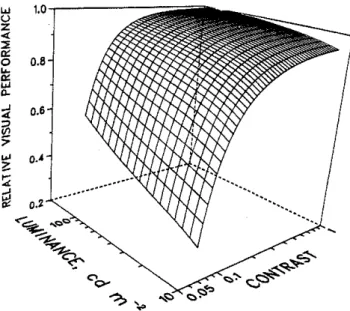
Contrast threshold values far the printed numerals used in this exper- iment were based upon a subjective criterion of 'readability.' To reach this criterion more target contrast is required than is required to reach a 'detecrion' criterion.Figure 1 Three-dimensional representation of relative visual per- formance (nvp) as a function of target contrast and background luminance, based upon the numerical verification task (from Reavo')
iety of other experiment^(^^^"', including one reported by Rea(Io', which resulted in a computational model of supra- threshold visual performance (Figure I), known as the rela- tive visual performance (RVP) model.
The RVP model presented in Rea'l0' was based upon the visual timet for young adult subjects (mean age of twenty- two years) to compare two lists of twenty pairs of five- digit numerals, relative to the computed time to make a comparison under arbitrary, highly visible reference con- ditions. The time needed to perform nonvisual task-related activities such as placing tick marks to discrepant digits was excluded from the model. Adaptation luminance, from 12 to 169 cd m-', was changed by varying illumination level; the contrast of the targets (numerals) was modulated, from 0.092 to 0.894, by parametric variations in ink pigment density, ink gloss and lighting geometry. The viewing dis- tance to the centre of the number lists was a constant 50 cm throughout the experiment.
3 ,Determination of relative visual performance
The RVP model is an attempt to represent the efficiency of
visual processing, and is, in principle, independent of the nature of the visual task. RVP ranges from 0 at 'readability threshold'$ to 1; RVP = 1 corresponds to an arbitrary mini- mum time computed from data obtained in the 1986 numeri- cal verification task experiment(l0). RVP can assume values greater than 1 for better visual conditions than those associ- ated with the arbitrary reference conditions such as large targets seen at higher background luminances. As shown in Figure 1, above contrast threshold, at a given background luminance, RVP improves rapidly as target contrast increases, until a point where RVP begins to saturate, that is, when further increases in task contrast have little effect. As back- ground luminance increases, contrast threshold is reduced and RVP saturates at a higher level.
Steps 3(a) through 3Cf) document Rea's procedure for cal- culating R V P ' ~ ~ ) . Strictly speaking, the model is applicable to
young adults reading negative contrast (dark ink on bright background) letters or numbers, each character subtending
Application of relative visual performance an average 'solid visual angle of 4.8 X steradians.
Character size is defmed by the area of the ink, viewed at a specified distance, that is, the solid visual angle of the character. With the CapCalc system this value is obtained easily by integrating the areas of the size-calibrated pixels which define the character. The range of background lumi- nances in the model is between 12 and 169 cd m-'. The reciprocal of visual time necessary to read the alphanumeric stimuli 'as quickly and accurately as possible' is the measure of visual performance.
3(a) Select task background luminance L, with the range of 12 6 L, 6 169 cd m-'.
3(b) Calculate readability contrast threshold C,, at the selec- ted L,, where
C,,, = 0.0418[(0.308/LB)0~4
+
l.012.5.3(c) Select task luminance contrast C,, where L, is greater than the target luminance LT, and
L,
-
LTC, =
-
L B
3(4 Calculate the parameters n, k and
w-,
wheren = 0.882
+
4.388,-
6.050: and81 = l0gl0[l0g10(L~)1
log,& = -2.25
+
1.778,-
0.2178: and 8, = loglo(L,)>W, = 0.0628
+
0.012082-
0.002688:.3(e) Calculate the predicted level of performance
w,
wherew
= {AC:I[AC:+
(kILB)n]}w, where AC, = C,-
C,,,.for values of AC,
<
0,w
= 0. 3 0 Determine RW, whereRW = wlf, and
f = 0.0760 =
w,.
at LB = 169 cd m-'.For the numerical verification task experiment, RW
ranges from 0 to 1.
Comparisons between the RW model predictions and data from other experiments were performed by Rea(16) who argued that, except for a single study by McNelis'"), the studies reviewed had a variety of inherent experimental difficulties that ~revented a auantitative validation of the
RW model. ~ l t h o u g h predicti&s from the RVP model agreed
remarkablv well with the data from McNelis. it was deemed prudent to perform another, independent.experiment to validate and extend the RW model.
4 The reaction time experiment for psychophysical model
Rea and O~eUette(~'! completed a study of simple reaction times. Square targets of different contrast, both positive and negative, and size, from 2 x to 2.8 x steradians, were flashed on a video screen of variable luminance. Young adults viewed the display through a circular 2 mm diameter anificial pupil that controlled retinal illuminance, from 0.53 to 801 trolands
(T).
Detection threshold values and reaction times were determined for the young adult subjects who had a median age of twenty-one years.Data from the reaction time experiment were similar in form to those from the numerical verification task. Equations similar to those used in the RVP formulation were used to
model the visual response times from detection threshold to saturation for the conditions used in the experiment. The parameter ATvi, is the difference in visual response time for a given set of stimulus conditions, relative to an arbitrary, reference set of suprathreshold stimulus conditions. In keep- ing with the philosophy expressed in developing the RW
metric, the reference set of stimulus conditions was a target of high contrast and large sue, which was presented on the highest background luminance used in the experiment. It was assumed that nonvisual processing time was constant and independent of visual processing time for all conditions in the simple reaction time experiment. Thus, the procedure leading to AT,. was designed to isolate the incremental, visual processing time (Figure 2).
5 Determination of AT,
Steps 5(a) through 5(e) detail the algorithm from Rea and Ouellette("! for calculating predicted performance R and incremental visual performance time AT,, from measure- ments of retinal illuminance
(IR
in trolands from 0.53 to 801), targetsue(win steradiansfrom 2 X to2.8 x lo-')and contrast (C,).
5(a) Calculate detection contrast threshold Cf,d where
A = loglotanh (20000w) L = 10g,&og,~ (1OIR/n)
I, = Retinal illuminance, from 0.53 to 801 T, = LA& r = Pupil radius (mm)
LA = Photopic adaptation luminance (cd/m+) w = Area of target (steradians) from 2.0 x to
2.8 x 10⁻³
5(b) Calculate the half-saturation constant K, where A* = log,otanh(5,000w)
L* = l0g,~tanh(O.O4I~ln)
5(c) Calculate maximum response
R,,,
whereR, = 0.000196 logloIR
+
0.002705 ( 4 Calculate performance
R
and predicted reaction timeRT, where
5(e) Calculate the change in visual performance AT,, relative to a reference condition, where
RT,~ is the arbitrary response time associated with the following stimulus conditions: 0
>
13 x 10.' ster-M
S
Rea and M OuelletteFigvre 2 Three-dimensional views of relative visual perfor- mance (RvpRT) plotted as a function of retinal illuminance (trolands) and contrast, based upon the resc- tion Iime experiment by Ilea and 0uellerte'241. Each oanel represents
adians, IR = 801
T,
andC-
x . Then RT,., = 305 ms. For the reaction time experiment, AT,. ranges from-a; to 0.
6 Relating RVP and AT,,
The purpose of this section is to compare the visual per- formance predictions from the RVP and AT,, models devel- oped, respectively, by Rea('Q for the numerical verification task experiment and by Rea and O~ellette(~" for the reaction time experiment. Subsection 6.1 defines a common set of stimulus conditions for the two experiments. Subsection 6.2 presents a simple, linear transformation procedure relating units of RVP to units of AT,,. F i l l y , a graphic comparison of the two model predictions is offered for the range of stimulus conditions common to both experiments.
6.1 Establishing a set of equal stimulus conditions 6.1(a) Subject age
In both experiments young adults of approximately the same age were used as subjects. Age-dependent reductions in retinal illuminance or retinal contrast should be equivalent for the two subject populations. Therefore, direct com- parisons between the performance levels of the two groups should be feasible. Typically, it is only possible to compare
a different targcr size measured m microsteradians (solid angle, in microsteradians). The second panel, labeled 4.8 microsreradians, represents the average targer sire of the digirs in the numerical veri- Bcauon Iask by Rea(Io1 end is com- parable to Figure 1.
the relative performance levels of the two subject populations. As discussed by Realz6' absolute levels of per- formance can depend upon a variety of non-visual factors. Motivation, fatigue, motor skill and intelligence can all affect task performance, but as long as these non-visual factors do not vary systematically with the stimulus variables (or are constant within subject groups), the relative performance of the two groups can be compared.
6.1 ( b ) Target contrast
Target contrast was controlled and measured in both experi- ments. Thus, target contrasts in the two experiments can be directly compared.
6.1(c) Target size
Target size was manipulated systematically in the reaction time experiment, but not in the numerical verification task experiment. To compare the results of the two experiments an argument must be developed to relate the square targets in the reaction time experiment to the printed numerals in the numerical verification task experiment. Although not a complete specification, research supports the hypothesis that the visual area of a target is a very robust method of charac- terising target size for both threshold and suprathreshold performance. Kristoffers~n(~~' showed that detection
Application of relative visual perfmance
thresholds for targets of different shape (square, discs, tri- angles, etc.), but of the same solid angle, were nearly ident- ical. Of the various shapes, discs had the lowest associated detection threshold for a given solid angle, implying that target 'details' (corners and lines) were relatively less effec- tive at producing a visual response. (See Dember'"), pp 117- 122, for a summary of this work). Consistent results were obtained by Campbell and Robson(") using square and sine wave gratings as targets for detection threshold. They found that the contrast sensitivity functions for these gratings were nearly identical, implying, again, that target 'details', or high spatial frequencies were relatively unimportant for detection. Legge et a1."81 examined suprathreshold per- formance at a reading task and found that high spatial frequency information had little effect on reading. This again demonstrates that spatial details are relatively unim- portant for typical reading tasks involving speed and accuracy. Rubin and Siege1 showed very similar results for letter rec~gnition"~~. Finally, an unpublished study by Rea and Kambich showed that reaction times were effectively the same to flashed rectangular targets of equal solid angle, but of different aspect ratios. Thus, the visual area of a target, measured in terms of steradians (solid angle), appears to be a good first-order approximation of target size as it affects visual performance. This is not to say that target details, i.e. high spatial frequency information, are unim- portant. Clearly, high spat~al frequency information is important to vision, otherwise it would be impossible to discriminate between letters of different fonts but of equal visual area. Remarkably, however, these higher spatial fre- quencies can be expected to play a relatively minor role in visual performance as measured in these two experiments. Future work will develop a more detailed model of visual performance using more complete spatial information (e.g. KambichlW'). Using visual area as a measure of target size is also attractive because it is convenient to measure. The CapCalc video photometer(32), described briefly below, can be used to measure the solid angle of a target. Essentially, each pixel in the video image is calibrated in terms of its visual area for any given distance. Thus, knowing the visual area of every pixel representing a target in the video image, it was possible to determine the solid angle subtended by each digit in the numerical verification task. At the viewing distance and angle used in the numerical verification task experiment, the average solid angle for each of the 10 digits (0 through 9) was 4.8 . . .. . x . ~. steradians at the centre of the numer~cal verhcatlon task list.
6. lid Retinal illuminance
Although background luminance was controlled in both experiments, pupil size was not controlled in the numerical verification task experiment. As background luminance increased in the numerical verification task experiment, pupil size would be expected to systematically decrease, and vice versaos'. Several estimates of pupil size for different adaptation luminance have been published. Wyszecki and
stile^"^'
use the equation published by De Groot and Geb- hardc3" as the best representation of published data on adult sizes as a function of adaptation luminance (Figure 3). The authors' review shows, however, that at high adaptation luminances, computed pupil size goes to zero using the DeGroot and Gebhard equation; this is an impossibility. Therefore the authors havc modified the equation of DeGroot and Gebhard for high adaptation luminances. Equation 1 accurately represents the DeGroot-Gebhard equation over the range of adaptation luminances for whichVol. 23 No. 3 (1991)
F i g w 3 Predicted pupil dia-
meter as a funcuon of photopic
adaptation luminance L,. The dashed line represents De Groat and Gebhard's rquati~n*~J d =
,OIP."" - 0 . W 1 I h , y , i a 01); line d = 4.77 - (2.44 tanh[0.3
~log,~(LJIl confarms to the dashed line over the range of luminance
values where published data were
available to DeGrwt and Gebhard, but does not allow the pupil size estimate to became zero
at high adaptation luminances. B
is the adaptadon luminance in mil. lilambens (B = 0.3142 L,).
there are published data, but does not allow pupil area to go to zero.
D
= 4.77-
[2.44 tanh(0.3 logloL A ) ]
(1)where D = 2r is the pupil diameter (mm) and LA is the photopic adaptation luminance (cd m-'). From equation 2, retinal illuminances IR (troland) were calculated for the luminance values used in the numerical verification task experiment:
I, = L,m2 (2)
6.1(e) Contrast threshold
Threshold is a useful, but statistical, concept to describe the breakpoint between seeing and not seeing a target. As discussed in some detail by Rea(9~'o', different subjective criteria can be adopted by observers when evaluating con- trast threshold. For alphanumeric symbols both 'readability' and 'detection' are meaningful criteria to subjects; both criteria can be used to evaluate threshold visibilityc9'. Step 3(b) describes contrast threshold
C,,,
for the RVP formulation and is based upon subjective judgments of 'readability' threshold. In other words, determinations were made of the contrast values at which the numerical verification task digits could 'just be read.' Detection contrast threshold Ct,d in theATvi, formulation from step S(a), determined directly from
the reaction time data, was based upon the fifty percent probability of detecting a square target of a given size for each adantation luminance. It is not nossible to comnare directly ;he
f re dictions
of contrast tlireshold in the'two experiments because each was obtained from subjects using different threshold criteria. Qualitativelv, however, the threshold data from these two-experiments are consistent with the discussion by Real9). The contrast values required to reach detection threshold in the reaction time experiment were always lower than those required to reach readability threshold in the numerical verification task experiment for targets of equal solid angle that were presented at the same retinal illuminance.6.1(f) The set of equal stimulus conditions
Based upon the rationale developed in sections 6.l(aHe), it is now possible to generate predictions of RVP and AT,. for a common set of stimulus conditions. The following set of common stimulus conditions provides values of AT,,, and
RVP of -23 ma and 0.998, i r s p e ~ ~ i v r l y . These two special values are designated AT:, and RVP' and are used, below, in developing
a
linear transform between units of A T , , and units of RVP. Retinal illuminanceI,
= 801 trolands. This isM S Rea and M
the highest value of retinal illuminance in the reaction time experiment and therefore the highest common to both experiments. Target size w = 4.8 X steradians. This is the average apparent digit size in the numerical verification task experiment and therefore the only one common to both experiments. Contrast
C,
= 1.0. This is the highest possible contrast for targets darker than their background. Although not used in either experiment, this value is a convenient high-contrast reference value.6.2 Relating units of RW to units of AT,.
If, in fact, two independent metrics are scaling the same physical attribute of an object (e.g. temperature), then it should be possible to linearly transform the units of one metric into units of the other (e.g. the Fahrenheit scale to the Celsius scale). Similarly, if the reaction time experiment and the numerical verification task experiment are both scaling visual performance, it should be possible (indeed, required) that the two scales be related to one another by a linear scale transformation.
Equation 3 can be used to linearly transform AT,,, into units
of RW. AT,, values transformed in this way are designated
AT,, is defined in steps S(aHe) above, and AT,,,,, is the
estimated value of AT,, at readability contrast threshold. Thus R V P ~ ~ = 0 when ATvi, = AT,;,,, and RvPRT = 0.998 when AT,, = ATL,.
Since readability threshold was not a meaningful criterion in the reaction time experiment, AT,,,, was treated as a free parameter and estimated, by regression analysis, as -800 2 29111s in a manner that simultaneously minimised the sums of squared deviations from the three dashed lines in Figure 4, chosen to represent retinal illuminances com- mon to both experiments. This assumes that a value of ATvi, equal to -800 ms is comparable to a value of RVP equal to zero, readability threshold.
6.3 Summary
The data from two experiments of visual performance, one using reaction times and the other timed response in a simulated realistic task, were independently modelled (Rea and O~ellette'~"; Rea(lo)). A common set of stimulus con- ditions was determined and a linear transformation method was developed to relate the units of one experiment to the other.
Considering (a) the two very different and independent experiments, ( b ) the estimates leading to a common set of stimulus conditions, and (c) the single constant used to relate one scale to the other, the predictions from the two experiments are graphically very similar (Figure 4). It should also be noted that McNelis' visual performance data, based on measured a c c u r a ~ y ' ~ ) , are also well described by these two sets of f~nctions"~'. The agreement between these three independent \,isual performance d a ~ a sets validates, to a first a~~roximation at least, the RVPRT .or RI'P formulation 01'
i i u a l performance f ~ r - ~ o u n ~ adult subjects.
7 Age
To generalise the R Wpredictions for older subjects it was ~ ~
140 EXPERIMENT I
-
RUCTION TIYE 0.0- -
NUMERICAL VERlFfCATlON.
0.04 0.10 1 .OO CONTRASTF i w e 4 Comparison of the predictions of visual performance as a function of convast using the nvp (numerical verification), dashed lines, and nvP& (reaction time), solid lines. nvr predictions are based upon the numerical verification task erperiment"'~"'; nvpR, predictions are based upon the reaction time experiment"". Three adaptation luminances, rep- resenting the range of retinal illuminance values common to both experi- ments,are presented in rrolands. Zeroon the RVP scale representsreodabiliw threshold.
necessary to estimate the age-dependent reductions in retinal illuminance and retinal contrast.
7.1 Retinal illuminance
Smith and Rea'"' used the numerical verification task with two subject populations of different ages: twenty to twenty- five and sixty to sixty-five years. Task performance for the older subjects was lower than that for the younger subjects. Wright and Rea(28' showed, however, that relarive values of task performance obtained from the older subjects in the Smith and Rea study could be transformed to be very similar or identical to those of the younger subjects simply by taking into account published estimates of the losses in retinal illuminance and, to a smaller extent, retinal contrast with age.
Weale(43,") developed an estimate of age-dependent reductions in retinal illuminance (Figure 5). This reduction is based upon Weale's estimates of the thickening of the crystalline lens and reductions in pupil area with age. Com- bined, these two effects produce retinal illuminance reductions
P
due both to reduced transmission and to increased scatter, that can be approximated by the following simple linear equation"":P
= 1-
0.017(a-
20) (4) where a is the age, in years, between twenty and sixty-five. Equation 4 modifies the retinal illuminance values In inApplicarim of relative visual performance
V-LAMBDA FILTER
VIDEO CAMERA
Figvre 5 Weale's"" estimate of the relative decline in retinal illu-
'
;u
A E C ylllland Mnance Reali8) with y (from Wright
equation 2 and in 5(a) above, thus:
I,. = P L A r n 2 . (5)
7.2 Retinal contrast
Equation 6 provides an estimate of the age-dependent losses
E in retinal contrast between the ages of twenty and sixty-
five years:
E = 1
+
[(0.113/45)(a - 20)] (6) This cquation is bdned upon the wurk o i W'nght and Rea'"
descr~bcd above and 111 Real- . Explicit in theeuuation is the largely unsubstantiated assumption that the age-dependent losses in retinal contrast that arise from changes in the crystalline lens can be described with a linear equation similar to that which describes the age-dependent losses in retinal illuminance. Consistent with the analysis by Wright and ReaiZ8', it has also been assumed that the nonlinear, suprathreshold response produced by neural activity remains the same up to age sixty-five years. Imperfections anterior to the retina, mostly in the crystalline lensiM), serve to scatter light, and thus they reduce retinal contrast, effectively elev- ating contrast threshold. Equation 6 modifies the detection contrast threshold values in S(a) above, thus:p d = E 1 0 i - 1 . 3 6 - 0 . 1 7 9 A 0 . 8 1 3 L + 0 . 2 Z 6 A 2 0 . 0 7 7 Z ~ + 0 . 1 6 9 A L )
(7)
Equation 6. and therefore equation 7, should be considered hiehle tc.ntative. Not onlv are therc feu. rel~able estimates of a&-dependent light scatter in the crystalline lens, but also the impact of that scatter on visual performance will be highly dependent upon the spatial characteristics of the target. The visibility of large targets will be less affected by entopic scatter than it will for small targetsid6).
8 Measurement procedure
To utilise the visual performance model described above for field applications it is necessary to measure the visual stimuli to be i s i d a, input pdrdmeters-~n the R\'P,, cquatlon,. Thus: the salient ieaturec of the spatial luminance distribution in a visual scene must be captured and quantified, ideally using
a oractical method. The ohvsical characteristics of the visual - - ~ ~~-~
.
,environment that drive the R V P ~ ~ algorithm are target area (steradians), target luminance (cd m-'), and background luminance (cd m-'). The latter two give target contrast and adaptation luminance (cd m-Z). Observer age in years i s a mediating variable that modifies themeasured target contrast and adaptation luminancc values.
The CapCalc video photometric imaging system (Figure 6) is a recent innovation for obtaining the RVPRT input
Vol. 23 No. 3 (1991) VARIABLE APERTURE ZOOM LENS VIDEO MONITOR COMPUTER MONITOR 1.2 Mbyte Figure 6 The CapCalc phatometric imaging system (from Rea and
parameters'"'. Basically, the CapCalc system is comprised of a photoptic sensitive charge-coupled device (CCD) video camera, imaging board and personal computer. It produces a 512 by 480 array of picture elements (pixels) and has an &bit brightness resolution (256 levels of luminance). The system is calibrated both in terms of photopic luminance (cd m-2) and solid visual angle (steradians). Images captured with theCapCalc system are stored in terms of the luminance and the subtended angle of every pixel in the captured image.
Any portion of the 245 760 pixel array captured by the CCD
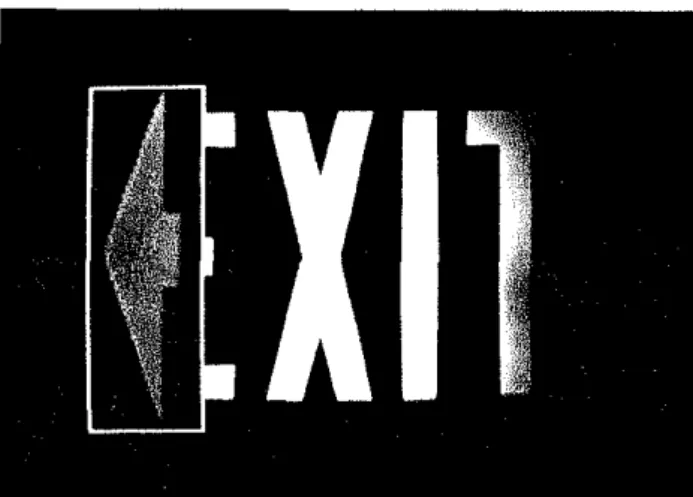
video camera and imaging board can be isolated and then man~pulated by the user to identify the Input pardmeters tor !he KVPX I calculation. 'The software permits the user to dace a rectangle around the image of the target to be evaluated (Figure 7). A target could he, for example, a letter on a page, a muffler lying in a roadway or, in the case of Figure 7, the directional arrow on an exit sign. Often the target is comprised of several luminance values. The user can 'aver- age' these luminance values using one of the software options and store this value in the computer. The background lumi- nance is similarly obtained and stored.
Adaptation luminance is defined and stored in CapCalc as the unweighted, average luminance of the entire captured image. Based upon the user-defined observer age, adaptation luminance is modified according to equation 5. Since the target luminance averaging procedure defines those pixels that the user has called 'target' and since everv oixel has a known solid angle, the areasof the target pixelia;e summed and then the total visual area of the tareet is automaticallv "
stored in the computer.
D~fferent values for the Input parameters (target contrast, target area, and adaptation luminance) can be substituted by the user into the system's memory. K V P ~ ~ can then be
M
S
Rea and M J Ouelletteprovide quantitative assessments of realistic targets in terms of visual oerformance. even usine the CIE svstem. There-
Figure 7 Video image of an exit sign produced by the CapCalc photo- metric imaging system. The direcrion arrow has been isolated and enlarged for better analysis of its spatial-luminance characteristics.
recomputed using the new values. For example, the user may want to know what the effects would be on R V P ~ ~ if the adaptation luminance (illumination level) were reduced by fifty percent. By substituting the new value into the system memory the consequences of reduced illumination levels on
RVPnT can be determined. Thus, a variety of 'what if' ques- tions about R V P ~ ~ can be answered.
Like all optical systems, the present CapCalc system does not have unlimited spatial resolution. Using calibrated close- up lenses, however, targets as small as 0.16 by 0.22 mm can be measured without losses in image contrast.
The sensitivity limit of the present CapCalc system is approximately 0 . 4 ~ d m - ~ . This is not a severe limitation for working in the phototopic range, approximately above 3.0 ~ d m - ~ ' " ) . Naturally, as with all photometric instru- ments having a photopic spectral response, it cannot be used correctly at mesopic or scotopic levels.
9 Discussion
Recommended levels of illumination published by the Char- tered Institution of Building Services Engineers (CIBSE) or the Illuminating Engineering Society of North America (IES), for example for offices, schools, and hospitals(47), are predicated on the notion that speed and accuracy of pro- cessing visual information can be improved by increasing the level of visual adaptation, that is, by more illumination on a task. It is also formally recognised that tasks having visual targets of lower contrast or smaller size demand higher levels of illumination to maintain the same level of visual performance. It is further acknowledged by the IES that older people need more light than younger people to see equally well.
It has been assumed for some time that if a valid psy- chophysical model were used in conjunction with a practical field instrument for measuring the visual stimulus, rec- ommended illumination levels could be replaced by more precise recommended levels of visual performance. Certainly th,is was the belief behind the Commission Internationale de I'Eclairage (CIE) system") developed by Blackwell. Although there is considerable research to support the quali- tative. application of these ideas, it has proven difficult to
fore, despite a long history of yesearch in;o visual per- formance and its measurement, recommended illumination levels remain a central part of lighting design and appli- cation.
A preliminary model of suprathreshold visual performance, known as relacine visual performance, was published by ReaOo'. Consistent with earlier studies performed by a num- ber of researchers, RVP was found to vary systematically with background luminance and target contrast. As discussed in the present report, earlier research by McNelis(") and subsequent research by Rea and Ouellette"" corroborated and ex~anded the scove of the ~reliminarv RVP model. This validation provides sipport for using the RvpRT formulation, develo~ed in this reoort, to assess visual ~erformance.
.
. Tech- nological advances in CCD cameras and image processingmake it possible to apply R V P ~ ~ in the field. Together then, these developments have led to a new, practical method for determining visual performance from spatial luminance data obtained from a calibrated video image. For example, the
R V P ~ ~ . model and the CapCalc video photometric imaging
system can be used to answer a wide range of practical questions'48' such as the following:
*
How quickly and accurately can postal workers process mail under a particular lighting system?*
Will a sixty-five-year-old driver travelling at 100 km h-' have time to avoid an obstacle in the roadway?*
What would be the impact on the visual performance of school children if the illumination levels in classrooms were reduced by fifty percent or increased by thirty percent?These and other practical questions can be answered with a auantitative model of visual oerformance and a measurement &stem that can capture and analyse that information in the field. They cannot be adequately resolved by referring to a table of recommended levels of illumination. It is perhaps premature to expect sanctioning bodies such as the Illumi- nating Engineering Society of North America or the Char- tered Institution of Building Services Engineers to abandon recommended levels of illumination for recommended levels of visual performance, but the developments discussed in this report provide another step in that direction.
Acknowledgements
The authors thank Drs P R Boyce and H W Bodmann for comments on an earlier draft, and the two anonymous reviewers who helped clarify the present manuscript.
Appendix
To calculate R V P ~ T follow steps Al through A7 below. Note
that steps 3 and 5 in Appendix C of Rea and O ~ e l l e t t e ( ~ ~ 1 had typographical errors that have been corrected here. This formulation is exactly that which is presently used in the CapCalc imaging photometric system.
(Al) Calculate the retinal illuminance I,.(T). In the range 0.5-801 T :
Application of relative visual perfmnce where
LA
is the phototopic adaptation luminance(cd m-l).
Pupil radius (mm) is given by
r = 2.3859 - [1.2204 tanh(0.3 log,, LA)]
P
= 1 - 0.017(a-
20)where a is the age of observer from twenty to sixty- five, in years.
(A2) Calculate detection threshold contrast C;,*
ci
-
~0(-1.3M15-0.178589A-0.8128JOL f , d-
E+0.225W8A~-0.077169L2+0.I69252AL)~
A = loglo tanh(20 000w)
L
= logl~oglo(lOI,in)w is the area of the target in steradians from 1.8 X to 2.8 x lo-'
E = 1
+
[(0.113145)(a-
20)].(A3) Calculate the half-saturation constant
K.
K
= 10'-1.763M-O.175369A'-O.O30967L'L* = loglotanh(0.04 I,in).
(A4) Calculate maximum response
R,,.
R
,
= 0.000196 loglo I,,+
0.00270.(AS) Calculate performance
R
and predicted reaction timeRT.
C ,
=lL'
-
LT', where L BL, is the luminance of background (cd m-')
LT
is the luminance of target (cd m-l)RT = 1/R.
(A6) Calculate the change in visual performance AT,,, rela- tive to the reference condition.
(A7) Calculate relative visual performance based upon the reaction time experiment RVP,~.
AT,,,,, = -800 ms.
References
1 Luckierh M and Moss F K A visual thresholdometerf. Opr. Sot. A m . 24(11) 305-307 (1934)
2 Luckiesh M and Moss F K The $ r i m e of seeing (New Yark: Van Nostrand) (1937)
3 Blackwell H R Contrast thresholds of the human e y e r . Opt. Sac. Amor. 36(11) 624-643 (1946)
4 Blackwell H R Development and use of a quantitative method for specifiution of interior illumination levels on the basis ofperformance data INum. Eng. 54(6) 317-353 (1959)
5 Blackwell H R Dcvelapment of procedures and instruments for visual task evaluation Ilium. Eng. 65(4) 267-291 (1970)
6 Blackwell 0 M and Blackwell H R Individual responses to lighting parameters for a population of 235 obsewers of varying ages3. Illurn. Eng. Soc. 9(4) 205-232 (1980)
7 Commission Internationale de L'Edaiage An analytic model for describing rhe tnpuence of lighting pnromatws upon visual pe~fmmnnce (Paris: Bureau Central de la CIE) (1981)
8 Public Works Canada The incapotion ofuirualpnfmmnncecriten'a inlo rhe illurninorion deim ororerr (Ottawa: Public Works Canada1 119821
- .
, ,~ ~ - ,9 Rea M S The validity of the relative contrast sensitivity function for modeling threshold and suprathreshold responses in The inregrorion of visual perfmmnnca irirm'o into [he illumi~tion d e e n process (Ottawa: Public Works Canada) 76108 (1982)
10 Rea M S Toward a model of visual performance: foundations and data J . Ilium. Eng. Soc. 15(2) 41-57 (1986)
I I Rea M S and Ouellette M J An Arsesnent oftheBlnckwe11 vim1 rork aaluatm model 3X (Ottawa: Division of Building Research National Research Council Canada) NRCC 22960 (1984)
12 Westan H C The reloria b o m m illumination and irrdunhl eficimq:
I. The effect ofsize ofwork (London: Her Majesty's Stationery Office) pp 1-14 (1935)
13 Weston H C The relorion botweol illuminorion and viruol efieiency: the effect ofbrighmrr canart (London: Industrial Health Research Board, Great Britain Medical Research Council) pp 1-35 Report No. 87 (1945) 14 Boycc P R Age, illuminance, visual performance and preference
Lighting Re$. Teehnol. 5(3) 25-144 (1973)
IS Tinker M A The effect of illumination intensities upon speed of perception and upon fatigue in reading3. Educ. Plychoi. 30(8) 561- 571 11939)
- - ~ - ~ - ~ ,
16 Tinker M A Illumination intensities for reading newspaper t y p e J . Edur. Pqchol. 34 247-250 (1943)
17 Tinker M A The effect of intensity of illumination upon speed of reading six-point italic print A w . 3. Pryehol. 65(4) 600-602 (1952) 18 Tinker M A Brightness mntrast, illumination intensity and visual efficiency A m . 3 . O p r m q a n d Archiv. A w . Acod. O p t m q 3 6 ( 5 ) 221-236 (1959)
19 Smith S W and Rea M S Proofreading under different levels of illumination3. Illum. Eng. Soi. 8(1) 47-52 (1978)
20 Smith S W and Rea M S Relationships between office task per- formance and ratings of feelings and task evaluations under different light sources and levels Proc. 19th Session CIE, Kyoto pp 207-211 Publication no. 50 (1980)
21 Smith S W and Rea M S Performance of a reading test under different levels of illumination3. Ilium. Eng. Sot. 12(1) 29-33 (1982) 22 Smith S W and Rea M S Check valve verification under different
levels of illumination3. Illum. Eng. Soc. 16(1) 143-149 (1987) 23 Rea M S Visual performance with realistic methods of changing
contrast.7 Illum. Eng. Soc. 10(3) 164177 (1981)
24 Rea M S and Ouellette M J Visual performance using reaction times Lighting Re*. Technol. 20(4) 139-153 (1988)
25 Rea M S, Ouellette M J and Tiller D K The effects of luminous surroundings on visual performance, pupil size, and human preference
3. Illum. Eng. Soc. 19(2) 45-58 (1990)
26 Rea M S Towards a model of visual performance: a review of meth- odologies.? Ilium. Eng. Sac. 16(1) 128-142 (1987)
27 Rea M S Practical implications of a new visual performance model Lighring Reg. Technol. l8(3) 113-118 (1986)
28 Wright G A and Rea M S Age, a human factor in lighting Proc. 1984 Inrpmaliaai Cafmolce on Occuporiotonal Ergonairs: Vol. I, Research Reports and Core Sndirr (Toronto, Ontario: Human Factors Associ- ation of Canada) pp 50b512 (1984)
29 Rea M S Lighting measurements and calculation: a view of future practice A~chitecrurol Lighring l(11) 3&31 (1987)
30 Kambich D G and Rea M S New Canadian lighting analysis system Lighting Mogaaiu l(3) 6 1 7 (1987)
M
S
Rea and M J Ouellette31 Rea M S, Ouellette M J and Pasini I lnterlsboratary comparison of contrast measurementJ. Illum. Eng. Sot. 17(2) 61-69 (1988) 32 Res M Sand Jeffrey I G A new luminance and image analysis system
for l i g h h g and vision: I. equipment and calibration J. Illum. Eng. Sor. 19(1) 64-72 (1990)
33 Slarer A I and Perry M J Visual performance under reference and realistic conditions Proe. CIBS Na~ionol Lighring Conforme, Cam- bridge UK pp 2 9 4 3 (1984)
34 McNelis J F Human periormance: a pilot study.7. Illurn. Eng. Sor. 2(3) 190-196 (1973)
35 Krisrofferson A B Visual detection as iduenced by target form in
Dircrimlmria or relored ro milirary problems (Washington DC: National Academy of Sciences) pp 109-127 National Research Council Pub- lication 561 (1957)
36 Dember W N ThePryehologvofparceprion (New York: Holr, Rinehart and Winston) (1965)
37 Carnobell F W and Rabson I G Aoolication of Fourier analvsis . . to
thc varbdic of graungr I . Ph~rtol. 197 151-566 '1968
38 1.cgge G E, Prlll 1) G, Ruhln ti 5 r , nl I'sychopnynss oi read~ng I Normal rlrlon I ' m a Xeredrch 25 2 23Y-252 1485
39 Rubin G S and Sicgel K A Recognitia of low-pnrsfilrored l # t r r and
faces Paper presented at annual meeting of Association far Research in Vision and Ophthalmology, Sarasota, FL (1984)
40 Kambich D G An alrcrnative relative visual performance model.7.
Illum. Eng. Soc. 20(1) 19 (1991)
41 Wyszecki G and Sdes W S Color rcimee concepts and merhods, Q w n -
litolive data and fomulos (New York: John Wiley) (1982)
42 De Grwt S G and Gebhard J W Pupil size asdetermined by adapting luminance 7. 001. Soc. A m . 42(7) 492-495 (1952)
43 Weale R A & h a 1 illumination and age ~ronr.'lllum. Eng. Sor.
(London) 26(2) 95-100 (1961)
44 Weale R A Tho aging eye (London: H K Lewis) (1963)
45 Rea M S Prooosed revision of the IESNA illuminance selection procedure J. lliurn. Eng. Soi. 17(1) 2&28 (1988)
46 McGrath C and Morrison J D The effects of age on s p h l irequency perception in human subiects Qwrrorly3. Expe+mtrol Physial. 66(3) 253-261 (1981)
47 IES lighting handbook Application volume 1987 ed. Kaufman J E (New York: llluminahg Engineering Society of North America) (1987) 49 Orfield S Photometry and luminance disrribution: conventional pho-
tometry versus CapCalc Lighting Design Applic. 20(1) 8-11 (1990)