arXiv:1304.4739v2 [hep-ex] 9 Oct 2013
CERN-PH-EP-2013-036
Submitted to: Eur. Phys. J. C
Measurement of the inclusive jet cross-section in pp collisions
at
√ s
= 2.76 TeV and comparison to the inclusive jet
cross-section at
√ s
= 7 TeV using the ATLAS detector
The ATLAS Collaboration
Abstract
The inclusive jet cross-section has been measured in proton-proton collisions at
√
s = 2.76 TeV
in
a dataset corresponding to an integrated luminosity of
0.20
pb
−1collected with the ATLAS detector at
the Large Hadron Collider in 2011. Jets are identified using the anti-
k
talgorithm with two radius
pa-rameters of
0.4
and
0.6
. The inclusive jet double-differential cross-section is presented as a function of
the jet transverse momentum
p
Tand jet rapidity
y
, covering a range of
20 ≤ p
T<
430 GeV
and
|y| < 4.4
.
The ratio of the cross-section to the inclusive jet cross-section measurement at
√
s = 7 TeV
, published
by the ATLAS Collaboration, is calculated as a function of both transverse momentum and the
di-mensionless quantity
x
T= 2p
T/
√
s
, in bins of jet rapidity. The systematic uncertainties on the ratios
are significantly reduced due to the cancellation of correlated uncertainties in the two measurements.
Results are compared to the prediction from next-to-leading order perturbative QCD calculations
cor-rected for non-perturbative effects, and next-to-leading order Monte Carlo simulation. Furthermore,
the ATLAS jet cross-section measurements at
√
s = 2.76 TeV
and
√
s = 7 TeV
are analysed within
a framework of next-to-leading order perturbative QCD calculations to determine parton distribution
functions of the proton, taking into account the correlations between the measurements.
Measurement of the inclusive jet cross-section in pp collisions at
√ s = 2.76 TeV and comparison to the inclusive jet cross-section at
√ s = 7 TeV using the ATLAS detector
The ATLAS Collaboration
1Address(es) of author(s) should be given
October 10, 2013
Abstract The inclusive jet cross-section has been measured
in proton-proton collisions at √s = 2.76 TeV in a dataset
corresponding to an integrated luminosity of 0.20 pb−1
col-lected with the ATLAS detector at the Large Hadron
Col-lider in 2011. Jets are identified using the anti-ktalgorithm
with two radius parameters of 0.4 and 0.6. The inclusive jet double-differential cross-section is presented as a function
of the jet transverse momentum pT and jet rapidity y,
cov-ering a range of 20 ≤ pT < 430 GeV and |y| < 4.4. The
ratio of the cross-section to the inclusive jet cross-section
measurement at √s = 7 TeV, published by the ATLAS
Col-laboration, is calculated as a function of both transverse
mo-mentum and the dimensionless quantity xT = 2pT/√s, in
bins of jet rapidity. The systematic uncertainties on the ra-tios are significantly reduced due to the cancellation of cor-related uncertainties in the two measurements. Results are compared to the prediction from next-to-leading order per-turbative QCD calculations corrected for non-perper-turbative effects, and next-to-leading order Monte Carlo simulation. Furthermore, the ATLAS jet cross-section measurements at √
s = 2.76 TeV and √s = 7 TeV are analysed within a
framework of next-to-leading order perturbative QCD calcu-lations to determine parton distribution functions of the pro-ton, taking into account the correlations between the mea-surements.
Keywords QCD · jet · LHC 1 Introduction
Collimated jets of hadrons are a dominant feature of high-energy particle interactions. In Quantum Chromodynamics (QCD) they can be interpreted in terms of the fragmentation of quarks and gluons produced in a scattering process. The inclusive jet production cross-section provides information on the strong coupling and the structure of the proton, and
tests the validity of perturbative QCD (pQCD) down to the shortest accessible distances.
The inclusive jet cross-section has been measured at high
energy in proton-antiproton (pp) collisions with
√
s = 546 GeV and 630 GeV at the SPS [1–5], and with
√s = 546 GeV, 630 GeV, 1.8 TeV and 1.96 TeV at the Teva-tron [6–22].
The Large Hadron Collider (LHC) [23] at CERN allows the production of jets with transverse momenta in the TeV regime, colliding protons on protons (pp) with a
centre-of-mass energy of currently up to √s = 8 TeV. The ATLAS
Collaboration has presented early measurements of the
in-clusive jet cross-section at √s = 7 TeV based on a dataset
with an integrated luminosity of 17 nb−1for jets with a
trans-verse momentum of 60 ≤ pT < 600 GeV and a
rapid-ity1
of |y| < 2.8 [24], as well as for the entire dataset of
37 pb−1taken in 2010 for jets with 20 ≤ pT <1500 GeV
and |y| < 4.4 [25]. The CMS Collaboration has presented
results in the kinematic range of 18 ≤ pT < 1100 GeV
and |y| < 3 in a dataset of 34 pb−1 [26], in the range of
35 ≤ pT <150 GeV and 3.2 < |y| < 4.7 using 3.1 pb−1[27],
and for 0.1 ≤ pT <2 TeV and |y| < 2.5 using 5.0 fb−1[28].
These data are found to be generally well described by next-to-leading order (NLO) pQCD calculations, corrected for non-perturbative effects from hadronisation and the under-lying event.
At the start of the 2011 data taking period of the LHC, the ATLAS experiment collected pp collision data at √
s = 2.76 TeV corresponding to an integrated
luminos-ity of 0.20 pb−1. Having a centre-of-mass energy close to
the highest energies reached in pp collisions, the dataset provides a connection from LHC measurements to previ-ous measurements at the Tevatron. Moreover, measurements
1Rapidity is defined as y = 0.5 ln[(E + p
z)/(E − pz)] where E
denotes the energy and pzis the component of the momentum along
with the same detector at different centre-of-mass energies provide stringent tests of the theory, since the dominant sys-tematic uncertainties are correlated. These correlations can be explored in a common fit to the measurements at differ-ent √s or in ratios of the inclusive jet double-differential
cross-sections. Hence, uncertainties can be significantly re-duced. Such ratios were reported by previous experiments, UA2 [2], UA1 [4], CDF [7, 9] and D0 [12].
In this paper the inclusive jet double-differential
cross-section is measured for 20 ≤ pT <430 GeV and rapidities
of |y| < 4.4 at √s = 2.76 TeV. Moreover, the ratio to the
previously measured cross-section at √s = 7 TeV [25] is
determined as a function of pT and as a function of the
di-mensionless quantity xT= 2pT/√s [29]. For the ratio
mea-sured as a function of pT, many experimental systematic
un-certainties cancel, while for the ratio measured as a function
of xT, theoretical uncertainties are reduced. This allows a
precise test of NLO pQCD calculations.
The outline of the paper is as follows. The definition of the jet cross-section is given in the next section, followed by a brief description of the ATLAS detector in Sect. 3 and the data taking in Sect. 4. The Monte Carlo simulation, the the-oretical predictions and the uncertainties on the predictions are described in Sects. 5 and 6, followed by the event selec-tion in Sect. 7 and the jet reconstrucselec-tion and calibraselec-tion in Sect. 8. The unfolding of detector effects and the treatment of systematic uncertainties are discussed in Sects. 9 and 10, followed by the results of the inclusive jet cross-section at √
s = 2.76 TeV in Sect. 11. The results of the ratio
measure-ment, including the discussion of its uncertainties, are pre-sented in Sect. 12. In Sect. 13 the results of an NLO pQCD fit to these data are discussed. The conclusion is given in Sect. 14.
2 Definition of the measured variables 2.1 Inclusive single-jet cross-section
Jets are identified using the anti-kt algorithm [30]
imple-mented in the FastJet [31, 32] software package. Two dif-ferent values of the radius parameter, R = 0.4 and R = 0.6, are used. Inputs to the jet algorithm can be partons in the NLO pQCD calculation, stable particles after the hadroni-sation process in the Monte Carlo simulation, or energy de-posits in the calorimeter in data.
Throughout this paper, the jet cross-section refers to the cross-section of jets built from stable particles, defined by having a proper mean lifetime of cτ > 10 mm. Muons and neutrinos from decaying hadrons are included in this defini-tion.
The inclusive jet double-differential cross-section,
d2σ/d pTdy, is measured as a function of the jet transverse
momentum pTin bins of rapidity y. The kinematic range of
the measurement is 20 ≤ pT <430 GeV and |y| < 4.4.
The jet cross-section is also measured as a function of
the dimensionless quantity xT. For a pure 2 → 2 central
scattering of the partons, xTgives the momentum fraction of
the initial-state partons with respect to the parent proton.
2.2 Ratio of jet cross-sections at different centre-of-mass energies
The inclusive jet double-differential cross-section can be re-lated to the invariant cross-section according to
Ed 3σ d p3 = 1 2πpT d2σ d pTdy , (1)
where E and p denote the energy and momentum of the jet, respectively. The dimensionless scale-invariant cross-section
F(y, xT) can be defined as [33]:
F(y, xT, √ s) = p4TEd 3σ d p3 = p3 T 2π d2σ d pTdy = s 8πx 3 T d2σ dxTdy . (2) In the simple quark-parton model [34, 35], F does not de-pend on the centre-of-mass energy, as follows from dimen-sional analysis. In QCD, however, several effects lead to a
violation of the scaling behaviour, introducing a pT(or √s)
dependence to F. The main effects are the scale dependence of the parton distribution functions (PDFs) and the strong
coupling constant αS.
The cross-section ratio of the invariant jet cross-section
measured at √s = 2.76 TeV to the one measured at √s =
7 TeV is then denoted by:
ρ(y, xT) =
F(y, xT,2.76 TeV)
F(y, xT,7 TeV)
. (3)
The violation of the√s scaling leads to a deviation of ρ(y, xT)
from one. ρ(y, xT) is calculated by measuring the bin-averaged
inclusive jet double-differential cross-sections at the two
centre-of-mass energies in the same xTranges:
ρ(y, xT) =
2.76 TeV 7 TeV
!3
·σσ(y, x(y, xT,2.76 TeV)
T,7 TeV)
, (4)
where σ(y, xT,√s) corresponds to the measured averaged
cross-section d2σ/d p
Tdy in a bin (y, pT= √s· xT/2), and xT
is chosen to be at the bin centre. Here, the pTbinning for the
inclusive jet cross-section at √s = 2.76 TeV is chosen such
that it corresponds to the same xTranges obtained from the
pTbins of the jet cross-section measurement at √s = 7 TeV.
The bin boundaries are listed in Appendix A.
The ratio of inclusive double-differential cross-sections
binning is used for both centre-of-mass energies. This ratio is denoted by ρ(y, pT) = σ(y, pT,2.76 TeV) σ(y, pT,7 TeV) , (5)
where σ(y, pT,√s) is the measured averaged cross-section
d2σ/d pTdy in a bin (y, pT) at a centre-of-mass energy of√s.
Since the uncertainty due to the jet energy scale is the
domi-nant experimental uncertainty at a given pT, the
experimen-tal systematic uncertainty is significantly reduced by taking
the cross-section ratio in the same pTbins.
3 The ATLAS detector
The ATLAS detector consists of a tracking system (inner detector) in a 2 T axial magnetic field up to a
pseudora-pidity2of |η| = 2.5, sampling electromagnetic and hadronic
calorimeters up to |η| = 4.9, and muon chambers in an az-imuthal magnetic field provided by a system of toroidal mag-nets. A detailed description of the ATLAS detector can be found elsewhere [36].
The inner detector consists of layers of silicon pixel de-tectors, silicon microstrip detectors and transition radiation tracking detectors. It is used in this analysis to identify can-didate collision events by constructing vertices from tracks. Jets are reconstructed using the energy deposits in the calo-rimeter, whose granularity and material varies as a function of η. The electromagnetic calorimeter uses lead as an ab-sorber, liquid argon (LAr) as the active medium and has a fine granularity. It consists of a barrel (|η| < 1.475) and an endcap (1.375 < |η| < 3.2) region. The hadronic calorimeter is divided into three distinct regions: a barrel region (|η| < 0.8) and an extended barrel region (0.8 < |η| < 1.7) instru-mented with a steel/scintillating-tile modules, and an end-cap region (1.5 < |η| < 3.2) using copper/LAr modules. Finally, the forward calorimeter (3.1 < |η| < 4.9) is instru-mented with copper/LAr and tungsten/LAr modules to pro-vide electromagnetic and hadronic energy measurements, respectively.
The ATLAS trigger system is composed of three consec-utive levels: level 1, level 2 and the event filter, with progres-sively increasing computing time per event, finer granularity and access to more detector systems. For jet triggering, the relevant systems are the minimum bias trigger scintillators (MBTS), located in front of the endcap cryostats covering 2.1 < |η| < 3.8, as well as calorimeter triggers for cen-tral jets, covering |η| < 3.2, and for forward jets, covering 3.1 < |η| < 4.9, respectively.
2ATLAS uses a right-handed coordinate system with its origin at
the nominal interaction point (IP) in the centre of the detector and the
z-axis along the beam pipe. The x-axis points from the IP to the centre
of the LHC ring, and the y-axis points upward. The pseudorapidity is defined in terms of the polar angle θ as η = − ln tan(θ/2).
4 Data taking
The proton-proton collision data at √s = 2.76 TeV were
collected at the start of the 2011 data taking period of the LHC. The total integrated luminosity of the collected data is
0.20 pb−1. The proton bunches were grouped in nine bunch
trains. The time interval between two consecutive bunches was 525 ns. The average number of interactions per bunch crossing is found to be µ = 0.24. All events used in this analysis were collected with good operational status of the relevant detector components for jet measurements.
The data at √s = 7 TeV have a total integrated
luminos-ity of 37 pb−1. Further details are given in Ref. [25].
5 Monte Carlo simulation
Events used in the simulation of the detector response are produced by the Pythia 6.423 generator [37], using the MRST 2007 LO* PDFs [38]. The generator utilises leading-order (LO) pQCD matrix elements for 2 → 2 processes, along
with a leading-logarithmic pT-ordered parton shower [39],
an underlying event simulation with multiple parton interac-tions [40], and the Lund string model for hadronisation [41]. The event generation uses the ATLAS Minimum Bias Tune 1 (AMBT1) set of parameters [42]. Additional proton-proton collisions occurring in the same bunch crossing have not been simulated because the average number of interactions per beam crossing is so small.
The Geant software toolkit [43] within the ATLAS sim-ulation framework [44] simulates the propagation of the gen-erated particles through the ATLAS detector and their inter-actions with the detector material.
The Herwig++ 2.5.1 [45, 46] generator is used in addi-tion to Pythia in the evaluaaddi-tion of non-perturbative effects in the theory prediction. It is based on the 2 → 2 LO pQCD matrix elements and a leading-logarithmic angular-ordered parton shower [47]. The cluster model [48] is used for the hadronisation, and an underlying event simulation is based on the eikonal model [49].
6 Theoretical predictions 6.1 NLO pQCD prediction
The NLO pQCD predictions are calculated using the NLO-JET++ 4.1.2 [50] program. For fast and flexible calcula-tions with various PDFs and factorisation and renormalisa-tion scales, the APPLgrid software [51] is interfaced with
NLOJET++. The renormalisation scale, µR, and the
factori-sation scale, µF, are chosen for each event as µR = µF =
mo-mentum found in a rapidity bin yi. If jets are present in dif-ferent rapidity bins, several scales within the event are used. The default calculation uses the CT10 [52] PDF set. Pre-dictions using the PDF sets MSTW 2008 [53], NNPDF 2.1
(100) [54,55], HERAPDF 1.5 [56] and ABM 11 NLO (nf =
5) [57] are also made for comparison. The value for αSis
taken from the corresponding PDF set.
Three sources of uncertainty in the NLO pQCD calcu-lation are considered, namely the uncertainty on the PDF sets, the choice of factorisation and renormalisation scales, and the uncertainty on the value of the strong coupling
con-stant, αS. The PDF uncertainty is defined at 68% confidence
level (CL) and evaluated following the prescriptions given for each PDF set and the PDF4LHC recommendations [58]. The uncertainty on the scale choice is evaluated by vary-ing the renormalisation scale and the factorisation scale by a factor of two with respect to the original choice in the cal-culation. The considered variations are
( fµR,fµF) =(0.5, 0.5), (0.5, 1), (1, 0.5),
(1, 2), (2, 1), (2, 2), (6)
where fµR and fµF are factors for the variation of
renormal-isation and factorrenormal-isation scales, hence µR = fµR· p
max
T and
µF = fµF · p
max
T . The envelope of the resulting variations
is taken as the scale uncertainty. The uncertainty
reflect-ing the αSmeasurement precision is evaluated following the
recommendation of the CTEQ group [59], by calculating the cross-section using a series of PDFs which are derived
with various fixed αS values. Electroweak corrections are
not included in the theory predictions. The effect is found
to be O(10%) at high pT, and negligible at small pT for
√s = 7 TeV [60].
The theoretical predictions for the cross-section ratios
at the two different energies, ρ(y, xT) or ρ(y, pT), are also
obtained from the NLO pQCD calculations. The evaluation
of the prediction at √s = 7 TeV is given in Ref. [25], and
the procedure is identical to the one used for √s = 2.76 TeV
in the present analysis. Hence, the uncertainty on the ratio is determined using the same variation in each component of
the considered uncertainties simultaneously for both √s =
2.76 TeV and √s = 7 TeV cross-section predictions.
6.2 Non-perturbative corrections
The fixed-order NLO pQCD calculations, described in Sect. 6.1, predict the parton-level cross-section, which should be corrected for non-perturbative effects before comparison with the measurement at particle level. The corrections are derived using LO Monte Carlo event generators comple-mented by the leading-logarithmic parton shower by eval-uating the bin-wise ratio of the cross-section with and with-out hadronisation and the underlying event. Each bin of the
NLO pQCD cross-section is then multiplied by the corre-sponding correction for non-perturbative effects. The base-line correction factors are obtained from Pythia 6.425 [37] with the AUET2B CTEQ6L1 tune [61]. The uncertainty is estimated as the envelope of the correction factors obtained from a series of different generators and tunes: Pythia 6.425 using the tunes AUET2B LO** [61], AUET2 LO** [62], AMBT2B CTEQ6L1 [61], AMBT1 [42], Perugia 2010 [63] and Perugia 2011 [63]; Pythia 8.150 [64] with tune 4C [61]; and Herwig++ 2.5.1 [45] with tune UE7000-2 [61]. The AMBT2B CTEQ6L1 and AMBT1 tunes, which are based on observables sensitive to the modelling of minimum bias interactions, are included to provide a systematically different estimate of the underlying event activity.
The NLO pQCD prediction for the cross-section ratio also needs corrections for non-perturbative effects. The same procedure is used to evaluate non-perturbative corrections
for the cross-section at √s = 7 TeV using the same series of
generator tunes. A ratio of corrections at√s = 2.76 TeV and
√
s = 7 TeV is calculated for each generator tune. As for the
cross-section, Pythia 6.425 with the AUET2B CTEQ6L1 tune is used as the central value of the correction factor for the cross-section ratio and the envelope of the correction fac-tors from the other tunes is taken as an uncertainty.
6.3 Predictions from NLO matrix elements with parton-shower Monte Carlo simulation
The measured jet cross-section is also compared to predic-tions from Powheg jet pair production, revision 2169 [65, 66]. Powheg is an NLO generator that uses the Powheg Box 1.0 package [67–69], which can be interfaced to different Monte Carlo programs to simulate the parton shower, the hadronisation and the underlying event. This simulation us-ing a matched parton shower is expected to produce a more accurate theoretical prediction. However, ambiguities in the
matching procedure, non-optimal tuning of parton
shower-parameters, and the fact that it is a hybrid between an NLO matrix element calculation and the currently avail-able LO parton-shower generators may introduce additional theoretical uncertainties.
In the Powheg algorithm, each event is built by first pro-ducing a QCD 2 → 2 partonic scattering. The renormali-sation and factorirenormali-sation scales for the fixed-order NLO pre-diction are set to be equal to the transverse momentum of
the outgoing partons, pBorn
T . In addition to the hard
scat-ter, Powheg also generates the hardest partonic emission in the event. The event is evolved to the particle level using a parton-shower event generator, where the radiative emis-sions in the parton showers are limited by the matching
scale µMprovided by Powheg. The simulation of parton
show-ers uses Pythia with the ATLAS underlying event tunes, AUET2B [61] and Perugia 2011 [63]. The tunes are derived
from the standalone versions of these event generators, with no optimisation for the Powheg predictions. The CT10 PDF set is used in both Powheg and Pythia.
To avoid fluctuations in the final observables after the showering process, the Powheg event generation is
perfor-med using a new option3that became available recently [66].
For pT < 100 GeV, this new prediction differs by O(10%)
from the Powheg prediction at √s = 7 TeV from the
pre-vious analysis, which followed a different approach [25]. The uncertainty from the renormalisation and factorisation scales for the Powheg prediction is expected to be similar to that obtained with NLOJET++. The matching scale can po-tentially have a large impact on the cross-section prediction at particle level, affecting the parton shower, initial-state ra-diation and multiple interactions, but a procedure to estimate this uncertainty is currently not well defined. Therefore no uncertainties are shown for the Powheg curves.
6.4 Prediction for the inclusive jet cross-section at √s = 2.76 TeV
The evaluated relative uncertainties of the NLO pQCD
cal-culation for the inclusive jet cross-section at √s = 2.76 TeV
are shown in Fig. 1 as a function of the jet pTfor
representa-tive rapidity bins and R = 0.6. In the central rapidity region,
the uncertainties are about 5% for pT.100 GeV, increasing
to about 15% in the highest jet pTbin. In the most forward
region, they are 10% in the lowest pTbin and up to 80% in
the highest pTbin. In the higher pTregion, the upper bound
on the uncertainty is driven by the PDF uncertainty, while
the lower bound and the uncertainty at low pT are
domi-nated by the scale choice. The uncertainties for R = 0.4 are similar.
The correction factors for non-perturbative effects and their uncertainties are shown in Fig. 2 for the inclusive jet
cross-section at √s = 2.76 TeV in the central rapidity bin.
For jets with R = 0.4, the correction is about −10% in the
lowest pTbin, while for jets with R = 0.6, it is about +20%
as a result of the interplay of the hadronisation and the
un-derlying event for the different jet sizes. In the high-pT
re-gion, the corrections are almost unity for both jet radius pa-rameters, and the uncertainty is at the level of ±2%.
3The origin of these fluctuations are rare event topologies in gluon
emissions q → qg and gluon splittings g → q ¯q, related to the fact that by default Powheg Box 1.0 does not consider the corresponding configurations with opposite ordering of the pTfor the final state
par-ton: q → gq and g → ¯qq. These processes can be activated in re-vision 2169 using the Powheg option doublefsr=1, which offers an improved handling of the suppression of these events. More details are given in Ref. [66].
6.5 Prediction for the cross-section ratio
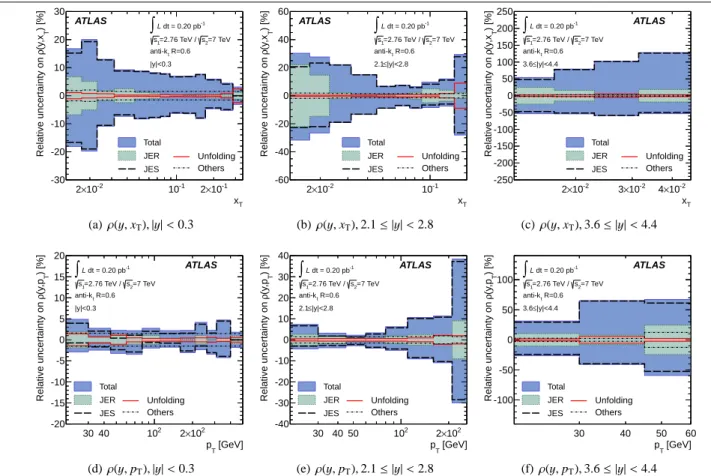
Figs. 3(a)–(c) show the uncertainty on the NLO pQCD
cal-culation of ρ(y, xT) in representative rapidity bins for R =
0.6. They are significantly reduced to a level of a few per-cent in the per-central rapidity region compared to the uncer-tainties on the cross-sections shown in Fig. 1. The dominant
uncertainty at low pT is the uncertainty on the
renormali-sation and factorirenormali-sation scale choice, while at high pT the
uncertainty due to the PDF contributes again significantly.
The NLO pQCD calculation of ρ(y, pT) has an uncertainty
of less than ±5% for pTup to 200 GeV in the central rapidity
region, as shown in Fig. 3(d). The uncertainty increases for
higher pT of the jet due mostly to the uncertainties on the
PDFs, which are below 10% for central jets. In the forward
region, it reaches up to 80% in the highest pTbins, as shown
in Figs. 3(e) and 3(f). The corresponding uncertainties for jets with R = 0.4 are similar, except for a larger contribution
due to the scale choice in the uncertainty on ρ(y, pT).
Non-perturbative corrections to ρ(y, xT) have a different
xTdependence for jets with R = 0.4 and R = 0.6, as shown
in Figs. 4(a) and 4(b). The behaviour of ρ(y, xT) is driven
by the corrections for the cross-section at √s = 2.76 TeV
since p7 TeV
T = (7/2.76) · p 2.76 TeV
T in the same xT bins (see
Appendix A) and since the non-perturbative correction is
al-most flat in the high-pT region. For jets with R = 0.4, the
correction is −10% in the lowest xT bin. For R = 0.6, the
correction in this region is in the opposite direction, increas-ing the prediction by +10%. The uncertainty in the lowest
xT bin for both radius parameters is ∼ ±10%. The
non-perturbative corrections to ρ(y, pT) are shown in Figs. 4(c)
and 4(d), where a similar pT dependence for R = 0.4 and
R = 0.6 is found. They amount to −10% for jets with R = 0.4
and −25% for jets with R = 0.6 in the lowest pTbins. This
is due to the correction factors for the NLO pQCD
predic-tion at √s = 7 TeV [25] being larger than those at √s =
2.76 TeV. Corrections obtained from Pythia with various tunes generally agree within 5% for central jets, while the non-perturbative corrections from Herwig++ deviate from the ones of the Pythia tunes by more than 10% in the lowest
pTbin.
7 Event selection
Events are selected online using various trigger definitions
according to the pTand the rapidity y of the jets [70]. In the
lowest pT region (pT <35 GeV for |y| < 2.1, pT <30 GeV
for 2.1 ≤ |y| < 2.8, pT < 28 GeV for 2.8 ≤ |y| < 3.6, and
pT < 26 GeV for 3.6 ≤ |y| < 4.4), a trigger requiring at
least two hits in the MBTS is used. For the higher pTregion,
jet-based triggers are used, which select events that contain a jet with sufficient transverse energy at the electromagnetic
[GeV] T p 30 40 102 2×10² Relative uncertainty [%] -30 -20 -10 0 10 20 ATLAS Total Scale choice PDF S α NLO pQCD (CT10) = 2.76 TeV s R=0.6 t anti-k |y|<0.3 Simulation (a) |y| < 0.3 [GeV] T p 30 40 50 102 2×10² Relative uncertainty [%] -80 -60 -40 -20 0 20 40 60 80 ATLAS Total Scale choice PDF S α NLO pQCD (CT10) = 2.76 TeV s R=0.6 t anti-k |y|<2.8 ≤ 2.1 Simulation (b) 2.1 ≤ |y| < 2.8 [GeV] T p 30 40 50 60 Relative uncertainty [%] -100 -80 -60 -40 -20 0 20 40 60 80 ATLAS Total Scale choice PDF S α NLO pQCD (CT10) = 2.76 TeV s R=0.6 t anti-k |y|<4.4 ≤ 3.6 Simulation (c) 3.6 ≤ |y| < 4.4
Fig. 1 The uncertainty in the NLO pQCD prediction of the inclusive jet cross-section at √s = 2.76 TeV, calculated using NLOJET++ with the
CT10 PDF set, for anti-ktjets with R = 0.6 shown in three representative rapidity bins as a function of the jet pT. In addition to the total uncertainty,
the uncertainties from the scale choice, the PDF set and the strong coupling constant, αS, are shown separately.
[GeV] T p 20 30 40 102 2×10² Non-perturbative correction 0.8 0.9 1 1.1 1.2 1.3 ATLASSimulation
Pythia 6 AMBT2B CTEQ6L1 Pythia 6 AUET2B LO** Pythia 6 Perugia 2010 Pythia 8 4C
Herwig++ 2.5.1 UE7000-2 Pythia 6 AUET2B CTEQ6L1 Uncertainty = 2.76 TeV s R=0.4 t anti-k |y|<0.3 (a) R = 0.4 [GeV] T p 20 30 40 102 2×10² Non-perturbative correction 0.8 0.9 1 1.1 1.2 1.3 ATLASSimulation
Pythia 6 AMBT2B CTEQ6L1 Pythia 6 AUET2B LO** Pythia 6 Perugia 2010 Pythia 8 4C
Herwig++ 2.5.1 UE7000-2 Pythia 6 AUET2B CTEQ6L1 Uncertainty = 2.76 TeV s R=0.6 t anti-k |y|<0.3 (b) R = 0.6
Fig. 2 Non-perturbative correction factors for the inclusive jet cross-section for anti-kt jets with (a) R = 0.4 and (b) R = 0.6 in the jet rapidity
region |y| < 0.3 as a function of the jet pTfor Monte Carlo simulations with various tunes. The correction factors derived from Pythia 6 with the
AUET2B CTEQ6L1 tune (full-square) are used for the NLO pQCD prediction in this measurement, with the uncertainty indicated by the shaded area. For better visibility, some tunes used in the uncertainty determination are not shown.
scale4. The efficiency of the jet-based triggers is determined
using the MBTS, and the one for MBTS using the indepen-dent trigger from the Zero Degree Calorimeter [71]. Only
triggers that are > 99% efficient for a given jet pTvalue are
used. In the region 2.8 < |y| < 3.6, both a central and a forward jet trigger are used in combination to reach an effi-ciency of > 99%. Events are required to have at least one
4The electromagnetic scale is the basic calorimeter signal scale
for the ATLAS calorimeter. It has been established using test-beam measurements for electrons and muons to give the correct response for the energy deposited in electromagnetic showers, but it does not correct for the lower response of the calorimeter to hadrons.
well-reconstructed event vertex, which must have at least
three associated tracks with a minimum pTof 150 MeV.
8 Jet reconstruction and calibration
The reconstruction procedure and the calibration factors for
the jet cross-section measurement at √s = 2.76 TeV are
nearly identical to those used for the measurement at √s =
7 TeV with 2010 data [25]; the few exceptions are explicitly specified below.
Jets are reconstructed with the anti-kt algorithm using
de-T x -2 10 × 2 10-1 2×10⁻¹ ) [%] T (y ,x ρ Relative uncertainty on -10 -8 -6 -4 -2 0 2 4 6 8 ATLAS Total Scale choice PDF S α NLO pQCD (CT10) =7 TeV 2 s =2.76 TeV / 1 s R=0.6 t anti-k |y|<0.3 Simulation
(a) ρ(y, xT), |y| < 0.3
T x -2 10 × 2 10-1 ) [%] T (y ,x ρ Relative uncertainty on -10 -8 -6 -4 -2 0 2 4 6 8 ATLAS Total Scale choice PDF S α NLO pQCD (CT10) =7 TeV 2 s =2.76 TeV / 1 s R=0.6 t anti-k |y|<2.8 ≤ 2.1 Simulation (b) ρ(y, xT), 2.1 ≤ |y| < 2.8 T x -2 10 × 2 3×10⁻² 4×10⁻² ) [%] T (y ,x ρ Relative uncertainty on -20 -15 -10 -5 0 5 10 15 ATLAS Total Scale choice PDF S α NLO pQCD (CT10) =7 TeV 2 s =2.76 TeV / 1 s R=0.6 t anti-k |y|<4.4 ≤ 3.6 Simulation (c) ρ(y, xT), 3.6 ≤ |y| < 4.4 [GeV] T p 30 40 102 2×10² ) [%]T (y ,p ρ Relative uncertainty on -20 -15 -10 -5 0 5 10 15 20 ATLAS Total Scale choice PDF S α NLO pQCD (CT10) =7 TeV 2 s =2.76 TeV / 1 s R=0.6 t anti-k |y|<0.3 Simulation (d) ρ(y, pT), |y| < 0.3 [GeV] T p 30 40 50 102 2×10² ) [%]T (y ,p ρ Relative uncertainty on -80 -60 -40 -20 0 20 40 60 80 ATLAS Total Scale choice PDF S α NLO pQCD (CT10) =7 TeV 2 s =2.76 TeV / 1 s R=0.6 t anti-k |y|<2.8 ≤ 2.1 Simulation
(e) ρ(y, pT), 2.1 ≤ |y| < 2.8
[GeV] T p 30 40 50 60 ) [%] T (y ,p ρ Relative uncertainty on -80 -60 -40 -20 0 20 40 60 80 ATLAS Total Scale choice PDF S α NLO pQCD (CT10) =7 TeV 2 s =2.76 TeV / 1 s R=0.6 t anti-k |y|<4.4 ≤ 3.6 Simulation (f) ρ(y, pT), 3.6 ≤ |y| < 4.4
Fig. 3 The uncertainty in the NLO pQCD prediction of the cross-section ratio ρ(y, xT) ((a)–(c)) and ρ(y, pT) ((d)–(f)), calculated using NLOJET++
with the CT10 PDF set, for anti-kt jets with R = 0.6 shown in three representative rapidity bins as a function of the jet xT and of the jet pT,
respectively. In addition to the total uncertainty, the uncertainties from the scale choice, the PDF set and the strong coupling constant, αS, are
shown separately.
posits in the calorimeter, calibrated at the electromagnetic scale. The four-momenta of the reconstructed jets are cor-rected event-by-event using the actual vertex position. A jet energy scale (JES) correction is then applied to correct for detector effects such as energy loss in dead material in front of the calorimeter or between calorimeter segments, and to compensate for the lower calorimeter response to hadrons than to electrons or photons [72, 73]. Due to the low num-ber of interactions per bunch crossing, an offset correction accounting for additional energy depositions from multiple interactions in the same bunch crossing, so-called pile-up, is not applied in this measurement.
The estimation of the uncertainty in the jet energy mea-surement uses single-hadron calorimeter response measure-ments [74] and systematic Monte Carlo simulation varia-tions. An uncertainty of about 2.5% in the central
calorime-ter region over a wide momentum range of 60 ≤ pT <
800 GeV is obtained [73]. For jets with lower pT and for
forward jets the uncertainties are larger.
All reconstructed jets with pT >20 GeV, |y| < 4.4 and
a positive decision from the trigger that is used in the
cor-responding jet kinematic region are considered in this anal-ysis. Jets are furthermore required to pass jet quality selec-tions to reject fake jets reconstructed from non-collision sig-nals, such as beam-related background, cosmic rays or de-tector noise. The applied selections were established with the √s = 7 TeV data in 2010 [25,73] and are validated in the
√
s = 2.76 TeV data by studying distributions of the
selec-tion variables with techniques similar to those in Ref. [73]. The rate of fake jets after the jet selection is negligible.
The efficiency of the jet quality selection is measured using a tag-and-probe method [73]. The largest inefficiency
is found to be below 4% for jets with pT = 20 GeV. Within
the statistical uncertainty, the measured efficiency is in good
agreement with the efficiency previously measured for√s =
7 TeV data in 2010. Because of the larger number of events
in the 2010 data at √s = 7 TeV, the jet selection efficiency
from the 2010 data is taken.
Various types of validity and consistency checks have been performed on the data, such as testing the expected in-variance of the jet cross-section as a function of φ, or the stability of the jet yield over time. No statistically
signifi-T x -2 10 × 2 10-1 2×10⁻¹ ) T (y ,x ρ Non-perturbative correction on 0.6 0.7 0.8 0.9 1 1.1 ATLAS Simulation
Pythia 6 AMBT2B CTEQ6L1 Pythia 6 AUET2B LO** Pythia 6 Perugia 2010 Pythia 8 4C
Herwig++ 2.5.1 UE7000-2 Pythia 6 AUET2B CTEQ6L1 Uncertainty =7 TeV 2 s =2.76 TeV / 1 s R=0.4 t anti-k |y|<0.3 (a) ρ(y, xT), R = 0.4 T x -2 10 × 2 10-1 2×10⁻¹ ) T (y ,x ρ Non-perturbative correction on 0.6 0.7 0.8 0.9 1 1.1 ATLAS Simulation
Pythia 6 AMBT2B CTEQ6L1 Pythia 6 AUET2B LO** Pythia 6 Perugia 2010 Pythia 8 4C
Herwig++ 2.5.1 UE7000-2 Pythia 6 AUET2B CTEQ6L1 Uncertainty =7 TeV 2 s =2.76 TeV / 1 s R=0.6 t anti-k |y|<0.3 (b) ρ(y, xT), R = 0.6 [GeV] T p 30 40 102 2×10² ) T (y ,p ρ Non-perturbative correction on 0.6 0.7 0.8 0.9 1 1.1 ATLASSimulation
Pythia 6 AMBT2B CTEQ6L1 Pythia 6 AUET2B LO** Pythia 6 Perugia 2010 Pythia 8 4C
Herwig++ 2.5.1 UE7000-2 Pythia 6 AUET2B CTEQ6L1 Uncertainty =7 TeV 2 s =2.76 TeV / 1 s R=0.4 t anti-k |y|<0.3 (c) ρ(y, pT), R = 0.4 [GeV] T p 30 40 102 2×10² ) T (y ,p ρ Non-perturbative correction on 0.6 0.7 0.8 0.9 1 1.1 ATLASSimulation
Pythia 6 AMBT2B CTEQ6L1 Pythia 6 AUET2B LO** Pythia 6 Perugia 2010 Pythia 8 4C
Herwig++ 2.5.1 UE7000-2 Pythia 6 AUET2B CTEQ6L1 Uncertainty =7 TeV 2 s =2.76 TeV / 1 s R=0.6 t anti-k |y|<0.3 (d) ρ(y, pT), R = 0.6
Fig. 4 Non-perturbative correction factors for the cross-section ratios, ρ(y, xT) and ρ(y, pT), for anti-ktjets with R = 0.4 or R = 0.6 shown for a
jet rapidity of |y| < 0.3 for Monte Carlo simulations with various tunes as a function of the jet xTand of the jet pT, respectively. The correction
factors derived from Pythia 6 with the AUET2B CTEQ6L1 tune (full-square) are used for the NLO pQCD prediction in this measurement, with the uncertainty indicated by the shaded area. For better visibility, some tunes used in the uncertainty determination are not shown.
cant variations are detected. The basic kinematic variables are described by the Monte Carlo simulation within the sys-tematic uncertainties.
9 Unfolding of detector effects
Corrections for the detector inefficiencies and resolutions are performed to extract the particle-level cross-section,
based on a transfer matrix that relates the pT of the jet at
particle-level and the reconstruction-level.
For the unfolding, the Iterative, Dynamically Stabilised (IDS) Bayesian unfolding method [75] is used. The method takes into account the migrations of events across the bins and uses data-driven regularisation. It is performed
sepa-rately for each rapidity bin, since migrations across pTbins
are significant. The migrations across rapidity bins, which are much smaller, are taken into account using the bin-by-bin unfolding.
The Monte Carlo simulation to derive the transfer ma-trix is described in Sect. 5. The Monte Carlo samples are
ra-pidity. The reweighting factors are obtained from the ratio of calculated cross-sections using the MSTW 2008 NLO PDF set [53] with respect to the MRST 2007 LO* PDF set [38].
This improves the description of the jet pT distribution in
data. Additionally, a jet selection similar to the jet quality
criteria in data is applied to jets with low pT in the Monte
Carlo simulation at |η| ∼ 1.
The transfer matrix for the jet pTis derived by matching
a particle-level jet to a reconstructed jet based on a geometri-cal criterion, in which a particle-level jet and a reconstructed
jet should be closest to each other within a radius of R′= 0.3
in the (η, φ)-plane. The spectra of unmatched particle-level and reconstructed jets are used to provide the matching ef-ficiencies, obtained from the number of the matched jets di-vided by the number of all jets including unmatched jets,
both for particle-level jets, ǫpart, and for reconstructed jets,
ǫreco.
The data are unfolded to particle level using a three-step procedure, namely, correction for matching inefficiency at reconstructed level, unfolding for detector effects and then correction for matching inefficiency at particle level. The fi-nal result is given by the equation:
Nipart =X
j
Nrecoj · ǫrecoj Ai j/ǫ part
i , (7)
where i and j are the particle-level and reconstructed bin
indices, respectively, and Nkpartand Nreco
k are the number of
particle-level jets and the number of reconstructed jets in
bin k. Ai j is an unfolding matrix, which gives the
probabil-ity for a level jet with a certain
reconstructed-level pT to have a given particle-level pT. It is determined
using the IDS method. The number of iterations is chosen such that the bias in the closure test (see below) is small and at most at the percent level. In this measurement, this is achieved after one iteration.
The precision of the unfolding technique has been stud-ied using a data-driven closure test [75]. In this study the
particle-level pTspectrum in the Monte Carlo simulation is
reweighted and convolved through the folding matrix, which gives the probability for a particle-level jet with a certain
particle-level pTto have a given reconstructed-level pT. The
weights are chosen such that significantly improved agree-ment between the resulting reconstructed spectrum and data is attained. The reconstructed spectrum in this reweighted Monte Carlo simulation is then unfolded using the same pro-cedure as for the data. Comparison of the spectrum obtained from the unfolding with the original reweighted particle-level spectrum provides an estimate of the bias, which is interpreted as the systematic uncertainty.
As an estimate of further systematic uncertainties, the unfolding procedure is repeated using different transfer ma-trices created with tighter and looser matching criteria of
R′ = 0.2 and R′ = 0.4. The deviations of the results from
the nominal unfolding result are considered as an additional uncertainty on the unfolding procedure.
The statistical uncertainties are propagated through the unfolding by performing pseudo-experiments. An ensem-ble of pseudo-experiments is created in which each bin of the transfer matrix is varied according to its statistical un-certainty from the Monte Carlo samples. A separate set of pseudo-experiments is performed in which the data spec-trum is fluctuated according to the statistical uncertainty tak-ing the correlation between jets produced in the same event into account. The unfolding is then applied to each pseudo-experiment, and the resulting ensembles are used to calcu-late the covariance matrix of the corrected spectrum, from which the uncertainties are obtained.
The unfolding procedure is repeated for the propagation of the uncertainties on the jet energy and angle measure-ments, as described in the next section.
10 Systematic uncertainties on the cross-section measurement
The following sources of systematic uncertainty are consid-ered in this measurement: the trigger efficiency, jet recon-struction and calibration, the unfolding procedure and the luminosity measurement.
An uncertainty on the trigger efficiency of 1% is conser-vatively chosen for most of the kinematic region (|y| < 2.8;
pT ≥ 45 GeV in 2.8 ≤ |y| < 3.6; and pT ≥ 30 GeV in
3.6 ≤ |y| < 4.4). A 2% systematic uncertainty is assigned
for jets with pT <45 GeV in the region 2.8 ≤ |y| < 3.6 or
with pT <30 GeV in the region 3.6 ≤ |y| < 4.4, as the
trig-gers are used for pT close to the lowest pTpoint with 99%
efficiency for these jets.
The uncertainty on the jet reconstruction efficiency is the
same as in the previous measurement at √s = 7 TeV [25]
and is 2% for pT < 30 GeV and 1% for pT > 30 GeV. It
is evaluated using jets reconstructed from tracks [73]. The uncertainty on the jet selection efficiency from the
measure-ment at √s = 7 TeV is applied in this measurement, but a
minimal uncertainty of 0.5% is retained. The latter accounts for the level of agreement of the central value in the compar-ison between the used jet selection efficiency and the
mea-sured jet selection efficiency at √s = 2.76 TeV.
The uncertainty due to the jet energy calibration is eval-uated using the same uncertainties on the sources as in the
previous measurement at √s = 7 TeV [25]. Effects from the
systematic uncertainty sources are propagated through the unfolding procedure to provide the uncertainties on the mea-sured cross-sections. The JES uncertainty and its sources are described in detail in Ref. [73], where the total JES uncer-tainty is found to be less than 2.5% in the central
14% for pT <30 GeV in the most forward region. The JES
applied to the reconstructed jets in the Monte Carlo simu-lation is varied separately for each JES uncertainty source both up and down by one standard deviation. The resulting
pT spectra are unfolded using the nominal unfolding
ma-trix. The relative shifts with respect to the nominal unfolded spectrum are taken as uncertainties on the cross-section.
The uncertainty on the jet energy resolution (JER) is as-signed by considering the difference between data and Monte Carlo simulation in the estimated JER using in situ tech-niques [76]. The measured resolution uncertainty ranges from 20% to 10% for jets within |y| < 2.8 and with transverse momenta from 30 GeV to 500 GeV. The difference between data and MC is found to be within 10%. The effect of this un-certainty on the cross-section measurement is evaluated by smearing the energy of reconstructed jets in the Monte Carlo simulation such that the resolution is worsened by the one-standard-deviation uncertainty. Then a new transfer matrix is constructed and used to unfold the data spectra. The rela-tive difference between the cross-sections unfolded with the modified transfer matrix and with the nominal one is taken as the uncertainty in the measurement.
The jet angular resolution is estimated in Monte Carlo simulation from the polar angle between the reconstructed jet and its matched jet at particle level. A new transfer ma-trix with angular resolution degraded by 10% is used for the data unfolding, and the relative difference from the nominal unfolded result is assigned as the resulting uncertainty.
The uncertainties in the unfolding procedure are descri-bed in Sect. 9. The closure test and the variation of the match-ing criterion used to construct the transfer matrix are
exam-ined. The impact of a possible mis-modelling of the jet pT
spectrum in the Monte Carlo simulation is assessed in the closure test of the unfolding procedure.
The integrated luminosity is calculated by measuring pp interaction rates with several ATLAS devices. The absolute calibration is derived from van der Meer scans [77, 78]. In total, four scan sessions were performed during the collec-tion of the dataset used in the jet cross-seccollec-tion measurements reported here. The uncertainty in the luminosity determina-tion arises from three main contribudetermina-tions: bunch-populadetermina-tion measurements, beam conditions during the luminosity cali-bration scans, and long-term consistency of the different al-gorithms used to measure the instantaneous luminosity dur-ing data collection. The uncertainty on the luminosity for the 2.76 TeV dataset is ±2.7%, dominated by the irreproducibil-ity of beam conditions during the calibration scans. The total
systematic uncertainty for the 2010 dataset at √s = 7 TeV is
±3.4% [79], dominated by bunch-population measurement uncertainties. Because of significant improvements to the beam instrumentation implemented between the two run-ning periods, and because the dominant systematic
uncer-tainties are of independent origins in the two datasets, these luminosity uncertainties are treated as uncorrelated.
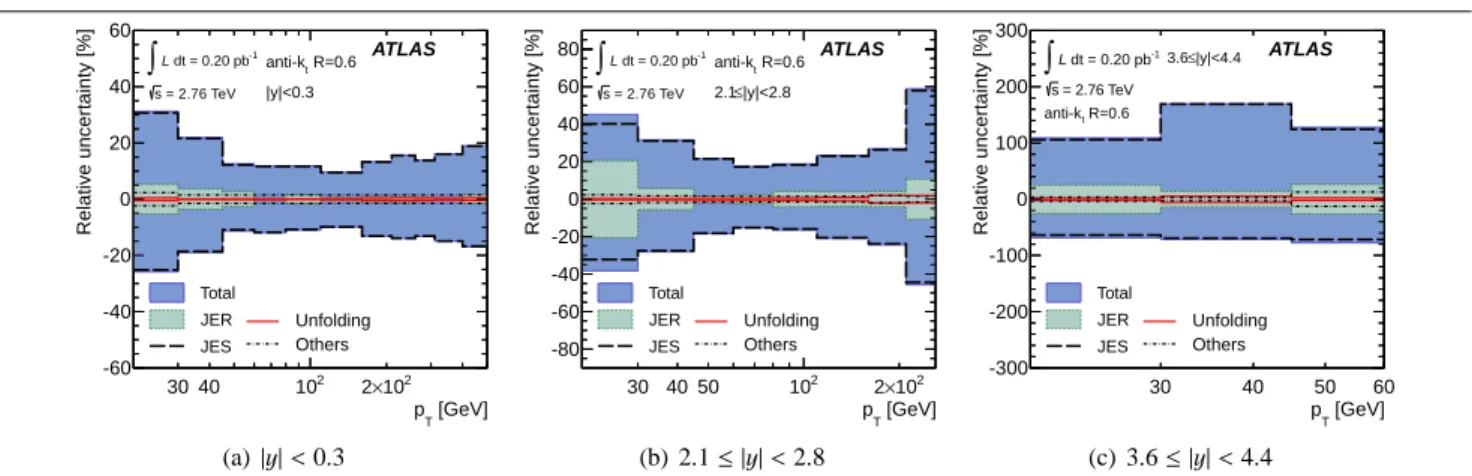
The evaluated systematic uncertainties on the measured cross-section are added in quadrature and shown in Fig. 5 for representative rapidity bins and R = 0.6. Results for jets with
R = 0.4 are similar. The systematic uncertainty on this
mea-surement is driven by the uncertainties on the JES. The very
steeply falling jet pT spectrum, especially for large
rapid-ity, transforms even relatively modest uncertainties on the transverse momentum into large changes in the measured differential cross-section. The uncertainty on the jet energy resolution also has a sizable effect on the total systematic
uncertainty of the measurement in the low pT bins. Other
sources of uncertainty are found to have a smaller impact on the results.
A total of 22 independent sources of systematic uncer-tainty have been considered. The correlations of the
system-atic uncertainties across pT and y are examined and
sum-marised in Table 1. In the table, 88 independent nuisance pa-rameters describe the correlations of systematic uncertain-ties over the whole phase space. The systematic effect on the cross-section measurement associated with each nuisance
parameter is treated as completely correlated in pT and y.
The table also shows the correlation with respect to the
pre-vious √s = 7 TeV measurement using 2010 data, which is
used in the extraction of the cross-section ratio in Sect. 12.
11 Inclusive jet cross-section at √s = 2.76 TeV
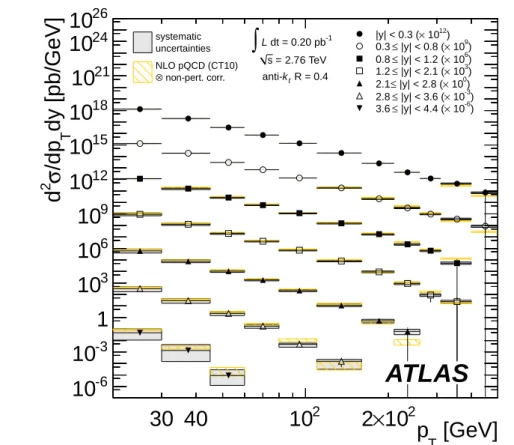
The inclusive jet double-differential cross-section is shown
in Figs. 6 and 7 for jets reconstructed with the anti-kt
al-gorithm with R = 0.4 and R = 0.6, respectively. The mea-surement spans jet transverse momenta from 20 GeV to 430 GeV in the rapidity region of |y| < 4.4, covering seven orders of magnitude in cross-section. The results are compared to NLO pQCD predictions calculated with NLOJET++ using the CT10 PDF set. Corrections for non-perturbative effects are applied.
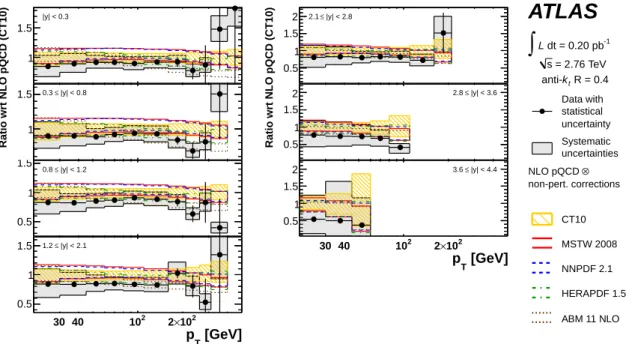
The ratio of the measured cross-sections to the NLO pQCD predictions using the CT10 PDF set is presented in Figs. 8 and 9 for jets with R = 0.4 and R = 0.6, respectively. The results are also compared to the predictions obtained using the PDF sets MSTW 2008, NNPDF 2.1, HERAPDF 1.5 and ABM 11. The measurement is consistent with all the theory predictions using different PDF sets within their sys-tematic uncertainties for jets with both radius parameters. However, the data for jets with R = 0.4 have a systemati-cally lower cross-section than any of the theory predictions, while such a tendency is seen only in the forward rapidity regions in the measurement for jets with R = 0.6.
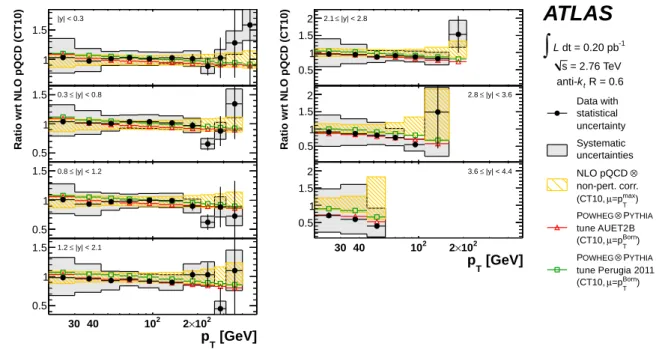
The comparison of the data with the Powheg prediction
[GeV] T p 30 40 102 2×10² Relative uncertainty [%] -60 -40 -20 0 20 40 ATLAS Total JER JES Unfolding Others -1 dt = 0.20 pb L
∫
= 2.76 TeV s R=0.6 t anti-k |y|<0.3 (a) |y| < 0.3 [GeV] T p 30 40 50 102 2×10² Relative uncertainty [%] -80 -60 -40 -20 0 20 40 60 80 ATLAS Total JER JES Unfolding Others -1 dt = 0.20 pb L∫
= 2.76 TeV s R=0.6 t anti-k |y|<2.8 ≤ 2.1 (b) 2.1 ≤ |y| < 2.8 [GeV] T p 30 40 50 60 Relative uncertainty [%] -300 -200 -100 0 100 200 ATLAS Total JER JES Unfolding Others -1 dt = 0.20 pb L∫
= 2.76 TeV s R=0.6 t anti-k |y|<4.4 ≤ 3.6 (c) 3.6 ≤ |y| < 4.4Fig. 5 The systematic uncertainty on the inclusive jet cross-section measurement for anti-ktjets with R = 0.6 in three representative rapidity bins,
as a function of the jet pT. In addition to the total uncertainty, the uncertainties from the jet energy scale (JES), the jet energy resolution (JER),
the unfolding procedure and the other systematic sources are shown separately. The 2.7% uncertainty from the luminosity measurement and the statistical uncertainty are not shown.
and 11 as a function of the jet pTin bins of rapidity. In
gen-eral, the Powheg prediction is found to be in good agreement with the data. Especially in the forward region, the shape of the data is very well reproduced by the Powheg prediction, while small differences are observed in the central region.
As seen in the previous measurement at √s = 7 TeV [25],
the Perugia 2011 tune gives a consistently larger prediction than the default Pythia tune AUET2B, which is generally in closer agreement with data. In contrast to the NLO pQCD prediction with corrections for non-perturbative effects, the Powheg prediction agrees well with data for both radius pa-rameters R = 0.4 and R = 0.6. This might be attributed to the matched parton shower approach from Powheg (see Sect. 6.3).
12 Cross-section ratio of √s = 2.76 TeV to √s = 7 TeV
12.1 Experimental systematic uncertainty
As indicated in Table 1, the systematic uncertainties on the measurement due to jet reconstruction and calibration are considered as fully correlated between the measurements at √s = 2.76 TeV and √s = 7 TeV. For each correlated
systematic source si, the relative uncertainty ∆ρsi/ρon the
cross-section ratio is calculated as ∆ρsi ρ = 1 + δ2.76 TeVsi 1 + δ7 TeV si − 1, (8) where δ2.76 TeV si and δ 7 TeV
si are relative uncertainties caused by
a source siin the cross-section measurements at √s = 2.76
TeV and √s = 7 TeV, respectively. Systematic uncertainties
that are uncorrelated between the two centre-of-mass ener-gies are added in quadrature. The uncertainties on the trig-ger efficiency and the jet selection efficiency, and the ones
from the unfolding procedure are conservatively considered as uncorrelated between the two measurements at the
dif-ferent energies. The measurement at √s = 7 TeV has an
additional uncertainty due to pile-up effects in the jet energy calibration. It is added to the uncertainty in the cross-section ratio. The uncertainties in the luminosity measurements are also treated as uncorrelated (see Sect. 10), resulting in a lu-minosity uncertainty of 4.3%. The uncertainty on the mo-mentum of the proton beam, based on the LHC magnetic model, is at the level of 0.1% [80] and highly correlated be-tween different centre-of-mass energies; hence, it is negligi-ble for the ratio.
The experimental systematic uncertainties on both
ρ(y, xT) and ρ(y, pT) are shown in Fig. 12 for representative
rapidity bins for jets with R = 0.6. For ρ(y, xT) the
uncer-tainties are 5%–20% for the central jets and+160%
−60% for the
forward jets. For jets with R = 0.4, uncertainties are similar,
except for central jets with low pTwhere the uncertainty is
within ±15%. A significant reduction of the uncertainty is
obtained for ρ(y, pT), being well below 5% in the central
re-gion. In the forward region, the uncertainty is ±70% for jets
with R = 0.6, and+100%
−70% for jets with R = 0.4.
12.2 Results
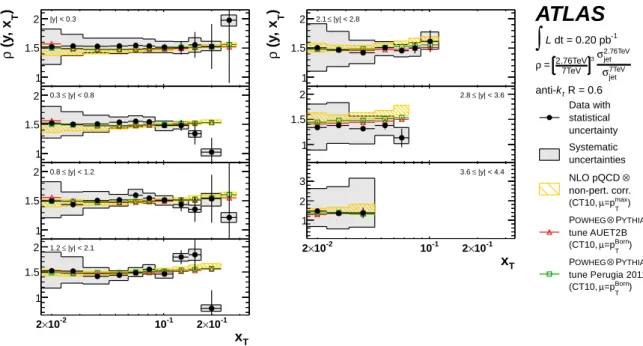
Figures 13 and 14 show the extracted cross-section ratio of
the inclusive jet cross-section measured at √s = 2.76 TeV
to the one measured at √s = 7 TeV, as a function of xT,
for jets with R = 0.4 and R = 0.6, respectively. The
mea-sured cross-section ratio is found to be 1.1 < ρ(y, xT) < 1.5
for both radius parameters. This approximately constant be-haviour reflects both the asymptotic freedom of QCD and evolution of the gluon distribution in the proton as a func-tion of the QCD scale. The measurement shows a slightly
Table 1 Description of the bin-to-bin uncertainty correlation in the measurement of the inclusive jet cross-section at s = 2.76 TeV. Each number
corresponds to a nuisance parameter for which the corresponding uncertainty is fully correlated in the pTof the jet. Bins with the same nuisance
parameter are treated as fully correlated, while bins with different nuisance parameters are uncorrelated. Numbers are assigned to be the same as in the previous publication [25]. The sources labelled by uiare sources uncorrelated in pTand y of the jet. The correlation with the previous
cross-section measurement at√s = 7 TeV [25] is indicated in the last column, where full correlation is indicated by a Y and no correlation by a N.
The description of the JES uncertainty sources can be found in Refs. [73, 74]. JES14 is a source due to the pile-up correction and is not considered in this measurement. The sources JES6 and JES15 were merged together in the previous measurement and the sum of the two uncertainties added in quadrature is fully correlated with the JES6 in the previous measurement, indicated by the symbol “*” in the table. The nuisance parameter label 31 is skipped in order to be able to keep the same numbers for corresponding nuisance parameters in the two jet cross-section measurements. The values for the nuisance parameters are given in Tables 4-45.
Uncertainty source |y| bins Correlation
0-0.3 0.3-0.8 0.8-1.2 1.2-2.1 2.1-2.8 2.8-3.6 3.6-4.4 to 7 TeV
Trigger efficiency u1 u1 u1 u1 u1 u1 u1 N
Jet reconstruction eff. 83 83 83 83 84 85 86 Y
Jet selection eff. u2 u2 u2 u2 u2 u2 u2 N
JES1: Noise thresholds 1 1 2 3 4 5 6 Y
JES2: Theory UE 7 7 8 9 10 11 12 Y
JES3: Theory showering 13 13 14 15 16 17 18 Y
JES4: Non-closure 19 19 20 21 22 23 24 Y
JES5: Dead material 25 25 26 27 28 29 30 Y
JES6: Forward JES generators 88 88 88 88 88 88 88 *
JES7: E/p response 32 32 33 34 35 36 37 Y
JES8: E/p selection 38 38 39 40 41 42 43 Y
JES9: EM + neutrals 44 44 45 46 47 48 49 Y
JES10: HAD E-scale 50 50 51 52 53 54 55 Y
JES11: High pT 56 56 57 58 59 60 61 Y
JES12: E/p bias 62 62 63 64 65 66 67 Y
JES13: Test-beam bias 68 68 69 70 71 72 73 Y
JES15: Forward JES detector 89 89 89 89 89 89 89 *
Jet energy resolution 76 76 77 78 79 80 81 Y
Jet angle resolution 82 82 82 82 82 82 82 Y
Unfolding: Closure test 74 74 74 74 74 74 74 N
Unfolding: Jet matching 75 75 75 75 75 75 75 N
Luminosity 87 87 87 87 87 87 87 N
different xT dependence for jets with R = 0.4 and R = 0.6,
which may be attributed to different xTdependencies of
non-perturbative corrections for the two radius parameters, al-ready seen in Figs. 4 (a) and. 4 (b). The measurement is then compared to the NLO pQCD prediction, to which correc-tions for non-perturbative effects are applied, obtained using the CT10 PDF set. It is in good agreement with the predic-tion.
Figures 15 and 16 show the same cross-section ratio com-pared to predictions from Powheg with the CT10 PDF set. The tunes AUET2B and Perugia 2011 give very similar dictions in general, and also agree well with the pQCD pre-diction with non-perturbative corrections applied.
Figures 17 and 18 show the cross-section ratio as a
func-tion of the jet pT, plotted as the double ratio with respect
to the NLO pQCD prediction using the CT10 PDF set with
non-perturbative corrections applied, for anti-ktjets with R =
0.4 and R = 0.6.5
5As written in Sect. 9, the measurement at √s = 2.76 TeV uses
a quality selection for jets with low pT in Monte Carlo simulation at
|η| ∼ 1, which is a different treatment than was done for the published
measurement at √s = 7 TeV [25]. The ratio is extracted using the
The systematic uncertainty on the measurement is sig-nificantly reduced and is generally smaller than the theory uncertainties. The measurement is also compared to the pre-dictions using different PDF sets, namely MSTW2008, NNPDF 2.1, HERAPDF 1.5 and ABM 11. In general, the measured points are slightly higher than the predictions in the central rapidity regions and are lower in the forward rapidity regions. The deviation is more pronounced for the prediction using the ABM 11 PDF set in the barrel region, which yields a different shape with respect to the other PDF sets.
The very small systematic uncertainty in the ρ(y, pT)
measurement suggests that the measured jet cross-section at √s = 2.76 TeV may contribute to constrain the PDF uncer-coherent treatment in the two measurements at the different beam en-ergies, shifting the measured cross-section at √s = 7 TeV from the
published result within its uncertainty. The shifts are sizable in the bin 0.8 ≤ |y| < 1.2 only. For jets with R = 0.4 (R = 0.6), they are 13% (10%) in the 20 ≤ pT < 30 GeV bin, and 1.5% (2.6%) in the
30 ≤ pT <45 GeV bin. In the rapidity range 1.2 ≤ |y| < 2.1, the shift
is 1.8% (1.9%) at 20 ≤ pT <30 GeV. These bins in the √s = 7 TeV
measurement only enter in the extraction of ρ(y, pT) and not in that of
[GeV]
Tp
30 40
10
22
×
10
2dy [pb/GeV]
T/dp
σ
2d
-610
-310
1
310
610
910
1210
1510
1810
2110
2410
2610
) 12 10 × |y| < 0.3 ( ) 9 10 × |y| < 0.8 ( ≤ 0.3 ) 6 10 × |y| < 1.2 ( ≤ 0.8 ) 3 10 × |y| < 2.1 ( ≤ 1.2 ) 0 10 × |y| < 2.8 ( ≤ 2.1 ) -3 10 × |y| < 3.6 ( ≤ 2.8 ) -6 10 × |y| < 4.4 ( ≤ 3.6 uncertainties systematic non-pert. corr. ⊗ NLO pQCD (CT10) -1 dt = 0.20 pb L∫
= 2.76 TeV s R = 0.4 t kanti-ATLAS
Fig. 6 Inclusive jet double-differential cross-section as a function of the jet pTin bins of rapidity, for anti-ktjets with R = 0.4. For presentation,
the cross-section is multiplied by the factors indicated in the legend. The shaded area indicates the experimental systematic uncertainties. The data are compared to NLO pQCD predictions calculated using NLOJET++ with the CT10 PDF set, to which non-perturbative corrections have been applied. The hashed area indicates the predictions with their uncertainties. The 2.7% uncertainty from the luminosity measurements is not shown.
tainties in a global PDF fit in the pQCD framework by cor-rectly taking the correlation of systematic uncertainties to
the previous √s = 7 TeV measurement into account. Such
an NLO pQCD analysis is described in Sect. 13.
A comparison of the jet cross-section ratio as a function
of pTto the Powheg prediction is made in Figs. 19 and 20.
Differences between the tunes used in Pythia for the parton shower are very small, and deviations are seen only in the
forward region for large pT. Like the NLO pQCD
tion with non-perturbative corrections, the Powheg predic-tion has a different trend in the central rapidity region with respect to data, deviating by more than 10%. However, it follows the data very well in the forward region.
13 NLO pQCD analysis of HERA and ATLAS jet data Knowledge of the PDFs of the proton comes mainly from deep-inelastic lepton-proton scattering experiments
cover-ing a broad range of momentum-transfer squared Q2and of
Bjorken x. The PDFs are determined from data using pQCD in the DGLAP formalism [81–85]. The quark distributions in the region x . 0.01 are in general well constrained by the precise measurement of the proton structure function
F2(x, Q2) at HERA [86]. However, the gluon momentum
distribution xg(x, Q2) at x values above 0.01 has not been
as precisely determined in deep-inelastic scattering. The
in-clusive jet pTspectrum at low and moderate pTis sensitive
to the gluon distribution function.
The systematic uncertainty on the jet cross-section at √
s = 2.76 TeV is strongly correlated with the ATLAS jet
cross-section measured at√s = 7 TeV, as described in Sect. 8.
Therefore, increased sensitivity to the PDFs is expected when these two jet cross-section datasets are analysed together, with proper treatment of correlation between the measure-ments.
A combined NLO pQCD analysis of the inclusive jet
cross-section in pp collisions at √s =2.76 TeV together with
the ATLAS inclusive jet cross-section in pp collisions at √
s =7 TeV [25] and HERA I data [86] is presented here. The
analysis is performed using the HERAFitter package [86– 88], which uses the light-quark coefficient functions calcu-lated to NLO as implemented in QCDNUM [89] and the heavy-quark coefficient functions from the variable-flavour number scheme (VFNS) [90, 91] for the PDF evolution, as
well as MINUIT [92] for minimisation of χ2. The data are
[GeV]
Tp
30 40
10
22
×
10
2dy [pb/GeV]
T/dp
σ
2d
-610
-310
1
310
610
910
1210
1510
1810
2110
2410
2610
) 12 10 × |y| < 0.3 ( ) 9 10 × |y| < 0.8 ( ≤ 0.3 ) 6 10 × |y| < 1.2 ( ≤ 0.8 ) 3 10 × |y| < 2.1 ( ≤ 1.2 ) 0 10 × |y| < 2.8 ( ≤ 2.1 ) -3 10 × |y| < 3.6 ( ≤ 2.8 ) -6 10 × |y| < 4.4 ( ≤ 3.6 uncertainties systematic non-pert. corr. ⊗ NLO pQCD (CT10) -1 dt = 0.20 pb L∫
= 2.76 TeV s R = 0.6 t kanti-ATLAS
Fig. 7 Inclusive jet double-differential cross-section as a function of the jet pTin bins of rapidity, for anti-ktjets with R = 0.6. For presentation,
the cross-section is multiplied by the factors indicated in the legend. The shaded area indicates the experimental systematic uncertainties. The data are compared to NLO pQCD predictions calculated using NLOJET++ with the CT10 PDF set, to which non-perturbative corrections have been applied. The hashed area indicates the predictions with their uncertainties. The 2.7% uncertainty from the luminosity measurements is not shown.
2 2 2 2 1 1.5 |y| < 0.3 2 2 2 2 1 1.5 0.3 ≤ |y| < 0.8 2 2 2 2 0.5 1 1.5 |y| < 1.2 ≤ 0.8 2 2 2 2 0.5 1 1.5 1.2 ≤ |y| < 2.1 2 2 2 2 0.5 1 1.5 2 2.1 ≤ |y| < 2.8 2 2 2 2 0.5 1 1.5 2 2.8 ≤ |y| < 3.6 2 2 2 2 0.5 1 1.5 2 3.6 ≤ |y| < 4.4 [GeV] T p 30 40 102 2×10² [GeV] T p 30 40 102 2×10²
Ratio wrt NLO pQCD (CT10) Ratio wrt NLO pQCD (CT10)
ATLAS
-1 dt = 0.20 pb L∫
= 2.76 TeV s R = 0.4 t k anti-Data with statistical uncertainty Systematic uncertainties ⊗ NLO pQCD non-pert. corrections CT10 MSTW 2008 NNPDF 2.1 HERAPDF 1.5 ABM 11 NLOFig. 8 Ratio of the measured inclusive jet double-differential cross-section to the NLO pQCD prediction calculated with NLOJET++ with the
CT10 PDF set corrected for non-perturbative effects. The ratio is shown as a function of the jet pT in bins of jet rapidity, for anti-ktjets with
R = 0.4. The figure also shows NLO pQCD predictions obtained with different PDF sets, namely ABM 11, NNPDF 2.1, HERAPDF 1.5 and
2 2 2 2 1 1.5 |y| < 0.3 0.5 1 1.5 0.3 ≤ |y| < 0.8 2 2 2 2 0.5 1 1.5 0.8 ≤ |y| < 1.2 2 2 2 2 0.5 1 1.5 1.2 ≤ |y| < 2.1 2 2 2 2 0.5 1 1.5 2 2.1 ≤ |y| < 2.8 0.5 1 1.5 2 2.8 ≤ |y| < 3.6 2 2 2 2 0.5 1 1.5 2 3.6 ≤ |y| < 4.4 [GeV] T p 30 40 102 2×10² [GeV] T p 30 40 102 2×10²
Ratio wrt NLO pQCD (CT10) Ratio wrt NLO pQCD (CT10)
ATLAS
-1 dt = 0.20 pb L∫
= 2.76 TeV s R = 0.6 t k anti-Data with statistical uncertainty Systematic uncertainties ⊗ NLO pQCD non-pert. corrections CT10 MSTW 2008 NNPDF 2.1 HERAPDF 1.5 ABM 11 NLOFig. 9 Ratio of the measured inclusive jet double-differential cross-section to the NLO pQCD prediction calculated with NLOJET++ with the
CT10 PDF set corrected for non-perturbative effects. The ratio is shown as a function of the jet pT in bins of jet rapidity, for anti-ktjets with
R = 0.6. The figure also shows NLO pQCD predictions obtained with different PDF sets, namely ABM 11, NNPDF 2.1, HERAPDF 1.5 and
MSTW2008. Statistically insignificant data points at large pTare omitted. The 2.7% uncertainty from the luminosity measurements is not shown.
2 2 2 2 1 1.5 |y| < 0.3 2 2 2 2 1 1.5 0.3 ≤ |y| < 0.8 2 2 2 2 0.5 1 1.5 |y| < 1.2 ≤ 0.8 2 2 2 2 0.5 1 1.5 1.2 ≤ |y| < 2.1 2 2 2 2 0.5 1 1.5 2 2.1 ≤ |y| < 2.8 2 2 2 2 0.5 1 1.5 2 2.8 ≤ |y| < 3.6 2 2 2 2 0.5 1 1.5 2 3.6 ≤ |y| < 4.4 [GeV] T p 30 40 102 2×10² [GeV] T p 30 40 102 2×10²
Ratio wrt NLO pQCD (CT10) Ratio wrt NLO pQCD (CT10)
ATLAS
-1 dt = 0.20 pb L∫
= 2.76 TeV s R = 0.4 t k anti-Data with statistical uncertainty Systematic uncertainties ⊗ NLO pQCD non-pert. corr. ) max T =p µ (CT10, YTHIA P ⊗ OWHEG P tune AUET2B ) Born T =p µ (CT10, YTHIA P ⊗ OWHEG P tune Perugia 2011 ) Born T =p µ (CT10,Fig. 10 Ratio of the measured inclusive jet double-differential cross-section to the NLO pQCD prediction calculated with NLOJET++ with the
CT10 PDF set corrected for non-perturbative effects. The ratio is shown as a function of the jet pT in bins of jet rapidity, for anti-ktjets with
R = 0.4. The figure also shows predictions from Powheg using Pythia for the simulation of the parton shower and hadronisation with the AUET2B
tune and the Perugia 2011 tune. Only the statistical uncertainty is shown on the Powheg predictions. Statistically insignificant data points at large