HAL Id: hal-02981480
https://hal.archives-ouvertes.fr/hal-02981480
Submitted on 20 Nov 2020
HAL is a multi-disciplinary open access
archive for the deposit and dissemination of
sci-entific research documents, whether they are
pub-lished or not. The documents may come from
teaching and research institutions in France or
abroad, or from public or private research centers.
L’archive ouverte pluridisciplinaire HAL, est
destinée au dépôt et à la diffusion de documents
scientifiques de niveau recherche, publiés ou non,
émanant des établissements d’enseignement et de
recherche français ou étrangers, des laboratoires
publics ou privés.
Systemic design and energy management of a standalone
battery-less PV/Wind driven brackish water reverse
osmosis desalination system
I. Ben Ali, M. Turki, J. Belhadj, Xavier Roboam
To cite this version:
I. Ben Ali, M. Turki, J. Belhadj, Xavier Roboam. Systemic design and energy management of a
stan-dalone battery-less PV/Wind driven brackish water reverse osmosis desalination system. Sustainable
Energy Technologies and Assessments, Elsevier, 2020, 42, pp.100884. �10.1016/j.seta.2020.100884�.
�hal-02981480�
Systemic Design and Energy Management of a Standalone Battery-less
1
PV/Wind driven Brackish Water Reverse Osmosis Desalination System
2
I. Ben Ali a, M. Turki a, b, J. Belhadj a, c, X. Roboam d
3
a Université de Tunis El Manar, LR 11 ES 15, Laboratoire des Systèmes Électriques, École Nationale d’Ingénieurs de Tunis, BP 37 – 1002,
4
Tunis le Belvédère, Tunis, Tunisia.
5
e-mail: ines.benali@enit.utm.tn
6
b Université de Jendouba, École Supérieure des Ingénieurs de Medjez El Bab, P5, 9070, Tunisia.
7
e-mail: mehdi_turki1@yahoo.fr
8
c Université de Tunis, École Nationale Supérieure d’Ingénieurs de Tunis, BP 56 – 1008, Montfleury, Tunisia.
9
e-mail: Jamel.Belhadj@esstt.rnu.tn
10
d Université de Toulouse, LAPLACE (Laboratoire Plasma et Conversion d’Énergie), UMR CNRS-INP-UPS, ENSEEIHT, 2 Rue Camichel
11
31071 Toulouse, France.12
e-mail: Xavier.Roboam@laplace.univ-tlse.fr13
Abstract14
This work investigates a small-scale reverse osmosis desalination system dedicated for off-grid communities
15
lacking freshwater. This system, constituted of motor-pumps, desalination process and hydraulic network (pipes
16
and valves), is powered by hybrid photovoltaic-wind turbine source. It exploits hydraulic storage in water tanks
17
filled when renewable energy is available instead of electrochemical storage. Such specificity makes the
18
power/freshwater supply a challenging issue for these communities. To maximize freshwater production of this
19
autonomous system, a “systemic design approach” integrating couplings between architecture, sizing, and energy
20
management is proposed. According to the specific system architecture and its component sizing, a specific
21
quasi-static model-based energy management strategy (EMS) is developed. In this regard, the influence of the
22
main component sizing on the system energy efficiency and the EMS performance is analyzed. This study
23
proved the strongly coupling between power/water management and pump sizing. According to the iterative
24
process of the systemic design approach, simulation results showed that the EMS objective is reached by
25
increasing the brackish water storage tank capacity and improving the system energy efficiency. The latter is
26
achieved by choosing the pumps-combination composed of three pumps having the lowest rated powers
27
(0.37kW/0.37kW/1.5kW), but offering higher energy efficiency over other analyzed pumps-combinations.
28
Keywords: systemic design; electrochemical and water storage; quasi-static modeling; water/power management;
29
renewable energy.
30
1. Introduction
31
Reverse osmosis (RO) desalination applications have been becoming the primary choice to produce freshwater
32
from brackish or sea water for many water-stressed regions [1-2] not only for drinking, but also for agriculture [3].
33
Typically, these applications, especially small-scale units for off-grid communities, are powered by renewable
34
energies [4-6]. The most commonly used renewable energies to power such desalination units are the solar energy
35
[7-8] and the wind energy [9-10]. For example, according to the comprehensive review and the techno-economic
36
feasibility carried out, respectively, in [11] and [8], photovoltaic PV-RO desalination systems are considered
37
better than other desalination combinations due to their availability in the market and economic feasibility; this
38
has encouraged poor farmers in rural regions to use these systems to produce freshwater. Another
techno-39
economic analysis of several wind-driven variable flow RO systems in United Arab Emirates was conducted [9].
40
This analysis concluded that Wind-RO combination is an economic alternative to produce freshwater. However,
41
although wind and solar energies are the most widespread and environmentally friendly Renewable Energy
42
Sources (RESs) worldwide, both are of variable and intermittent nature due to unpredictable and rough changes in
43
weather conditions (e.g. simultaneous cloudy sky or wind speed slowing down). For that, using single RES cannot
44
always meet the electrical demand of the RO plant during the day [12].
45
Hybrid power generation systems, such as solar PV panels combined with wind turbine [10], are becoming more
46
suitable with the advantage that one RES could be available when the other is not [6]. Such a temporal
47
complementarity will increase the reliability and improve the environmental aspect of the desalination system
48
[12]. On the other hand, standalone RO systems can be powered by different combinations of renewable energy
49
sources (e.g. PV-RO, Wind-RO and PV/Wind-RO) with one or more energy storage device, such as batteries [10],
50
super capacitors [13], fuel cell [14-15], and diesel generator backup [16]. A summary of different studied
51
standalone small-scale RES-brackish water RO units in different sites around the world is reported in Table1.
52
Table 1 Summarry of the reported standalone small-scale RES-BWRO units (≤ 10m3/d) in the last decade
53
Ref. Year Country PV (kW) Wind (kW) Battery Diesel (kW) Hydrogen Freshwater (m3/d) Energy Recovery (%) [17] 2010 Spain 0.36 no yes no no 0.2 (12h) no [18] 2010 Uzbekistan 0.03 no yes no no 0.075 (9.5h) no
[19] 2010 Babylon, Iraq 4.1 no yes 1.8 no 5 (24h) no
[19] 2010 Babylon, Iraq 1.6 no yes 1 no 5 (6h) no
[20] 2011 Australia not mentioned no no no no 4.8 (12h) no
[21] 2011 Jordan 0.433 no yes no no 0.5 54
[13] 2012 Marseille, France 0.5 no no no no 1 not mentioned
[22] 2012 Jordan 0.432 no yes no no 5.7 (24h) no
[23] 2012 Egypt 5 not mentioned yes no no 5 (24h) no
[24] 2013 Dhahran, Saudi Arabia
2.4 2 yes no no 5 (12h) not mentioned
[25] 2013 Amarika, Namibia 19.8 no yes no no 3.3 23
[26] 2014 Nairobi, Kenya 5 1 yes 1.5 no 3.5 no
[26] 2014 Nyala, Sudan 5 1 yes 1.5 no 3.5 no
[27] 2015 Egypt 2.5 no no no no 4-5 not mentioned
[28] 2015 India 0.075-3 no yes no no 1.04 (4h) no
[29] 2015 La Mancalona, Mexican
0.4 no yes no no 1 33
[30] 2015 India not mentioned (with & without freshwater storage)
no no no no 2.4-6 no
[31] 2016 Bangi, Malaysia 2 no yes no no 5.1 (10h) not mentioned [32] 2016 Pakistan 0.75 no yes no no 0.0295 (5h) not mentioned [32] 2016 Pakistan 0.12 no no no no 0.0266 (7h) not mentioned [33] 2016 St. Dorcas
borehole, Tanzania
0.3 no no no no 1.3-1.6 23.1-27.8
[34] 2017 Saudi Arabia 0.25 no no no no 0.126 not mentioned
[35] 2018 South Khorasan, Iran
not mentioned not mentioned yes no yes 10 no
[36] 2019 Tanzania 2.25 no yes no no 2.36 6-18
[8] 2020 Pakistan 2 no no no no 4 (8h) no
Combining RESs with energy storage device has the advantage of providing constant energy flow during
54
insufficient power generation time and offering the ability to buffer the energy production variations. Nonetheless,
55
besides to the environmental issues, the capital and maintenance cost of batteries (and/or burned fuel cost) is often
56
a major concern [37], especially for remote and poverty areas. Therefore, minimizing or even suppressing the
57
energy storage device such as electrochemical storage means is a challenging issue facing such standalone
58
desalination systems, especially in the light of continuous freshwater supply.
59
In case of RES-RO desalination system without batteries, freshwater will be produced by a variable and
60
discontinuously operated desalination system. That is, RO membrane will operate under variable feed pressure. It
61
has been demonstrated that the operation of the RO membrane under variable power supply remains unaffected
62
[38-39]. Moreover, several studies at the laboratory scale have demonstrated the possibility of operating RES-RO
63
desalination units without battery storage device [40-42]. Another study concluded that it is possible to completely
64
eliminate batteries in PV-RO systems; it needs to automatically adjust the operating point of the RO-pump with
65
fluctuating solar energy [43]. An economic analysis was also conducted in [32] for PV-RO system with and
66
without battery, where results demonstrated that battery-less PV-RO system is more economically suitable than
67
that using battery storage. A comprehensive review of desalination technologies powered by solar energy
68
including solar PV-RO desalination systems without batteries was conducted in [44]. It is concluded that coupling
69
RO and PV systems is relatively straightforward, especially for small-scale units.
70
Another option to reduce the capital cost is to store water in a storage tank such as the example of using buffer
71
tank for freshwater storage [30] [45]. Such an alternative enables to minimize the needed number of batteries and
72
overcome the challenge of longer-term renewable energy variation. In ref. [30], authors showed that the system
73
productivity increased up to 36% by storing produced freshwater. It was demonstrated that a buffer tank can be
74
considered as a surrogate energy storage device. The concept is that the generated renewable energy during sunny
75
and/or windy days is a stored energy in the form of water. This can be considered very cost-effective and
76
environmentally friendly alternative compared with RES-RO units using battery banks or diesel generator backup.
77
In this context, a focus on a standalone small-scale Brackish Water Reverse Osmosis (BWRO) desalination
78
system in rural area is put forward in this paper. This system is powered by hybrid PV/Wind turbine source
79
without electrochemical storage device, but exploiting hydraulic storage (brackish water and freshwater) in
80
storage tanks. The idea is: i) to take advantage of storing the well brackish water and the produced freshwater in
81
tanks when renewable energy is available, and ii) to exploit motor-pumps modularity (i.e. several pumping
82
subsystems that can be switched on/off and tuned) versus the given generated power. For this sake, an
83
experimental BWRO desalination unit at the laboratory scale (freshwater production of 300 liters/h) using an
84
elevated brackish water storage tank was designed and mounted to investigate the feasibility and reliability of
85
PV/Wind-BWRO desalination system in rural areas. A second storage tank is also used in this unit to store the
86
produced freshwater, for later use when renewable energy is unavailable.
87
To overcome the variable and discontinuously operated PV/Wind-BWRO unit, a specific energy (power and
88
water flows) management is then required in order to manage simultaneously power and water flows into the
89
desalination system while fulfilling technological (power and pressure ranges) and functional (tank filling state)
90
constraints of the system. The energy management strategy to be developed must take into consideration the
91
strongly coupled system design: “water/power management and device sizing”. In particular, the generated power
92
from RESs is strongly coupled with the water process system efficiency. In addition to that, the coupling between
93
sizing and management performance is of a paramount importance in this study. Therefore, it is mandatory to
94
study the sizing of pumps and the different pump-combinations in the desalination system to get an optimal
95
system design enabling to maximize as much as possible the freshwater production according to the available
96
generated power. All of these aspects put forward the necessity of a “systemic design approach” integrating the
97
strong coupling between architecture (modularity), sizing and flow (power, water) management. In this regard,
98
authors in ref. [46] have investigated a global optimization approach taking account of the couplings between the
99
system architecture, sizing and energy management. They proposed an optimization dispatching algorithm for
100
sharing the variable input power between the three installed motor-pumps: the choice of the objective function for
101
the optimization algorithm to evaluate the operating efficiency has been justified. The influence of the pump
102
sizing on the system efficiency has been also analyzed.
103
This paper proposes a first design approach based on specific modeling and management strategy. It primarily
104
aims to maximize as much as possible the water production of the system according to the renewable energy
105
generation. First, a quasi-static modeling stemming from dynamic modeling of the experimental BWRO
106
desalination test bench is developed for simulations. In order to validate the developed model, the latter is
107
compared with the experimental model obtained from experimental characterizations of the BWRO test bench.
108
Then, an energy management strategy is developed using Deterministic Rule-based power sharing algorithm.
109
Such algorithm should conveniently dispatch the instantaneous generated power between the different water
110
process subsystems into the studied system while taking into consideration: i) the aforementioned system
111
constraints, and ii) the objective of maximizing freshwater production. For the sake of optimality, the sizing
112
influence of both pump combinations and brackish water storage tank capacity on the energy management
113
performance is then analyzed. As regards the capacity sizing of the freshwater storage tank, it is not studied during
114
simulations and analysis, since it is viewed as an infinite storage tank (in simulations) aiming to store a maximum
115
amount of produced freshwater.
116
This paper is organized as follows: the architecture and specifications of the BWRO desalination system are
117
described in Section 2. The adopted systemic design approach is defined in Section 3. The analytical modeling of
118
the studied system is detailed in Section 4. The EMS is described in Section 5. Section 6 is dedicated to analyze
119
the simulation results. In this Section the influence of pumps and tank capacity sizing on the energy management
120
performance are investigated and analyzed. Finally, main conclusions and prospects are summarized in Section 7.
121
Nomenclature Acronyms
BWRO Brackish Water Reverse Osmosis CV Control Valve of the RO membrane DC Direct Current
EMS Energy Management Strategy HPP High Pressure Pump IM Induction Motor PV Photovoltaic
RES Renewable Energy Source RO Reverse Osmosis WP Well Pump
Greek symbols
α power sharing factor, –
ρ water density, Kg/m3
φr rotor flux of the induction motor, Wb
φrd d-axis rotor flux in the (d,q) reference frame, Wb
g gravity acceleration, N/Kg
Hgeo geodetic head that the pump must overcome, m
Htank height of the stored brackish water amount in tank T1, m
Hasp brackish water aspiration height of the HPP, m
HMT total dynamic head of the pump, m
Pfeed feed pressure of the RO membrane, bar
Pasp brackish water aspiration pressure of the HPP, bar
Ptank resulting pressure from stored amount of brackish water in the tank T1, bar
Phyd_load required pressure of a hydraulic load, bar
PHPP proper pressure given by the HPP, bar
Pdc renewable generated power transferred via a DC bus, W PHPP assigned electric power to the HPP, W
PWP assigned electric power to the WP, W Pmin minimum electric power, W
φrq q-axis rotor flux in the (d,q) reference frame, Wb
Ω angular speed of the induction motor, rad/s
Variables/parameters
FS filling state of the storage tank T1, %
FS0 initial filling state of the tank T1, %
FSmax maximum limit of the tank filling state, %
FSmin minimum limit of the tank filling state, %
Ip consumed current by the pump, A
Isd d-axis stator current in the (d,q) reference frame, A
Isq q-axis stator current in the (d,q) reference frame, A
Ic current of the DC-link capacitor, A
Idc DC-link current, A
Lm mutual inductance in the induction motor, H
Lr rotor inductance in the induction motor, H
L water level in the storage tank T1, m
LminInf inferior minimum limit level in the storage tank, m
LminSup superior minimum limit level in the storage tank, m
LmaxInf inferior maximum limit level in the storage tank, m
LmaxSup superior maximum limit level in the storage tank, m
Pmax maximum electric power, W
Qp pump flowrate, liters/min
Qfresh freshwater flowrate, liters/min
Qfeed feed water flow of the RO membrane, liters/min
Qreject rejected water flow rate of the RO membrane, liters/min
QWP well pump flowrate, liters/min
QHPP high pressure pump flowrate, liters/min
qfresh produced freshwater quantity, m3
Rs stator resistance of the induction motor, Ohms
Rr rotor resistance of the induction motor, Ohms
S1 surface area of the storage tank T1, m²
T1 storage tank of brackish water, –
Tp pump torque, N.m
Tm motor torque, N.m
Vdc DC-link voltage, V
Vsd d-axis of the stator voltage in the (d,q) reference frame, V
Vsq q-axis of the stator voltage in the (d,q) reference frame, V ΔPpipe pressure drop in pipelines, bar
ΔPIM electrical power losses through the induction motor associated with its inverter, W
ΔPp hydraulic power losses through the centrifugal pump
2. Description of the BWRO desalination system
122
2.1. System architecture overview
123
The studied system, depicted in Fig.1, consists of small-scale standalone brackish water pumping and desalination
124
unit. It is mainly composed of two hydro-mechanical subsystems:
125
1) “Water Pumping Process” that uses well Pump(s) (WP) to pump brackish water from the well to an
126
elevated storage tank T1. This process is dedicated for gravitational brackish water storage.
127
2) “Reverse Osmosis (RO) Desalination Process” enabling to produce freshwater using a RO membrane(s)
128
fed by a High Pressure Pump (HPP). The HPP exploits the stored amount of brackish water in the tank T1
129
to feed the RO membranes under high pressure. The produced freshwater is stored in the tank T2.
130
This unit would be powered via a Direct Current (DC) bus with a variable generated power Pdc offered along
131
wind speed and solar irradiation conditions (PV/Wind turbine) without battery storage.
132
The hydraulic architecture of the desalination system depicted in Fig. 2 is defined so that the desalination system
133
includes two independent hydraulic subsystems decoupled through the elevated water storage tank T1. The latter
134
presents the first key element of the chosen architecture. In other words, pumped brackish water from the well can
135
be stored into the elevated tank T1, when renewable energy is available, for later or simultaneous use by the RO
136
desalination process to produce freshwater. The latter in turn is stored in high capacity tank T2, for later use when
137
the renewable energy is unavailable. This constitutes the second key element of the system architecture.
138
Therefore, the electrochemical storage device can be replaced by hydraulic storage (brackish water and
139
freshwater) in water tanks.
140
141
Fig.1. Synoptic of the autonomous BWRO desalination system
142
143
Fig.2. Hydraulic configuration of the BWRO desalination system
144
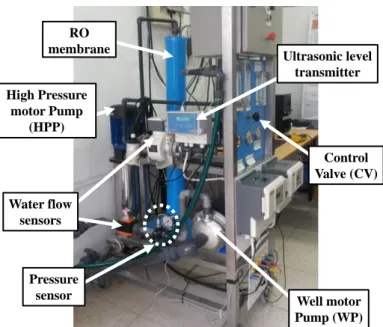
2.2. Experimental test bench
145
An experimental test bench, shown in Fig.3, was designed and mounted in our research laboratory (L.S.E in
146
ENIT-UTM, Tunis, Tunisia). The synoptic scheme of the experimental test bench is depicted in Fig.4. The
147
specifications of the presented test bench are reported in Table 2. This experimental unit is used for the
148
experimental characterizations of the hydro-mechanical processes in order to validate the system model. Indeed,
149
the two hydro-mechanical processes have been experimentally characterized and dynamically modeled in
150
previous studies [47-50].
151
Based on the dynamic modeling of hydro-mechanical processes of the presented RO unit, a quasi-static modeling
152
is developed for energy management which is described in Section 4.
153
Well motor Pump (WP) Water flow sensors Pressure sensor Control Valve (CV) RO membrane Ultrasonic level transmitter High Pressure motor Pump (HPP)
154
Fig.3. Experimental BWRO desalination test bench
155
Brackish water tank Well Pump WP CV HPP Filter M em bra ne Brackish water (variable salinity) Freshwatertank water tankRejected
IM 1 IM 2 Inverter 1 Inverter 2 Data acquisition USB PC RO m od u le Ultrasonic level transmitter Valve Height=4m Conductivity meter : Pressure sensors : water flow sensors : valves
156
Fig.4. Sysnoptic scheme of the experimental BWRO desalination test bench
157
Table 2 Specifications of the experimental desalination test bench
158
Components Characteristics Component constraints High Pressure Pump (HPP) Model: EBARA EVM2 22F/2.2
Type: centrifugal 3-ph motor pump Power output: 2.2 kW
Rated Pressure: 8.17-18.6 bar Rated flow rate: 20- 60 l/min
Minimum absorbed electric power: 620 W Maximum absorbed electric power: 1800 W
Well Pump 1 (WP1) Model: PEDROLLO CP158
Type: centrifugal 3-ph motor pump Power output: 0.75 kW
Rated Pressure: 2.5-3.4 bar Rated flow rate: 10-90 l/min
Minimum absorbed electric power: 120 W Maximum absorbed electric power: 1020 W
Well Pump 2 (WP2) Model: LOWARA CEA70/3
Type: centrifugal 3-ph motor pump Power output: 0.37 kW
Minimum absorbed electric power: 120 W Maximum absorbed electric power: 370 W
Rated Pressure:1.3-2 bar Rated flow rate: 30-80 l/min RO membrane Model: TORAY TM710
Feed water salinity: 4 g/l
Maximum freshwater production: 300 l/h
Minimum feed pressure: 8.4 bar Maximum feed pressure: 16.2 bar
Storage tank (T1) Capacity: 2.18 m3
Height: 2.1 m Elevation height: 4 m
Inferior minimum limit level LminInf: 0.2 m
Superior minimum limit level LminSup: 0.25 m
Inferior maximum limit level LmaxInf: 1.9 m
Superior maximum limit level LmaxSup: 2 m 2.3. Characteristic specificity of the chosen architecture
159
Due to the hydraulic processes decoupling, the system has more degrees of freedom than conventional used
160
architecture where motor-pumps are usually coupled in series (without brackish water storage tank). In fact, the
161
system can independently operate as: i) “pumping system” by operating solely the water pumping process in case
162
of low level of generated power, or ii) “RO desalination system” by operating solely the RO desalination process
163
in case of high level of generated power, or also iii) “pumping and RO desalination system” in case of very high
164
level of generated power. In the latter operating mode, the two hydraulic processes operate simultaneously to
165
pump brackish water from the well to fill the storage tank and, in the same time, produce freshwater using the
166
pumped brackish water from T1. Indeed, this configuration offers a great flexibility for the experimental
167
characterization of each hydro-mechanical process.
168
Within this hydraulic configuration, the “gravitational water storage” involves an advantage of great importance in
169
terms of energy efficiency improvement; this fact enables to take benefit of an additional free hydraulic energy
170
boosting the RO desalination energy efficiency. As a result, freshwater productivity can be improved. This point
171
has been highlighted in previous work [51]. Moreover, besides the advantage of being environmentally friendly,
172
another advantage of using hydraulic storage over electrochemical storage device is the simplicity of such a
173
configuration (no need to control laws), as well as it offers lower cost alternative (no need to additional power
174
converters for control and no maintenance requirements).
175
On the other hand, the studied system is classified among complex energy systems. Its complexity is
176
characterized by the combination of components of different natures and functionalities, all interacted within the
177
system under study. Such heterogeneity leads to several physical phenomena coexistence, and several system
178
constraints of different domains. These constraints can be listed as: i) functioning under variable energy supply
179
(i.e. variable feeding power and pressures), ii) technological constraints of pumping devices (power ranges) and
180
RO membrane (flow-pressure range), and iii) functioning constraints (i.e. filling state of the storage tank). This
181
makes the modeling and the flow (power, water) management of the system a difficult task.
182
Given the diversification of the system constraints, it becomes necessary to move towards a new approach
183
permitting to connect all system components by integrating “intra”- and “inter-disciplinary” coupling. This
184
methodology is based on the “systemic design approach” [52] described in the following section.
185
3. Definition of the systemic design approach
186
The adopted systemic design approach is described in Fig. 5. It relies on the choice of: i) architecture and
187
components, ii) sizing, and iii) development of control/management process. The design has to meet
188
requirements defined by the bill of specifications. This consititutes a fundamental and preliminary step for the
189
designer. Therefore, satisfying the bill of specifications needs a “synthesis” (i.e. structure determination) and
190
“sizing” (i.e. parameters determination) that meet: i) these requirements while anticipating by “simulation” and
191
“analysis” (Fig.5) of the system being designed, ii) system performance, and iii) system constraints.
192
The systemic design approach is an iterative process based on three main phases:
193
- Phase 1: the choice of the system architecture (as defined in the previous section). This allows
194
performing the modeling and simulation of these components.
195
- Phase 2: the optimal pre-sizing of the system components. Such a phase allows characterizing of these
196
elements and specifying the instantaneous energy transfers during an idealized operating cycle. This
197
leads to understand the energy behavior of the system.
198
- Phase 3: the optimization of the energy flows into the system with the objective of determining the
199
optimal energy management of the system.
200
Therefore, following the energy optimization and the simulation of the system behavior it may happen that the
201
components previously chosen are oversized or undersized. For that reason, the “system sizing – energy
202
optimization” cycle is repeated several times off-line in order to refine the system specifications. The objective
203
here is to design a system that should be well adapted to the energy management strategy which, in turn, will be
204
implemented on-line. For this sake, several iterations are performed in this work as part of the systemic design by
205
testing several combinations of different sized pumps and even different storage tank capacities. At each iteration,
206
the architecture is defined, then, the system components are characterized and modeled based on the experimental
207
set-up. This provides deep understanding of the system energy behavior. At the end of the cycle, the proposed
208
energy management strategy is applied to the chosen architecture, and obtained results are analyzed.
209
Systemic approach Specifications Architecture Sizing Energy management Water/power flows optimization Sy nthesis a na ly sis Sim ula tion Sizing of the complex energy system
Development of an optimal energy management of the system
Experimental validation of the energy management, …etc.
Development of a system optimal sizing tool
Exploiting this tool for techno-economic analysis of the system
Objectives
210
Fig.5. Optimization process of a complex energy system by the systemic approach
211
4. System modeling
212
This study focuses on the steady-state functioning of the system in order to simplify the energy management task.
213
The quasi-static model constitutes a “power flow model” derived from dynamic energy behavior throughout the
214
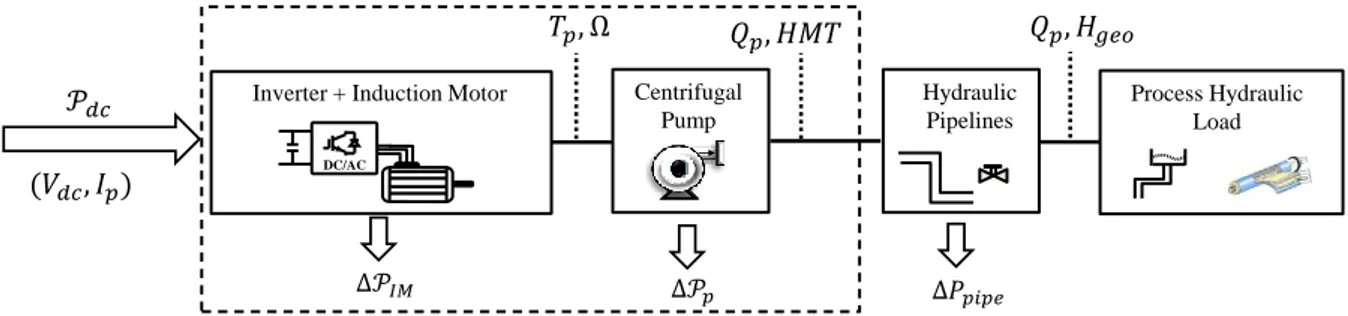
desalination chain. Therefore, in order to develop the quasi-static model of the hydro-mechanical system, several
215
physical fields have to be considered. As depicted in Fig.6, it consists of the following subsystems from right to
216
left: hydraulic load, centrifugal pump, and three phase induction motor fed and controlled by a voltage source
217
inverter. The subsystems are linked each other by power flow variables: electrical voltage and current (Vdc, Ip),
218
motor-pump torque and speed (Tp, Ω), and pump flow rate and pressure (Qp, Pp=ρgHMT). The HMT describes the
total dynamic head (in meter) which depends on hydraulic load and pressure losses in pipelines ∆Ppipe, ρ is the
220
water density and g is the gravity acceleration.
221
Inverter + Induction Motor Centrifugal
Pump Process Hydraulic Load Hydraulic Pipelines AC DC DC/AC
222
Fig. 6. Synoptic of the quasi-static modeling of a single-pump hydro-mechanical process: a power flow model
223
This section is divided into five parts: the first one is devoted for the modeling of the hydraulic subsystems (i.e.
224
hydraulic loads). The second part presents the storage tank analytical model. The third part describes the
hydro-225
mechanical subsystems modeling. Then, the analytical quasi-static model of a hydro mechanical process is
226
presented in the fourth part. The last one is dedicated to the practical validation of the quasi-static model for each
227
hydro-mechanical process.
228
4.1. Hydraulic subsystems modeling
229
As depicted in Fig.1 and Fig.2, we have two different hydro-mechanical subsystems decoupled through a storage
230
tank T1. The modeling task here depends on the hydraulic load type of each subsystem:
231
1) In case of typical load as for the “first water subsystem”, where the water is moved from one level (the
232
well) to another (i.e. an elevated tank) as shown in Fig.2, a pressure drop in pipelines ΔPpipe occurs. The latter is
233
caused by the height difference Hgeo (geodetic head that the pump must overcome), and the hydraulic losses
234
depending on the pump water flow Qp=QWP [53-54]. Thus, the hydraulic load model of the first process (e.g. case
235
of one well pump) is expressed by:
236
2 pipe geo WPP
gH
kQ
(1) where, k is a constant.237
2) The “second subsystem” is related to the water RO desalination process; it involves a complex and
238
nonlinear hydraulic load (RO membrane + Control Valve (CV)) coupled to the HPP. The latter offers high water
239
pressure to feed the RO membrane to produce freshwater. Based on the dynamic model of the RO membrane
240
previously developed and detailed [48] and [55], the static model of the RO membrane expressed by (3), (4) and
241
(5) is deduced by neglecting the dynamic elements effect, with some approximations:
242
2feed mod ule valve reject
P
R
R
Q
(2) feed fresh membrane P Q R (3)feed fresh reject
Q Q Q (4)
Where, Qfeed and Pfeed denote respectively the feed flow rate and pressure of the RO membrane, Qfresh the produced
243
freshwater flow rate, Qreject the rejected water flow rate (very salted water), and (Rmodule, Rvalve, Rmembrane) are the
244
RO membrane parameters whose experimental values are reported in Table 3. Indeed, hydraulic losses into the
245
RO process via the control valve CV (Fig.2), the RO module and the RO membrane are modeled as resistances
246
such as Rmodule, Rvalve, Rmembrane. It should be noted that a RO module can include one or several RO membranes
247
coupled in series. In the studied case, each module contains one RO membrane.
248
Based on (2), (3) and (4), the static model of the hydraulic load (i.e. RO module) of the second process is deduced
249
and expressed by (5) with respect to Qfeed.
250
2 2 4 2 membrane membranefeed membrane feed
mod ule valve mod ule valve
R R P R Q R R R R (5)
According to the hydraulic structure of the desalination process depicted in Fig.2, the feed pressure Pfeed of the RO
251
module results from the sum of different pressures as follows:
252
Inf min
( )
feed HPP tank asp
HPP asp
P P P P
P
g L L
gH
(6)
Where, PHPP denotes the proper pressure given by the HPP which is expressed in the next subsection by (8), Ptank
253
is the resulting pressure from the stored amount of brackish water in the tank T1, Hasp and Pasp denote respectively
254
the brackish water aspiration height and pressure of the HPP.
255
4.2. Storage tank modeling
256
A storage tank is characterized by the stored water level L. The first tank T1 is modeled by (7) describing a
time-257
varying model.258
1 1 ( ) ( ) ( ( ) ( )) t t WP HPP t L t t L t Q t Q t dt S
(7)where, S1 being the surface area of T1, and (QWP and QHPP) denote respectively the well pump and the HP pump
259
flow rates (i.e. input and output flow rates of the tank).
260
4.3. Hydro-Mechanical subsystem modeling
261
The static model of a centrifugal pump is obtained by neglecting the dynamic elements effect from its dynamic
262
model performed in previous work [48]. Thus, the static part of a centrifugal pump is modeled as follows:
263
2 p p p p P ,Q a bQ cQ (8)
p p p p p T ,Q a bQ Q f (9)Where, Pp being the water pump pressure, Qp the pump flow rate, Tp the pump torque, Ω the motor-pump angular
264
speed, and fp is the coefficient of the hydraulic friction in the pump. The pump parameters (a, b, c, fp) have been
265
experimentally identified and are reported in Table 3.
266
Table 3 Hydraulic parameters of different components of the experimental desalination test bench
267
Component Parameter Value Unit
HPP a 0.0002317 Ns²/m² b -0.0005198 Ns²/m² c -0.002427 Ns²/m² fp 0.0038 Nms WP1 a 4e-5 Ns²/m² b -1.767e-5 Ns²/m² c 0.0002 Ns²/m² fp 0.0019 Nms WP2 a 2.446e-5 Ns²/m² b -6.507e-5 Ns²/m²
c 21.205e-5 Ns²/m²
fp 0.002 Nms
RO Membrane Rmodule 1.038e12 Ns²/m8
Rvalve 7.785e12 Ns²/m8
Rmembrane 1.695e10 Ns/m5
4.4. Quasi-static model of a hydro mechanical process
268
With regard to the three-phase Induction Motor (IM) driving the centrifugal pump, the Power Field Oriented
269
Control (PFOC) method has been applied through the associated inverter as depicted in Fig.7. In such a case, the
270
inverter is used to regulate the magnetic flux and control the torque being cascaded with the DC-link voltage
271
control loop [56-57]. In the Park’s d-q reference frame linked to rotating field, the rotor flux is controlled through
272
the d-axis (φrd = φr, φrq = 0).273
FOC Inverter + IMCentrifugal Pump RO Membrane
Power Balance
PI
-+
Vdcref
Vdcavg
System Control Hydro-mechanical Process (One Pump)
1 MGY R: 1 R: I:
-+ 1 0 Pp Qp Pconcentrate Conductivity Temperature, Permeability
Qpermeate MR : Rmemb C:Cmemb R : Rpipe R : Rmodule 1 1 1 Se:Pperm Qconcentrate Controlable valve Membrane Osmotic + permeate pressure MR : Rvalve Pp Qp Rpipe Rmemb Cmemb Qpermeate perm P Rmodule + Rvalve Rejected Water Ppipe Ppipe
274
Fig.7. Block diagram of the control strategy of a single-pump hydro-mechanical process
275
By neglecting power losses via the inverter (denoted ∆PIM in Fig. 6), the power balance is given by:
276
dc p sq sq sd sd
V I V I V I (10)
As a result, based on the above equation and the original equations of the stator and rotor voltages in the d-q
277
reference frame, while neglecting the dynamic elements (i.e. fast transients), the electrical power PIM feeding the
278
motor-pump can be expressed versus the angular speed and the electromagnetic torque (Ω, Tm). The latter
279
variables are in turn expressed versus pump flow rate Qp and are given by (11) and (12).
280
( , ) ( , ) m p p p m T Q T Q f (11) 2 2 ( ) 4 ( ( )) ( ) 2 p p p hyd load p p bQ bQ a cQ P Q Q a (12)Where, Phyd-load denotes the hydraulic load pressure describing the analytical model of the hydraulic load of each
281
hydro-mechanical process. It should be pointed out that the full expression of the motor-pump angular speed
282
Ω(Qp) can be derived from (1) and (8) in case of “pumping process”, and from (5), (6) and (8) in case of
283
“desalination process”, by choosing the positive root of the 2nd order equation.
284
As a result, PIM can be expressed with respect to the pump flow rate Qp by (13).
285
2 2 ( ) r r sr r ( ) ( ) ( ) IM p sr r m p p m p m r m r R L Q R R T Q Q T Q L L L P (13) where,286
2 m sr s r r L R R R L (14)The obtained equation (13) presents a nonlinear and multivariable expression of the feeding electrical power of the
287
motor-pump with its corresponding hydraulic load. In order to determine the pump flow rate with respect to its
288
feeding electrical power, (13) can be reversed by using the “fsolve” function under Matlab software. The inverse
289
expression (i.e. Qp=f(PIM)) describes the quasi-static model of a whole hydro-mechanical process in the
290
desalination system.
291
4.5. Practical validation of the quasi-static model
292
In order to validate the developed models of the two hydro-mechanical processes, model-based simulation results
293
are compared to the models extracted from experimental characterizations (in steady-state) of each
hydro-294
mechanical process of the desalination experimental set-up (for more details on the experimental characterizations
295
see sub-section 3.2) in ref. [51]). This comparison is illustrated by Fig.8 that presents the water flow rate variation
296
curves Qp=f(PIM) for the three used motor-pumps (WP1, WP2 and HPP) with respect to the drawn electrical
297
power by each motor-pump. According to this, an energetic coherence between the dynamic and quasi-static
298
models of each hydro-mechanical process has been proved. These results put forward the great worth of the
quasi-299
static modeling to be used in order to set and optimize the energy management strategy which is defined and
300
discussed in the next section.
301
302
Fig.8. Comparison of the developed and experimental models for the different hydro-mechanical subsystems of (a) well pump WP1 (b) well
303
pump WP2 and (c) high pressure pump HPP.
304
5. Energy management strategy
305
This section is divided into two parts. The first one is devoted for setting the energy management problem. The
306
second part is dedicated to describe the energy management strategy (EMS) that is based on deterministic rules.
307
5.1. Setting the water/power management problem
308
As electrochemical storage is substituted by hydraulic storage in water tanks, the desalination system includes two
309
decoupled and independent hydro-mechanical subsystems. The energy requirements of these subsystems are not
310
the same depending on their operating points. The latter depend on both the hydraulic characteristic curve of the
311
pump (imposed following the rotational angular speed of the motor-pump) and the hydraulic load characteristic
312
curve of each pump. This needs to develop a specific EMS permitting to manage simultaneously the power and
313
water flows into the system while fulfilling the technological (power and pressure ranges) and functional (tank
314
filling state) constraints. The principle of the proposed EMS is defined such as the input variable generated power
315
from RESs can be dispatched between the different pumping devices according to a power sharing factor (αi)
316
defined as:317
i p i dc P P (15) With:318
1 1 n i i
(16) min max i i i p p p P P P (17) Inf Sup min max L L L (18)Where Ppi and i denote respectively the electrical power that should be addressed to the ith motor-pump of the
319
system, and its corresponding power sharing factor, Pdc denotes the input DC-link power to be dispatched, and n
320
is the total number of pumping devices.
321
The objective of the EMS described by equations (15), (16), (17) and (18) is to maximize the freshwater
322
production of the system according to the available renewable energy generation while respecting the system
323
constraints. Maximizing freshwater production following the available renewable energy is beneficial in terms of
324
freshwater storage that presents a new form of energy storage. The idea is to maximize and store freshwater, for
325
later use when renewable energy is unavailable.
326
The power value Ppi for the ith switched-On pump is considered as reference value that should be given by the
327
EMS based on (15). The choice of the Ppi value is constrained by both the power range of the ith motor-pump and
328
the tank filling state confines as defined in (17) and (18), respectively. This principle is applied for all pumping
329
devices. Thus, according to both input generated power and the T1 filling state, the i value is computed and
330
subsequently the Ppi value of each pump is determined. Then, according to the power value Ppi and to the
331
operation time of each pump the brackish water level in the tank T1 (defined by (7)) will be varied (i.e. increased
332
or decreased). For example, in case of low value of 1 = (PWP1/ Pdc), the well pump (WP1) operates in the region
333
of low efficiency due to the very low input power. For this reason, no remarkable increase in the water level can
334
be noticed, but on the other side the high pressure pump (HPP) operates with high input power and good
335
efficiency (i.e. PHPP = 2Pdc = (1- 1) Pdc, in case of n = 2). This, advantageously leads to increase the freshwater
production. On the opposite case with higher 1 values, WP efficiency can be improved and the brackish water
337
level in the tank increases accordingly. This enables to increase the storage amount of brackish water in the tank
338
for later use by the RO process when the renewable energy is available. It is also possible to simultaneously store
339
brackish water in the tank and produce freshwater when the renewable energy is abundant (i.e. very high
340
generated power supply). Therefore, the generated power from renewable sources is strongly coupled with the
341
water process system efficiency: in particular, the importance of respecting pumping power limits as defined in
342
(17) is put forward to prevent problematic operations that degrade efficiency and could also reduce the lifetime of
343
pumps. The latter issue emphasizes the first coupling between “power and subsystems efficiency”.
344
On the other hand, EMS performance is affected when modifying the sizing of motor-pumps. It depends on the
345
choice of the motor-pump rated power: here respectively (0.75kW and 2.2kW) as initial combination in the
346
desalination system, then (0.37kW and 2.2kW) as a second combination. Indeed, by choosing another
motor-347
pump with lower rated power, but with relatively high flow rate, energy efficiency of the motor-pump can be
348
relatively improved with a lower power consumption Ppi. Consequently, EMS performance will be influenced.
349
This issue emphasizes the second coupling between “sizing and management performance”.
350
A third coupling between “tank level and power management” has to be managed. Indeed, after a certain
351
operation time of the WP(s), the maximum filling level of the tank T1 can be attained and subsequently WPs must
352
be shut down. On the other hand, operating the HPP is only possible if the tank T1 is not empty.
353
Based on this strongly coupled system design (water management and pump sizing), a Deterministic Rule-based
354
EMS is developed. It consists of deterministic energy dispatch that evaluates the system states of the desalination
355
system based on set rules, then computes the respective energy dispatches.
356
It should be noted that the experimental desalination test bench installed in our research laboratory (L.S.E in
357
ENIT-UTM, Tunis, Tunisia) presents a prototype including two pumping devices: one WP and one HPP. Indeed,
358
the experimental test bench is exploited for two sizing steps: the first sizing is 0.75kW for well pumping and
359
2.2kW for the RO process, and the second sizing is respectively 0.37kW and 2.2kW whose characteristics are
360
reported in Table 2. It is a simplified case study, but the methodology may be extrapolated to any number of
361
subsystems. In this work, it can be extrapolated to three pumping devices: two parallel WPs functioning through
362
exploiting pumps modularity versus the input power, and one HPP. So, in the next subsection the influence of
363
both “pump sizing” and “modularity” on management performance are investigated and analyzed.
364
In this work, the suitable power range [Pmin – Pmax] of each pumping device has been experimentally identified
365
(for more details see ref. [51]) while functioning with a given hydraulic load.
366
5.2. Rule-based EMS
367
According to the given power Pdc, and given the hydraulic loads characteristics, a modular approach (i.e. several
368
motor-pumps that can be switched on/off and tuned) for energy management is applied to the studied system. This
369
management approach is based on different operating modes that can be switched during the system operation.
370
Indeed, from the power ranges of motor-pumps, three main operating modes are considered and explained in
371
Table 4. The operating mode preference essentially depends on: i) the given power supply Pdc, ii) the stored water
372
level L in the tank T1 that must vary on its specified confines (LminInf ≤ L ≤ LmaxSup), and iii) the operating power
373
range of each pumping device [Pmin – Pmax].
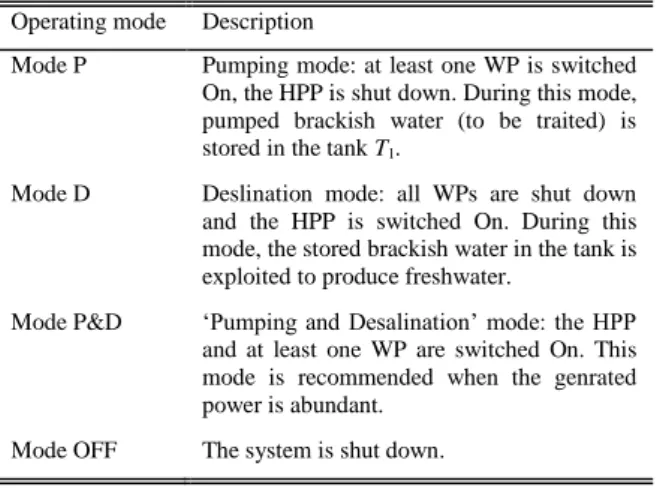
Table 4 The possible operating modes of the BWRO desalination system
375
Operating mode Description
Mode P Pumping mode: at least one WP is switched On, the HPP is shut down. During this mode, pumped brackish water (to be traited) is stored in the tank T1.
Mode D Deslination mode: all WPs are shut down and the HPP is switched On. During this mode, the stored brackish water in the tank is exploited to produce freshwater.
Mode P&D ‘Pumping and Desalination’ mode: the HPP and at least one WP are switched On. This mode is recommended when the genrated power is abundant.
Mode OFF The system is shut down.
376
Regarding the storage tank T1, four limit levels (LminInf, LminSup, LmaxInf, LmaxSup) are defined in this study. The idea
377
of choosing such boundaries is to maintain the tank filling state within an acceptable range [LminSup – LmaxInf].
378
Moreover, each limit interval ([LminInf – LminSup], [LmaxInf – LmaxSup]) permits to avoid respectively the tank
379
emptying and overflow. These intervals make a “safety margin” against the successive occurrence of
motor-380
pumps-switched On/Off. For example, within the [LminInf – LminSup] margin the HPP must be shut down in order
381
to avoid emptying the tank and only the WP should operate to increase the water level if the renewable power is
382
available. This may avoid the successive HPP-switched On/Off. The opposite case is considered for the [LmaxInf –
383
LmaxSup] margin.
384
In order to study the influence of pump sizing and modularity on management performance, four pump
385
combinations are proposed that are summarized in Table 5 and corresponding operating ranges are illustrated in
386
Fig.9. For example, for Comb.3 where the WP1, WP2 and HPP are used, three different power ranges have to be
387
considered in the energy management that are respectively as follows: [120W–1020W], [120W–370W] and
388
[620W–1800W]. Three additional limits are also added which are as follows: (2170W = 370W+1800W),
389
(2820W = 1020W+1800W), and (3190W = 370W+1020W+1800W). As a result, nine power intervals are
390
obtained to be tested on the input generated power Pdc in the rule-based power sharing algorithm. So, the decision
391
making for power sharing depends on the Pdc value and the filling state of the storage tank as depicted in Fig.9.
392
For example, if (Pdc = 700W ϵ [620W–1020W]) and (LminSup < L < Lintermed) then (α1 = 1, α2 = 0 and α3 = 0). That
393
means that the WP1 is set On (i.e. PWP1 = Pdc), and the {WP2 and HPP} are shut down (i.e. PWP2 = PHPP = 0). In
394
this case, the system takes benefit of the total generated power to operate only in pumping mode in order to
395
increase the brackish water storage amount in the tank. When the generated power increases (e.g. Pdc = 1000W)
396
and the brackish water level exceeds the intermediate level (i.e. L > Lintermed), then (α1 = 0, α2 = 0 and α3 = 1). In
397
this case, the system operates only in desalination mode (i.e. PHPP =Pdc) to produce freshwater and the well
398
pumps are both shut down (i.e. PWP1 = PWP2 = 0).
399
According to the different pump-combinations four different Deterministic Rule-based algorithms are developed
400
and tested for energy management. One example of the developed rule-based algorithms is described through the
401
flowchart depicted in Fig.10 giving an idea on the mode preference according to the input power and the current
402
water level in the tank. Indeed, the presented algorithm offers several degrees of freedom permitting to optimize
403
the different pumps operation, namely: for the input electrical power by defining thresholds (PWPmin, PWPmax,
PHPPmin, PHPPmax, Pmax=PWPmax+PHPPmax), and for the storage tank by defining thresholds (LminInf, LminSup, Lintermed,
405
LmaxInf, LmaxSup). The intermediate level defined by (19) is a supplementary threshold limit defining the power
406
dispatching strategy. So, as illustrated in Fig.9 under this level (L ≤ Lintermed), the priority is addressed to the well
407
pumping (brackish water storage) over the desalination process so that WP(s) can function as much as possible to
408
fill the storage tank. In addition, when the renewable energy is abundant, it is possible to operate simultaneously
409
the two processes while ensuring that: QWP ≥ QHPP in order to prevent emptying the tank. In this case, the system
410
operates in pumping mode with “desalination mode in a moderate way”. On the opposite, when L > Lintermed there
411
is enough stored brackish water. This enables to switch the priority to the desalination process over well pumping
412
leading to maximize the freshwater production. In addition to that, when the renewable energy is abundant both
413
processes can operate simultaneously while ensuring that: QWP ≤ QHPP in order to prevent tank overflow. In this
414
case, the system operates in desalination mode with “pumping mode in a moderate way”. This strategy is
415
implemented and described through the flowchart of one developed EMS that is illustrated in Fig.10.
416
Inf Sup min max intermed 2 HPP WP L L Q L Q (19)Table 5 Different pump combinations
417
Comb.1 Comb.2 Comb.3 Comb.4
Pump combination WP1/HPP (0.75/2.2 KW) WP2/HPP (0.37/2.2 KW) WP1/WP2/HPP (0.75/0.37/2.2 KW) WP2/WP2/HPP (0.37/0.37/2.2 KW)
Note that the flow rate Qpi of the ith pump is computed by inverting the expression (13) and using the reference
418
feed power value of the ith pump calculated by (15). The task here is to compute the instantaneous values of the
i
419
factor enabling to reach the sought objective of EMS. Simulation results are analyzed in the next section.
420
421
Fig.9. Power ranges for different pump combinations with operating mode preference according the stored water level
422
423
Fig.10. Flowchart of the Deterministc Rule-based energy management strategy for Comb.1
424
6. Simulation results analysis
425
This section is dedicated to analyze the EMS performance through simulations where different components sizing
426
and different pump-combinations are considered.
427
The simulations have been accomplished using real data of hybrid PV/Wind power generation recorded every
428
hour from January to December, 2007 of a region in Southeast Tunisia: Djerba-Midoun. The PV source is
429
composed of 8 monocrystalline modules (from elysun) of 250Wp each, where the total generated power is of
430
2kWp. As for the wind turbine source, the Aeolos-H 2kW wind turbine is used with rated power of 2kW.
431
The different dispatch algorithms have been coded under Matlab© software using the simulation parameters
432
reported in Table 6 where the considered sampling period is 2.5 minutes (i.e. the sampling period is Ts = 2.5 x 60
433
= 150s). Indeed, an interpolation has been performed on the recorded hourly power profile in order to modify the
434
sampling period (Ts = 1h) which represents a long time interval for the proposed EMS. A daily and weekly power
435
profiles, depicted in Fig.11, were considered for tests and analysis. It should be noted that during simulations two
436
RO membranes have been considered.
437
Table 6 Simulation parameters
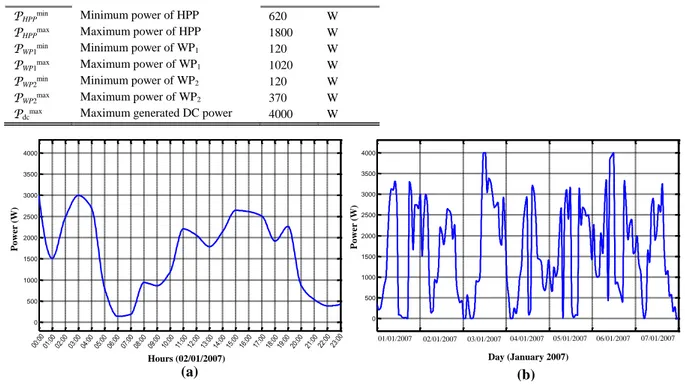
438
Symbol Description Value Unit
k1 Number of samples in a day 553 samples
k2 Number of samples in a week 4009 samples
k3 Number of samples in a year 210217 samples
Ts Sampling period 150 s
Tt Total time for one day 82950 s
FSmax Maximum Filling State of the tank 100 %
FSmin Minimum Filling State of the tank 10 %
PHPPmin Minimum power of HPP 620 W
PHPPmax Maximum power of HPP 1800 W
PWP1min Minimum power of WP1 120 W
PWP1max Maximum power of WP
1 1020 W
PWP2min Minimum power of WP2 120 W
PWP2max Maximum power of WP
2 370 W
Pdcmax Maximum generated DC power 4000 W
0 500 1000 1500 2000 2500 3000 3500 4000 Hours (02/01/2007) Pow er (W) 0 500 1000 1500 2000 2500 3000 3500 4000 01/01/2007 02/01/2007 03/01/2007 04/01/2007 05/01/2007 06/01/2007 07/01/2007 Pow er (W) (a) (b) Day (January 2007)
439
Fig.11. Daily (a) and weekly (b) PV-Wind generated electrical power profiles
440
Results of the developed EMS for each pump combination are reported in Table 7. These results are assessed in
441
terms of freshwater production qfresh (in m3) for the two presented power profiles. As it is previously explained, the
442
main objective of the EMS is to maximize as much as possible the freshwater production while taking benefit of
443
the available renewable energy. This permits to increase as much as possible the freshwater amount storage that
444
will be used later when renewable energy is unavailable. In such a way, electrochemical storage device can be
445
avoided. According to this criterion, best results (i.e. the higher produced freshwater amount) are indicated in bold
446
type in Table 7. It can be deduced from this table that the most appropriate combination in terms of freshwater
447
production is Comb.4 where two parallel identical well pumps with a rated power of 0.37kW each are used for the
448
welling process. The pump modularity approach is applied here; according to the generated input power level the
449
well pumping process can operate either a single pump (0.37kW), or simultaneously the two parallel pumps where
450
the input power is shared between them. This approach has the advantage of operating only one pump WP2 with
451
lower rated power (0.37kW), but with higher energy efficiency when the given input power is very low compared
452
with the single pump WP1 (0.75kW). Then, when the input power level rises, the modularity approach offers the
453
possibility to operate simultaneously more than one pump operating each with good energy efficiency.
454
Moreover, the influence of HPP sizing on the system efficiency is also analyzed: so the previously used HPP
455
(EBARA EVM2 22F/2.2) is substituted now by a new HPP (rated power of 1.5kW instead of 2.2kW) and used for
456
all previous pump combinations. The new HPP, where characteristics are reported in Table 8, was selected from
457
the Grundfos manufacturer's catalog. Its electrical and hydraulic characteristic curves were taken from the
458
Grundfos Product Center, an online tool proposed by Grundfos for the research and design of pumps. Simulation
459
results for the different pump combinations with the new HPP are reported in Table 9. For the sake of visibility,
460
the obtained results are illustrated in Fig.12 and Fig.13 where changes on the freshwater amounts are more
461
visualized. It is noticed that the freshwater production is improved when using the new HPP whose rated power is
462
lower than the first one, but with higher energy yield.
463
Table 7 Produced freshwater quantity (in m3) according to component sizing