HAL Id: hal-01982667
https://hal.archives-ouvertes.fr/hal-01982667
Submitted on 15 Jan 2019HAL is a multi-disciplinary open access
archive for the deposit and dissemination of sci-entific research documents, whether they are pub-lished or not. The documents may come from teaching and research institutions in France or abroad, or from public or private research centers.
L’archive ouverte pluridisciplinaire HAL, est destinée au dépôt et à la diffusion de documents scientifiques de niveau recherche, publiés ou non, émanant des établissements d’enseignement et de recherche français ou étrangers, des laboratoires publics ou privés.
In-Situ Quantitative and Multiscale Structural Study of
Starch-Based Biomaterials Immersed in Water
Chloé Chevigny, Laurent Chaunier, Ruzica Ferbus, Pierre Roblin, Corinne
Rondeau-Mouro, Denis Lourdin
To cite this version:
Chloé Chevigny, Laurent Chaunier, Ruzica Ferbus, Pierre Roblin, Corinne Rondeau-Mouro, et al.. In-Situ Quantitative and Multiscale Structural Study of Starch-Based Biomaterials Im-mersed in Water. Biomacromolecules, American Chemical Society, 2018, 19 (3), pp.838-848. �10.1021/acs.biomac.7b01635�. �hal-01982667�
OATAO is an open access repository that collects the work of Toulouse
researchers and makes it freely available over the web where possible
Any correspondence concerning this service should be sent
to the repository administrator: tech-oatao@listes-diff.inp-toulouse.fr
This is an author’s version published in:
http://oatao.univ-toulouse.fr/21257
To cite this version:
Chevigny, Chloé and Chaunier, Laurent and Ferbus, Ruzica and
Roblin, Pierre
and Rondeau-Mouro, Corinne and Lourdin, Denis
In-Situ Quantitative and Multiscale Structural Study of
Starch-Based Biomaterials Immersed in Water. (2018) Biomacromolecules,
19 (3). 838-848. ISSN 1525-7797
In-Situ Quantitative and Multiscale Structural Study of Starch-Based
Biomaterials Immersed in Water
Chloé Chevigny,
*
,†Laurent Chaunier,
†Ruzica Ferbus,
‡Pierre Roblin,
†,§,∥Corinne Rondeau-Mouro,
*
,‡and Denis Lourdin
††UR 1268 Biopolymères Interactions Assemblages, INRA, 44300 Nantes, France ‡IRSTEA, UR OPAALE, 17 Avenue de Cucillé, CS 64427, 35044 Rennes Cedex, France
§Synchrotron SOLEIL, L’orme des merisiers, Saint Aubin, BP 48, 91192 Gif sur Yvette Cedex, France
ABSTRACT: The behavior upon immersion in water of two types of starchy materials of biomedical relevance, amorphous potato starch and glycerol-plasticized potato starch, is analyzed in depth. Synchrotron X-ray scattering, specifically wide-angle X-ray scattering (WAXS), and magnetic resonance microimaging (MRμI) are used as very precise and nondestructive quantitative methods to monitor water transfers and structure changes in the samples, with refined spatial and kinetics results. The ingress of water in the cylinder-shaped samples can be inferred from both techniques, and from this, a diffusion mechanism is deduced for each sample type. Qualitatively, scattering and imaging give comparable results: plasticized samples are shown to behave close to a Fickian diffusion case, amorphous samples close to a case II. WAXS results also provide an in-depth knowledge of the crystalline structures associated to each step of the water ingress, and these are in turn correlated to water diffusion. To refine these observations, a recrystallized starch sample is also analyzed via WAXS. This study gives better insight into the structure of a material with a huge biomedical potential (as implants, for example), and for such applications, the behavior upon immersion in water is particularly relevant.
1. INTRODUCTION
Polysaccharides are widely used in biomaterials development.1 Among these, starch is commonly employed because of its widespread availability and it can be obtained from a lot of different sources (such as maize, potatoes, wheat, ...) as a low-cost product. Starch is a very versatile raw material that can be processed by extrusion, injection molding, and thermomolding into either porous or dense thermoplastic materials. The mechanical properties, and particularly the rigidity of starch-based materials, can be modulated by the addition of plasticizers such as glycerol or sorbitol, which decrease the glass transition temperature of the material.2,3 Due to its biocompatibility and biodegradability, starch is also introduced in formulations suitable for biomedical applications. In these applications, the degradation profile, swelling ratio, and controlled release capacity of starch containing materials have been studied. Various modified starches,4−6 such as hydrox-ypropyl starch-ethyl methacrylate, starch-methacrylate,7 and starch-ethylene vinyl alcohol, have been used either as hydrogels or as thermoplastic materials.8,9 Starch, including modified starch and starch blends, was also introduced in composite materials to improve their biocompatibility.10,11
Over the past decade, there has been a growing interest in using starch as a biomaterial for tissue engineering applications. Starch was added, for example, to polycaprolactone materials, to improve cell adhesion and proliferation,12 enhance angio-genesis, and promote in vivo tissue integration13,14 and repair.15−17 For such applications, only starch-based materials have proven their potential so far. Once starch is processed into an amorphous material via extrusion, it can develop a
shape-memory ability which can be triggered by the use of its native humidity sensitivity properties.18 As such, it can be used to make stents, scaffolds, and other types of implants.19,20Because of the lack of minor components in its composition, such as proteins or lipids, starch extracted from potato stands as the best biocompatible candidate among other starches. Velasquez et al. reported the behavior of potato starch materials immersed in a physiological medium to evaluate implantation con-ditions.21Extruded starch plasticized with 20% glycerol appears highly resistant, since it maintained its integrity during the water uptake over 1 month, after a 4 h swelling phase, in comparison to amorphous extruded starch without glycerol which swelled rapidly and then crumbled upon immersion. The initial degree of crystallinity and water-induced crystallization during immersion seem to be key factors of these properties (glycerol-containing samples are semicrystalline). Besides, the extrusion itself could be important: the extrusion mechanical energy (specific mechanical energy, SME) is lower when a plasticizer is used, indicating a gentler process.22
The following Article therefore focuses on the understanding of structural changes in extruded starchy materials during their immersion in water. Indeed, while glycerol-plasticized samples have been proven more resistant to water and biodegradation, thus making them potentially interesting for biomedical applications such as implants, the reason for this behavior is still unclear. One of the main differences with nonplasticized
starch materials is the semicrystallinity of glycerol-plasticized samples. Aiming to uncorrelate the influence of crystallinity and of glycerol content on the water-immersion behavior, three samples of extruded potato starch have been chosen:
• amorphous (S)
• amorphous then recrystallized (S-REC): same batch as (S) but with post-treatment for recrystallization • plasticized with 20% glycerol (S-GLY20): a different
extrusion batch, with gentler conditions
Several quantitative characterizations relevant to the envisioned biomedical applications have been carried out at different immersion times and on different spots of the samples, from the center to the material/water interface: local structure, i.e., crystallinity and polymorphism, kinetics of water uptake, and amount of degradation (or persistence) of the original material. Precision, both in time and space, was required to correctly assess the effects of immersion. This was achieved using synchrotron X-ray scattering focusing on the wide-angle X-ray scattering (WAXS) method. Complementary measures by magnetic resonance microimaging (MRμI) were made on the glycerol-plasticized material because of its relevance to monitor water transfers in samples and relative to their size (4 mm in diameter). The water uptake, diffusion, and swelling mechanisms inferred are discussed in light of the sample local structures. Finally, a tentative explanation of the different behaviors upon immersion in water is proposed for each sample type.
2. MATERIALS AND METHODS
2.1. Raw Materials. Potato starch was purchased from Roquette (Lestrem, France). The initial moisture content was approximately 13% of the wet basis weight (wb) or 15% dry basis (db). Glycerol (99% purity) was purchased from Sigma-Aldrich Chemie GmbH (Steinheim, Germany).
2.2. Extrusion and Sample Preparation. Prior to extrusion, water was added to adjust the starch moisture content to 27% wb (37% db). For the samples containing glycerol, the glycerol content was adjusted to 20% wb (27% db). Starch was mixed with water or water and glycerol in a laboratory kneading machine. Starch was extruded using a SCAMIA single-screw device (Rheoscam Type 20.11d, Crosne, France) with a die outlet diameter of 3 or 4 mm. The sample shape obtained is a dense cylinder.
The thermomechanical conditions are summarized inTable 1.
All samples are cylinder-shaped materials with a diameter around 3.5 mm (±0.5 mm). Extruded starch (S) and starch−glycerol (S-GLY20) samples were stabilized in desiccators containing a saturated sodium bromide (NaBr) solution with a relative humidity (RH) of 59% at 20°C for 15 days, in order to reach equilibrated water content before subsequent analysis. Final samples are either fully amorphous (S) or have a crystallinity rate (B-type) of 17% (S-GLY20). Their glass transition temperatures are, respectively, 75 and 12°C for S and S-GLY20.
Recrystallized starch (S-REC) samples were prepared by letting stabilized samples recrystallize for 10 days in a high humidity atmosphere (RH 100%), then stabilizing the resulting samples again at the reference humidity levels (15 days at 59% RH). Final samples have a crystallinity rate of 18% (B-type) and a Tgaround 80°C.
The crystallinity rate Rcrystallinity is calculated using Wakelin’s
method23 on dry samples. In the case of immersed samples, the water signal is simply subtracted and then the method applied as before:
= + ×
Rcrystallinity Areacrystals/(Areacrystals Areaamorphous) 100 (1) 2.3. Magnetic Resonance Microimaging (MRμI). 2.3.1. Setup. The NMR tube (Ø 1 cm) wasfirst filled to a 20 mm height with a 4:1 mixture of deionized H2O and D2O containing 1 g/L copper sulfate
salt (CuSO4), called doped water (spin−spin relaxation time T1of 345
± 3 ms). The S-GLY20 sample was then fixed between a Teflon plug and a sample holder spacer made of Teflon, so that diffusion of water occurred almost exclusively in the radial direction. The NMR tube containing sample was placed in a 11.7 T NMR spectrometer (500 MHz) (Avance III, Bruker, Wissembourg, France) equipped with a microimaging probe Micro5, with a 10 mm insert and gradient coils capable of reaching nominal pulsed gradients of 3 T/m along the three axes. The temperature of the microimaging probe was regulated by a water cooling system (BCU20, Bruker, France) and was kept constant at 22± 1 °C throughout the imaging experiments.
2.3.2. Measures. A multislice gradient echo FLASH (Fast Low Angle SHot) sequence was performed in two dimensions with an echo time (TE1) of 2.57 ms, a flip angle of 30°, five averages, and a repetition time (TR) of 0.9 s, leading to an acquisition time of about 9 min for each image. The repetition time was optimized according to the low angle mapping method (LAM).24A matrix of 128× 128 pixels was used with afield of view (FOV) of 9 × 9 mm2and three slices of 1
mm thick to image the median plane of the sample (transverse section at middle height of the sample) with a pixel resolution of 70× 70 μm2. The sample immersed in water was imaged every 9 min from 20 min to 22 h of immersion. The water uptake was measured on two replicates.
2.3.3. Data Treatment. The images were acquired and processed with the ParaVision software (PV.6) supplied by Bruker (France, Wissembourg). The mean diffusion coefficient D̅ was calculated by minimizing the sum of square error between the experimental and predicted water diffusion coefficient values using Solver in Microsoft Excel (Redmont, WA, USA).
2.3.4. Determination of Water Content for Microimaging Samples. The initial water content, determined by drying the samples in an oven at 103°C for 24 h, was 11% wb (13.4% db). The water content of all samples was determined by measuring mass variations before and after immersion (water adhering to the outer surface of the cylinders was removed by soft drying with a paper towel). The dry matter after 22 h of immersion was determined after drying the samples in an oven at 103 °C for 24 h. The calculation of water content was done using the following equation:
= m −m ×
m
water content (%) wet sample dry sample 100
wet sample (2)
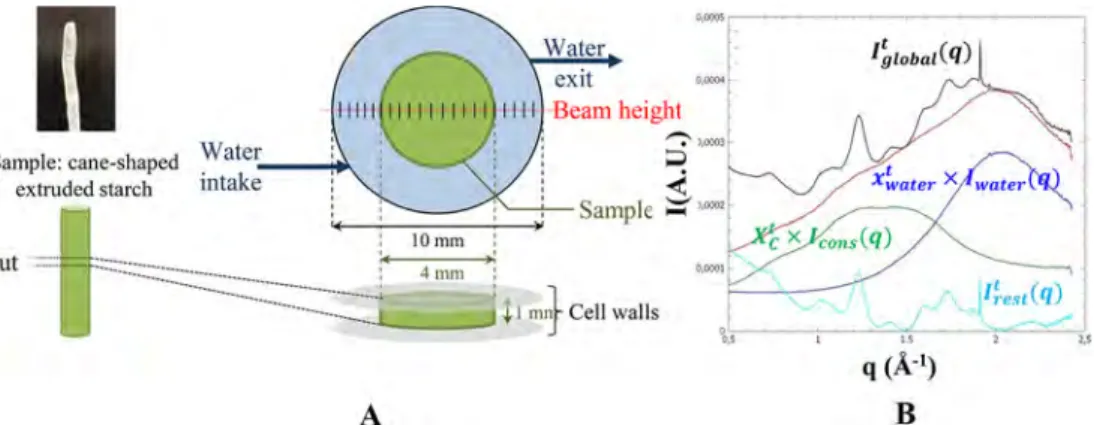
The results showed that samples immersed in water for 22 h absorbed 29± 3% of water compared to their initial dry mass. After taking the initial water content into account, the samples after experiments were hydrated at 39.6± 2.8%, calculated on a wet basis (65.6 ± 2.9% db). 2.4. Synchrotron Experiments. 2.4.1. Setup. Samples were cut into∼1 mm thick disks and placed between mica plates in a closed measurement cell allowing circulation of liquid (Figure 1A). The sample cutting procedure is a highly sensitive process for such a hard vitreous specimen, and samples can end up very slightly asymmetric. Measurements were made at 25°C. To follow the evolution of the structure induced by water uptake, measurements were made along the cell every 6 min of thefirst hour and then every 16 min at least during 2 h. Measurement of a single spot takes a few seconds, whereas a complete scan lasts about 5 min (+1 min to go back to the starting point). A total of 21 equidistant spots, every 0.4 mm along an 8 mm diameter, were recorded.
2.4.2. Measures. Scattering experiments (WAXS) were performed at the SWING beamline at Synchrotron Soleil (St-Aubin, France). The sample−detector distance was fixed at 0.5 m and the X-ray energy was
Table 1. Extrusion Conditions of Starch Samples
sample die temperature (°C) flow rate (g min−1) SME (J g−1)
S 120 3.5 341
12 keV, corresponding to a q-range from 2 × 10⁻² to 2.4 Å−1. Scattering patterns were acquired on a CCD Aviex detector. Water is pumped through the cell at a slow rate of 12 mL/h, to mimic human salivaflow. All samples were first scanned in the dry state. The cell was then quicklyfilled with water, and the first (t = 0) in-water scan took place.
2.4.3. Data Treatment. Data was reduced from 2D patterns to 1D curves using FOXTROT, a homemade program. This way, the“basic spectra” were obtained, i.e., untreated I = f(q) for each of the 21 spots along the measurement cell at every time stamp (1 every 6 min of the first hour, 1 every 16 min for the remaining time, between 2:30 and 7:30 total, 25 different time stamps at least), which makes over 525 spectra to study for every type of sample (i.e., samples S, S-GLY20, and S-REC).
These basic spectra required extra treatment to extract useful data, namely, water uptake and conservation rate. To do so, the first hypothesis was that the total scattered intensity Iglobalt (q) is the sum of
a pure water contribution Iwater(q) at a rate xwatert , a dry sample
contribution Icons(q) at a rate XCt, and the rest Irestt (q) which correspond
mainly to crystallinity created upon immersion:
= × + × +
Iglobalt ( )q Xwatert Iwater( )q XCt Icons( )q Irestt ( )q (3) The “t” exponent indicates that the corresponding term is time-dependent; to lighten the text, this exponent is implied from now on. The water contribution is available from the spectra on the outermost sides of the measuring cell (#1−2 or #20−21 spots; seeFigure 1A for reference), and Icons(q) from the dry sample measurement. The
importance of each contribution is assessed by minimizing Irest(q)
while staying superior to zero. It is necessary to calculate both
contributions together. The maximum contribution is between 1 Å−1< q < 2 Å−1for Icons(q) and 1.5 Å−1< q < 2.5 Å−1for Iwater(q), so there is
a lot of overlap between them.Figure 1B graphically explains these different notations, for a point in the center of the amorphous starch sample (S) at the end of the kinetics (7 h). The calculation was scripted through Matlab (Mathworks, Natick, MA, USA) and automatized to allow the treatment of all of the available data. From thisfitting, at each spot and time interval, a value of xwaterand XCwas
extracted. While the physical significance of xwateris obvious (water
concentration), XCis a little more complex. It represents the amount
of the remaining original sample structure, i.e., the conservation of the original structure. Indeed, during immersion, water diffuses into the material, crystallinity increases, and some of the initial material is released in water. For the evaluation of the sample evolution through time, a relative water uptake XWwas defined, at the sample center only,
by the following equation:
= −
XWt xwatert xwater0 (4)
This adjustment was necessary because the measurement cell is not a perfect fit with the surface of the samples, and at t = 0, the dead volume in the cellfills up with water, increasing the water contribution to the diffracted intensity. The corresponding amount of water is not related to the water uptake by starch, which is zero at that moment. Thefirst measurement, at time T0, is actually done after 5 min of
immersion due to experimental constraints of a synchrotron. 2.5. Diffusion Mechanism. Analytical equations enable fitting the water profiles obtained by MRμI and WAXS synchrotron data analysis. The description of the complete diffusion process over time could be Figure 1.(A) Starchy sample (green) immersed in circulating water (blue) and the 21 measurement spots (small perpendicular black lines, left to right:#1 to #21) along an 8 mm diameter (total cell diameter is 10 mm). The right figure (B) shows the data extraction of xwatert and XCt from the
measured spectrum at one given spot in time: total scattered intensity Iglobalt (q) (black line), adjusted water signal xwatert × Iwater(q) (blue line),
adjusted conserved sample signal XCt × Icons(q) (green line), the sum xwatert × Iwater(q) + XCt × Icons(q) (red line), and leftover signal Irestt (q) (light blue
line).
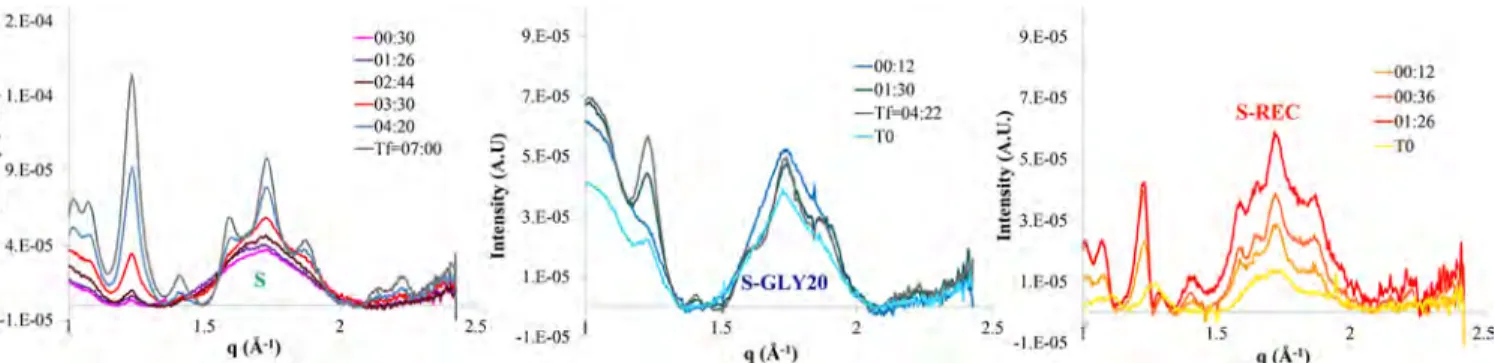
Figure 2.Evolution across starchy samples of the conservation rate XC, from left to right: (A) amorphous extruded starch (S), (B) extruded starch
with 20% glycerol (S-GLY20), (C) recrystallized extruded starch (S-REC). The time of each scan (hh:mm) is indicated on the corresponding curve with matching color code.
achieved by using the following equation of the mean diffusion coefficient25
̅ =
D ctn (5)
where c is a parameter related to the velocity of the diffusion and n is representative of the penetration kinetics. The mean diffusion coefficient D̅ was calculated using the Solver in Microsoft Excel by minimizing the sum of square error between the experimental and predicted water diffusion coefficient values. The parameter n makes it possible to choose among various diffusion mechanisms. The diffusion of water into polymers has been reported to occur between two limiting cases, namely, Fickian (or case I) diffusion where n is equal to 0.5 and case II diffusion where n is equal to 1. Intermediate values indicate a non-Fickian or anomalous process of diffusion. For Fickian diffusion, the concentration gradient is the driving force and occurs when the rate of diffusion of the penetrant is much slower than the rate of relaxation of the polymer chains. In case II diffusion, the rate of relaxation of the polymer chains under stress induced by the increase in volume on swelling is slow relative to the rate of penetrant diffusion, and so is the controlling factor. Case II sorption and simple Fickian diffusion can be considered as limiting cases corresponding respectively to relaxation- and diffusion-controlled mechanisms.
3. RESULTS AND DISCUSSION
3.1. Synchrotron: Wide-Angle X-ray Scattering. 3.1.1. Cross Sections. Conservation Rate. Figure 2 presents the cross sections of the conservation rate XCfor each type of sample at various relevant immersion times. Because the kinetics are not the same depending on the sample observed, the relevant immersion times displayed on thefigures can vary. The full observation time is also different for each sample, again because of the different kinetics: 7:00 for (S), 4:22 for S-GLY20, and 3:18 for S-REC.
As a side note, the S-GLY20 sample appears asymmetric, most probably because it was not cut as straightlyflat (it is a very sensitive procedure) and therefore one side was slightly thicker than the other. X-ray scattering intensity being sensitive to the cross-section thickness results in this artificial asymmetry. The asymmetry decreases with immersion time as the sample gets softer andflattens.
Both S-GLY20 and S-REC samples appear to have the same general interface type. They display a sharp interface with water, while swelling a little (spot#16 is entirely in water at t = T0, whereas it seems to be within the sample later in time). No change in interfacial gradient is visible within the samples. The conservation rate decreases with time (below 50% for both samples by the end of the measure) homogeneously across the whole sample (from spot #7 to #16−19, depending on the immersion time). This decrease could be crystallization or mass transfer. Because the sample center has the same conservation rate as the interfaces, crystallization seems more likely. Material transfer would be hindered from the center with the difficulty of diffusing long chains through the sample.
On the other hand, the evolution of XCfor the amorphous sample S is different than that for those two semicrystalline samples. Indeed, a gradient in XCis formed over time. While XC decreases regularly with time within the sample, as expected, it decreases much more strongly and rapidly near the interfaces and less toward the sample center. After the first hour of immersion, the original shape is lost, and at the end of the measurement (7:00), XC shows a gradient of starch concentration in water across the whole cell. The change in the amorphous S sample could come from mass transfer as well as from crystallization, or more probably from a combination of both.
Water Content. Parallel to the XCcross sections, the water content xwatercross sections are presented for S and S-GLY20 samples inFigure 3. No data could be presented for the S-REC
sample because the water concentration grows very heteroge-neously, making the analysis of this cross section irrelevant. The most probable reason for this behavior is the very different hydrophilicity (and thus water diffusion rates) between amorphous and crystalline zones, which creates water-rich zones or globules within the sample. Interestingly, this behavior is not seen in the semicrystalline sample S-GLY20, which has a different structure.
As stated before in theMaterials and Methods section, the xwatervalue shown here is an absolute value of the water content in the cell, including waterfilling dead volumes between the cell wall and the sample. This explains why, at t = T0, values as high as 0.2 and 0.4−0.5 for S and S-GLY20, respectively, are found for the sample centers. The relative evolution of the xwatervalues and the general shape of the cross sections can still be analyzed. As for XC, because the kinetics are not the same depending on the sample observed, the relevant immersion times displayed on thefigures can vary. Besides, a sample could evolve quickly in terms of XCand slowly in terms of xwater, so for the same sample the relevant immersion times can be different for XC and xwater. The presentation of the cross sections aims at giving a global view of the sample behavior upon immersion; for direct comparisons and numerical values, the next section (evolution at the center) is more relevant.
The shapes of xwater evolution, for both samples, are mirroring those observed for the conservation rate XC. The starch structure evolution is clearly closely related to the amount of water present in samples. For the plasticized sample
Figure 3.Evolution across two types of samples (cross section) of the absolute water content xwater. (A) Amorphous extruded starch (S). (B)
Extruded starch with 20% glycerol (S-GLY20). xwaterincreases with
time. The time of each scan (hh:mm) is indicated on the corresponding curve with matching color code.
S-GLY20, the amount of water is relatively constant through the section, regardless of the time. The water penetrates quickly and homogeneously in the sample. At 1:26 of immersion, the water amount barely increases anymore (or at least much, much slower). On the contrary, the water uptake of the amorphous starch sample S is rather gradual, starting from the interface and slowly reaching the center of the sample (after 1 h). As for the previously presented XC cross section, the immersion times presented here are chosen for their relevance. For the S-GLY20 sample, it is worth observing that the water content at t = 12 min appears to be already halfway through its evolution in the observed time range (from 0.4−0.5 at T0to 0.55−0.65 at t = 12 min and to 0.7−0.75 at Tf= 4:22), whereas, for the amorphous S sample, the first xwater cross section showing any meaningful difference with T0is at t = 1:10. From there, the increase of xwaterin the S sample and change of curve shape appear to be fairly regular until the last measure at Tf= 7:00. Unlike the S-GLY20 sample, the S sample shows no signs of stabilizing or even slowing down the rate of increase of water content through time, just an increasingly softer gradient.
3.1.2. Evolution at the Center.Figure 4presents the more quantitative data that is the evolution of XC(Figure 4A) and XW (Figure 4B) as a function of time throughout the immersion period. Data corresponds to the central spot (#11) of each sample, in addition to one spot at the periphery (#8) for the amorphous S sample, for which the cross section showed a gradient between center and periphery. This representation is helpful to visualize the different kinetics of both water uptake and conservation rate.
Conservation Rate. InFigure 4A, the conservation rate XCis displayed for all three sample types, including the recrystallized one, as a function of immersion time. XCis a measure of how much the sample has changed at a given point in time, involving both structural change (i.e., crystallization or amorphization) and mass transfer (i.e., water diffusion, starch swelling, material loss). Structural changes and mass transfers are also intertwined, with water diffusion in the sample enhancing crystallization, for example. As expected, the conservation rate for all samples decreases over time. However, kinetics differs among the three types of samples. The decrease in XCis fastest for the plasticized S-GLY20 sample, slowest for
the central spot of the amorphous S sample, and in between for the periphery spot of the amorphous S sample and the recrystallized S-REC material. The fast decrease of XCindicates a rapid change related either to a quicker crystallization or transfer of material, or both phenomena. XC for S-GLY20 reaches a phase with a much slower XC decrease (almost reaching a plateau) starting at around 3:20 (200 min) with numerical values stabilizing around 45%. The S-REC sample shows a similar, although slower, decrease of XC, without stabilization in the observation window.
The amorphous S sample,finally, shows a different evolution with two distinct trends. At the center, XC decreases sharply and then slows down, and after that, the decrease accelerates again at around 3:00 (180 min) of immersion up to the end of the measurement, at 7:00 (420 min) of immersion. Thefirst step (sharp start, then slowdown) corresponds to the time period where water has not yet reached the center of the sample coming from the sides, as shown inFigure 3. However, as mentioned earlier, through dead volumes, water is actually already present at the center from the beginning. The evolution of thisfirst part thus probably arises from structural changes and mass transfer near the interface with the cell. These phenomena are limited as the XCdecrease rate appears to slow down between 1:40 (100 min) and 3:00 (180 min), before increasing again starting at 3:00 of immersion time, which corresponds to the second step, i.e., when water reaches the sample center from the sides. In this last step, both material transfer and crystallization can explain the acceleration of the decrease in XC, as water is now present throughout the whole sample.
At the periphery, XCstarts by a fast decrease similar to what is observed at the center, and appears to slow down much later (around 4:30, 270 min), continuously decreasing until the end of the measure at 7:00 (420 min). The conservation rate XCis too complex a variable to extract anything meaningful via mathematical treatment (it encompasses more than one variable).
Water Uptake. XW, the relative water uptake, can only be valid in one spot of the total cell cross section. OnFigure 4B, evolution of XWshows that S-GLY20 absorbs high amounts of water during thefirst hour, then the absorption slows down,
Figure 4.Evolution of the conservation rate XCand of the amount of water uptake XWas a function of immersion time for the central spot. Left: XC
= f(t) for central spot (#11) in extruded potato starch with 20% glycerol S-GLY20 (blue triangles), recrystallized amorphous extruded potato starch S-REC (red squares), and central + periphery spot (#11 and #8) for the amorphous extruded sample (S) (green diamonds: dark green for center and light green for periphery). Right: XW= f(t) for central spot (#11) in extruded potato starch with 20% glycerol S-GLY20 (blue triangles) and central +
and around 3:00 (180 min) of immersion the water uptake appears to reach a plateau, with XWstabilizing around 0.23 v/v at the end of the measure (tf= 4:22, 262 min). The S sample remains at close-to-zero amounts of added water in the center for around 1:40. Thereafter, XW starts increasing regularly, almost linearly, as long as the experiment lasts (7:00). The periphery spot evolves similarly, minus the 100 min delay which was found for the central spot. XWincreases from the beginning (less sharply than S-GLY20) and shows no signs of stabilization by the end of the measure. It is worth noting that, adding a 98 min delay to the periphery XWdata, the two curves (XWcenter= f(t) and XWperiphery= f(t)) are almost perfectly superimposed.
3.1.3. Crystallinity. After removing from the synchrotron WAXS data the signal of water and that of the initial sample, a leftover intensity, called Irest(q), is left (Figure 5). It corresponds to qualitative information on the newly trans-formed starch and is plotted as a function of q (wave vector q = 4π/λ*sin(θ/2)) for the central spot. For the extruded starch sample (S), Irest(q) is atfirst a wide bump centered on 1.7 Å−1; then, around 3:00 (180 min) of immersion, it starts sharpening and Bragg peaks appear, getting increasingly defined over time. These 180 min of immersion correspond to the sudden decrease in the conservation rate XC (see Figure 4A). The crystalline form is B-type, as expected for a recrystallization by water uptake. For the other two samples, Irest(q) is mainly centered on this 1.7 Å−1 peak as well. S-GLY20 starts its evolution like S, with crystalline peaks appearing over time in a B-type form, but contrary to S samples, the S-GLY-20 Irest(q) stops evolving after 1:30 (90 min). For the recrystallized samples, the shape of Irest(q) is slightly different as it appears more ordered from the beginning, with several Bragg peaks being distinguishable already at 6 min. Like the others, it shows the characteristics of B-type crystallinity expected for a recrystallization by water addition. Crystallinity rates were calculated on the WAXS data at the beginning before immersion and at the end of the measure. S-GLY20 has 17% of crystallinity at the beginning and 26% at the end, S-REC starts at 18% andfinishes at 32%, and the amorphous S sample has a final crystallinity rate of 29%, both at center and periphery. In the middle of the experiment (t = 4:20), the rates were respectively 16 and 25% for center and periphery.
3.2. Magnetic Resonance Microimaging. The water ingress into the S-GLY20 sample was also investigated using the noninvasive and nondestructive MRμI technique over 22:00 (1320 min).Figure 6 shows the proton density profiles extracted from images acquired using the FLASH method for different immersion times from 20 min to 22:00. These profiles correspond to the proton signal intensity measured on images
over time. The image acquired directly after immersion (t = 20 min) is presented in gray level on the upper right side ofFigure 6. A gray crown 0.5 mm in width is visible at the edges of the sample, while the signal is zero within the dry sample (black cylinder). As shown on the profiles, at the center of the sample (distance = 0.00 mm), the signal intensity goes from 0 to 10 000 (in arbitrary units), demonstrating the sample hydration over time. Moreover, the sample swelling can be observed by the appearance of a signal at distances larger than the dimension of the dry sample (over−1.9 and +2.1 mm).
3.3. Water Diffusion and Swelling. 3.3.1. From MRμI Data, for S-GLY-20. Diffusion Characteristics from MRμI.
Figure 5.Irestfor amorphous extruded potato starch S, extruded potato starch with glycerol GLY-20, and recrystallized extruded potato starch
S-REC (from top to bottom).
Figure 6.(A) Starchy sample (green) immersed in doped water in the NMR tube and image of a virtual sample slice (dashed blue line) recorded at 20 min of immersion. (B) Proton density profiles by MRμI of a starch−glycerol blend immersed in water at 22 °C as a function of time from 20 min to 22 h (only 15 profiles are shown here). The arrows indicate water intensity increasing within the blend (blue) and the axial size increasing or swelling of the blend (orange). The dashed vertical green lines show the position (1.72 mm from the center) used to plot the intensity change with time inFigure 7.
Peppas and Sinclair26developed a semiempirical equation for analyzing the transport mechanism in glassy polymers based on the proton density evolution measured in MRμI
=
∞
I It/ ctn (6)
where Itand I∞are the intensity of the water proton penetrated in a sample after an immersion time t and the intensity of water in the starchy matrix at equilibrium, respectively. c is a constant incorporating characteristics of the macromolecule network system and penetrant, and n is a diffusional exponent, which is indicative of the transport diffusion mechanism. Fickian diffusion is characterized by a front that propagates linearly with the square root of time (n = 0.5). If Fickian behavior is observed in a cylindrical polymer sample, the parameter c ineq 6can be related to the mean diffusion coefficient D̅ of water according to the following equation27
π ̅ =⎜⎛ ⎟ ⎝ ⎞⎠ D cr 4 2 (7)
where r is the radius of the sample.
In the literature, the water propagation front in a solid matrix was measured using MRI when the intensity of the signal corresponded to1/6of the intensity of the free water signal.
28,29 Moreover,eq 6 is considered valid for up to thefirst 60% of normalized solvent uptake (It/I∞ ≤ 0.60).
30
In the current study, the changes in the amount of water during hydration were observed on S-GLY20 at a position 1.72 mm far from the center of the sample (Figure 6). For this position, the ratio It/ I∞ varied from 0.11 to 0.79 with time. Figure 7 (hollow triangles) shows the fitting of data acquired over 6 h 40 min (400 min) at a distance d of±1.72 mm from the center, which yielded a mean diffusion coefficient value D̅ of (1.42 ± 0.55) × 10−10 m2/s (eq 7). A single diffusion regime was clearly
observed during the first 400 min, and the n parameter was 0.494± 0.007, confirming the case I (Fickian) diffusion. c was 3.8× 10⁻³s−0.5. This result was represented for a single slice, while the mean and standard deviation correspond to calculations for two symmetrical distances from the center of the sample (1.72 and−1.72 mm). After 6:40, n decreased and was 0.217 ± 0.002, which agreed with the fact that the short time approximation (i.e., initial tl/2-time dependence of the water uptake) is not valid for the total water uptake but only for thefirst 60% of water uptake (It/I∞≤ 0.60).30
Swelling Characteristics from MRμI. The variations in diameter of the sample, which were directly extracted from the images, are shown inFigure 8(hollow triangles). The diameter
changes were measured from three virtual radial slices of sample using the FLASH sequence. The measured diameter at 20 min was 4.980 ± 0.035 mm. Figure 8 illustrates a rapid swelling of the potato starch−glycerol blends at short immersion times (up to 600 min). A plateau is reached at about 970 min. The variations of diameter extracted from FLASH images werefitted usingeq 8, with dmaxthe maximum diameter attained and ksthe rate of swelling:
= − · −
d dmax C es k ts (8) The values for dmax (mm), Cs, and ks (min−1) were 5.885 ± 0.009 mm, 0.907, and 5.209 × 10⁻³min−1, respectively. The diameter of the dry sample d0was 4.68± 0.21 mm; the swelling thus corresponded to an increase in diameter of 25.7%.
3.3.2. For Synchrotron WAXS Data. The same type of analyses can be performed using the water uptake XW = f(t) curves obtained from the synchrotron WAXS data analysis. This was performed for S-GLY20 but also for the amorphous potato starch sample S on the basis of the following variant of
eq 6,eq 6′:26 = ∞
XW/XW ctn (6′)
Figure 7.From MRμI, results of a least-squares fit of the function It/
I∞= ctncalculated for data at a distance of 1.72 mm from the center
from the proton density profiles acquired over time on a starch− glycerol blend immersed in doped water at 22 °C: hollow blue triangles, and from WAXS data, at the periphery for the (S) sample (amorphous extruded potato starch), green diamonds; and at the center for S-GLY20, blue triangles, results of a least-squaresfit of the function XW/XW∞= ctn.
Figure 8.Swelling of starchy samples as a function of immersion time. Data from MRμI: starting sample diameter 4.980 ± 0.035 mm, hollow blue triangles S-GLY20. Data from WAXS measurement: starting sample diameter 3−3.5 mm, blue triangles GLY20, red squares S-REC.
Diffusion Characteristics from Synchrotron WAXS. For the S-GLY20 sample, the one that was also analyzed by MRμI, instead of using a periphery spot (1.72 mm from center), the central spot was chosen. As mentioned before, there is an asymmetry in our measurements, so analyzing the central spot was a way to minimize the effect of this asymmetry. The experimental differences between the two setups only allow a qualitative comparison of the diffusion behaviors. For the S sample, the chosen spot is #8, at the sample periphery. It should be noted that for the sake of simplicity the diffusion model used is for a cylinder, as above for MRμI data, but this case is far from a perfect cylinder because of the dead volumes in the cellfilled with water.
Values of n were estimated at n = 0.835 and n = 0.462 for extruded amorphous potato starch samples S and the 20%-glycerol-plasticized S-GLY20, respectively. For this latter sample, this value is for thefirst hour of immersion only. For the entire experiment duration, i.e., 4 h and 22 min, n = 0.29. Thus, it appears that, for the glycerol-plasticized sample, the initial diffusion mechanism is Fickian (similar to what was found with MRμI) and, for the amorphous sample, closer to a case II (due to its linear progression with time). A superimposition of model and data is presented in Figure 7
(solid points), alongside the MRμI results. The mean diffusion coefficient D̅ can also be calculated for the S-GLY20 sample, using eq 7,30 and is estimated at 2.07 × 10⁻¹⁰ m2·s−1. Considering all of the differences in protocols and measures, D̅ is remarkably close to what was determined above using the MRμI data, i.e., 1.42 × 10⁻¹⁰m2·s−1. To compare these values to a similar material, cross-linked high amylose starch tablets were found to have mean diffusion coefficients about an order of magnitude lower, i.e., 2× 10⁻¹¹ m2·s−1.31
Swelling Characteristics from Synchrotron WAXS. Similarly to the swelling calculations from MRμI data, an attempt was made by using the cross-sectional values of XCas a function of time (from Figure 2). At least for S-GLY20 and S-REC, the interface stays sharp enough during the experiment, allowing the assumption that any point where XC> 0 corresponds to a point inside the sample. Knowing that each spot is separated by exactly 0.4 mm, the diameter is read at the half-height of the curves. Using the same equation as above (eq 8), the values for dmax(mm), Cs, and ks(min−1) were found to be, respectively, 4.29 mm (d0= 3.09 mm), 1.74, and 5.81× 10⁻²min−1for S-GLY20 and 4.35 mm (d0 = 3.0 mm), 1.64, and 4.78 × 10⁻² min−1for S-REC. This gives a diameter swelling of about 38% for S-GLY20 and 45% for S-REC. The diameter evolution with time and the modeling are presented inFigure 8(solid points), together with the MRμI data (hollow triangles).
3.3.3. Mechanisms of Water Uptake in Starch-Based Samples. Knowing the diffusion parameters and the precise structural evolution, a water uptake mechanism can be inferred for the S and S-GLY20 samples. This information is very important for potential applications, for example, in the biomedical and packaging fields. It has already been noted that the addition of glycerol in starch materials changes drastically their behavior in water,21 from very unstable and quickly disbanded to fairly stable over time. Now, with this new in-depth study, the goal is to get a better insight into the mechanisms and structures involved in starch degradation and ways to control this degradation. The degradation mechanism of amorphous potato starch material (S) is very different than what is observed for the other two samples. It has a different water diffusion behavior, close to a case II where diffusion is
controlled by relaxation of the polymer chains, as opposed to the Fickian behavior found for the starch sample plasticized with glycerol (S-GLY20), with this latter result being confirmed by both MRμI and WAXS synchrotron measurements.
Amorphous. For the amorphous sample, the changes come at the interface. The border quickly breaks and the sharp interface starts softening. Water slowly diffuses inside, while starch chains slowly diffuse outside. From the shape of the Irest curves, starch in water first forms loosely ordered structures before starting to crystallize, a behavior already observed in amylose and amylopectin solutions.32Once the water reaches the sample center, the crystallization and mass transfer accelerate. The following water uptake mechanism, summed up inFigure 9(upper part), can be inferred:
• At the interface material/water, mobile starch chains, probably mostly amylose, start to diffuse outside, forming a gel. Water slowly diffuses inside the sample.
• The expanding gel at the starch/water interface starts ordering into embryos of crystalline structures.
• Once the water arrives at the center, the material initial shape is not discernible anymore; there is just a gradient of starch concentration in water, high in the center, low at the borders.
• Crystals form in the gel from the previously loosely ordered structures. The concentration gradient becomes flatter.
Glycerol-Plasticized. The behavior of S-GLY20 following immersion in water is very different, mainly because the water diffuses almost instantly in this partially crystalline material (around 17% of crystallinity in the dry state). From the observation of the cross section evolution (Figures 2B and3B), there is no visible difference between periphery and center even
Figure 9. Schematic view of the proposed mechanisms for water uptake and structural changes from T0to Tfinalof an amorphous starch
sample (above) and a plasticized starch sample (below). Water is represented in blue, starch-based sample in green.
at the very beginning of immersion. The water uptake and structure evolution (mass transfer and crystallization) are all occurring homogeneously throughout the sample. The following mechanism, summed up inFigure 9(lower part), is proposed:
• Water diffuses quickly inside the material. The estimated diffusion coefficients from both WAXS and MRμI data are similar, and diffusion is close to an ideal Fickian case. • In turn, the increased mobility of the polysaccharide chains in the hydrated material promotes a slight increase in crystallinity.
• The water concentration, which is constant throughout the whole sample, increases very quickly at first but stabilizes afterward and reaches what appears to be a stable point after 3 h of immersion (for the synchrotron data) or 22 h of immersion (for MRμI data), depending on the size and width of the sample and the accessibility for water. The dead volume issues in the synchrotron samples explain this time difference.
• During this time, the starchy sample retains its shape, while swelling to accommodate the extra water: between 25 and 38% increase in diameter, depending on the data set. The exponential growth in diameter at the early stage of hydration is characteristic of radial swelling of many starch blend matrixes reported in the literature.31,33,34In addition to water intake, the size of the samples can change because of relaxation and reorganization of the starch chains during immersion in water. The value of ks, the swelling rate, is found to be 1 order of magnitude higher through WAXS for S-GLY20 than through MRμI experiment, and the swelling rate is also significantly higher (38% vs 25%). While the setup differences between synchrotron and MRμI did not appear to influence the diffusion characteristics, these differences become visible here. First of all, the presence of dead volumes in the synchrotron measuring cell is an obvious reason for the faster swelling rate, as water is in contact with a greater surface of the sample. Second, the cell setup itself, with the sample being confined between two mica disks, can explain the increased swelling through simple physical pressure from the cell walls. A third reason could be the water flux under which the synchrotron measure is carried out (very slow, at 12 mL·h−1), whereas the water in the MRμI setup is not renewed for the 22 h of experience.
• The slow crystallization of starch leads to the formation of a 3D polymer network32 which contributes to the limited total swelling of the sample.
One explanation for the high diffusion rate of water inside this plasticized sample could be the presence of glycerol molecules, very mobile and highly soluble in water. It has already been shown18,21that glycerol quickly leaves the material when immersed, and is in turn replaced by water. The water concentration gradient is thus weak and the perturbation of the initial structure is limited. Another explanation, not exclusive to the previous one, would be the rubbery state of this plasticized material (vs the glassy state of the amorphous unplasticized one). Indeed, the relaxation of polymer chains is one of the fundamental parameters controlling water transport in polymers.30 Fickian diffusion describes the ideal case where the segmental relaxation rate of the chains is much higher than water mobility (into the sample). Indeed, S-GLY20 was found
to exhibit, at least in the early stages of immersion, Fickian diffusion of water.
Recrystallized. Besides the presence of glycerol, the other difference between these two samples is the crystallinity rate. Extruded potato starch (S) is fully amorphous, but extruded potato starch with glycerol (S-GLY20) has an initial crystallinity rate around 17%. To discuss the influence of crystallinity uncorrelated to that of glycerol, the recrystallized starch sample S-REC, with about 18% of B-crystallinity, was added to the panel. Its evolution in water is somehow intermediary between S-GLY20 and the S sample from which it was made:
• Like S-GLY20, S-REC swells (∼45%) instead of crumbling, and the structure conservation rate is homogeneous through the sample. The water diffusion characteristics could not be estimated for this sample, but because of this homogeneity, it is suspected to be closer to the one of S-GLY20.
• Like the amorphous extruded S, S-REC does not seem to stabilize (within the observation window) but continues to evolve.
Therefore, it seems that the water diffusion rate is partially related to the crystallinity of the sample, and this crystallinity is also what prevents a starchy sample from breaking down. However, the differences between S-GLY20 and S are not wholly explained by this simple parameter, since S-GLY20 stabilizes quickly contrary to the recrystallized sample. Instead, the structure of S-REC keeps evolving like that of the S sample. The origin of the crystallinity may be an important factor. While the crystallinity of the S-REC sample comes from recrystallization of a totally amorphous sample (samples were originally extruded amorphous potato starch samples S), for S-GLY20, there are two options, namely, recrystallization after extrusion or remaining native granules. Indeed, because of the lubricating properties of glycerol, the extrusion of the S-GLY20 samples requires much less energy, i.e., SME = 122 J/g vs 341 J/g for the amorphous sample. The energy used for the extrusion of S-GLY20 may be too low to fully destroy all starch granules and therefore breaks only a part of them. This would therefore make the S-GLY20 samples more organized and more resistant because of the complexity of native granule organization, from the double helices (a few nm) to the multilamellar supramolecular granule structuration (μm scale).35
4. CONCLUSION
In this paper, the in-depth observations of the structural evolutions of starchy samples upon immersion in water were made possible by the use of synchrotron radiation (wide-angle scattering), which gives very high resolution measurements on small samples, and of magnetic resonance microimaging, which gives high-resolution images, two powerful nondestructive techniques. They are complementary and together allow a multiscale study of the phenomena, from crystal structure changes (a few Å) to water transfer (several millimeters). These methods enabled a better understanding of the water uptake mechanisms in these materials, which have a lot of potential as biosourced, biocompatible, and biodegradable polymers for use in the biomedical field, for example, or for food packaging. Using the method described in this Article, one would also be able to follow the enzymatic degradation of samples (simply by replacing water with an enzyme solution) which is of uttermost importance for the applications mentioned above. Another
perspective for the use of this unique setup is to follow changes at a different scale by changing the scattering angle (small-angle instead of wide-angle) and investigate the fate of starch granules or the creation of supramolecular structures upon immersion, or during biodegradation.
■
AUTHOR INFORMATIONCorresponding Authors
*E-mail:chloe.chevigny@inra.fr(C. C.). *E-mail:corinne.rondeau @irstea.fr(C. R.-M.).
ORCID
Chloé Chevigny:0000-0002-3112-8870
Present Address
∥P.R.: Laboratoire de Génie Chimique UMR 5503, Université
Paul Sabatier, 118 route de Narbonne, 31062 Toulouse, France.
Notes
The authors declare no competingfinancial interest.
■
ACKNOWLEDGMENTSSynchrotron Soleil is acknowledged for beam time on the SWING spectrometer, proposal number 20140359. The authors thank Marion de Carvalho for her contribution on setting up and performing the synchrotron experiments, Kamal Kansou for the Matlab data treatment algorithm, and Alain Buléon for scientific discussions.
■
REFERENCES(1) Khan, F.; Ahmad, S. R. Polysaccharides and Their Derivatives for Versatile Tissue Engineering Application. Macromol. Biosci. 2013, 13 (4), 395−421.
(2) Lourdin, D.; Coignard, L.; Bizot, H.; Colonna, P. Influence of equilibrium relative humidity and plasticizer concentration on the water content and glass transition of starch materials. Polymer 1997, 38 (21), 5401−5406.
(3) VanSoest, J. J. G.; Knooren, N. Influence of glycerol and water content on the structure and properties of extruded starch plastic sheets during aging. J. Appl. Polym. Sci. 1997, 64 (7), 1411−1422.
(4) Bjorses, K.; Faxalv, L.; Montan, C.; Wildt-Persson, K.; Fyhr, P.; Holst, J.; Lindahl, T. L. In vitro and in vivo evaluation of chemically modified degradable starch microspheres for topical haemostasis. Acta Biomater. 2011, 7 (6), 2558−2565.
(5) Dandekar, P.; Jain, R.; Stauner, T.; Loretz, B.; Koch, M.; Wenz, G.; Lehr, C.-M. A Hydrophobic Starch Polymer for Nanoparticle-Mediated Delivery of Docetaxel. Macromol. Biosci. 2012, 12 (2), 184− 194.
(6) Elvira, C.; Mano, J. F.; San Roman, J.; Reis, R. L. Starch-based biodegradable hydrogels with potential biomedical applications as drug delivery systems. Biomaterials 2002, 23 (9), 1955−1966.
(7) Echeverria, I.; Silva, I.; Goñi, I.; Gurruchaga, M. Ethyl methacrylate grafted on two starches as polymeric matrices for drug delivery. J. Appl. Polym. Sci. 2005, 96 (2), 523−536.
(8) Araujo, M. A.; Cunha, A. M.; Mota, M. Enzymatic degradation of starch-based thermoplastic compounds used in protheses: identifica-tion of the degradaidentifica-tion products in soluidentifica-tion. Biomaterials 2004, 25 (13), 2687−2693.
(9) Franco-Marques, E.; Mendez, J. A.; Girones, J.; Ginebra, M. P.; Pelach, M. A. Evaluation of the influence of the addition of biodegradable polymer matrices in the formulation of self-curing polymer systems for biomedical purposes. Acta Biomater. 2009, 5 (8), 2953−2962.
(10) Nabais, T.; Brouillet, F.; Kyriacos, S.; Mroueh, M.; Amores da Silva, P.; Bataille, B.; Chebli, C.; Cartilier, L. High-amylose carboxymethyl starch matrices for oral sustained drug-release: In vitro and in vivo evaluation. Eur. J. Pharm. Biopharm. 2007, 65 (3), 371−378.
(11) Rodrigues, A.; Emeje, M. Recent applications of starch derivatives in nanodrug delivery. Carbohydr. Polym. 2012, 87 (2), 987−994.
(12) Santos, M. I.; Tuzlakoglu, K.; Fuchs, S.; Gomes, M. E.; Peters, K.; Unger, R. E.; Piskin, E.; Reis, R. L.; Kirkpatrick, C. J. Endothelial cell colonization and angiogenic potential of combined nano- and micro-fibrous scaffolds for bone tissue engineering. Biomaterials 2008, 29 (32), 4306−4313.
(13) Santos, M. I.; Fuchs, S.; Gomes, M. E.; Unger, R. E.; Reis, R. L.; Kirkpatrick, C. J. Response of micro- and macrovascular endothelial cells to starch-based fiber meshes for bone tissue engineering. Biomaterials 2007, 28 (2), 240−248.
(14) Santos, M. I.; Unger, R. E.; Sousa, R. A.; Reis, R. L.; Kirkpatrick, C. J. Crosstalk between osteoblasts and endothelial cells co-cultured on a polycaprolactone-starch scaffold and the in vitro development of vascularization. Biomaterials 2009, 30 (26), 4407−4415.
(15) Rodrigues, A. I.; Gomes, M. E.; Leonor, I. B.; Reis, R. L. Bioactive starch-based scaffolds and human adipose stem cells are a good combination for bone tissue engineering. Acta Biomater. 2012, 8 (10), 3765−3776.
(16) Silva, N. A.; Sousa, R. A.; Pires, A. O.; Sousa, N.; Salgado, A. J.; Reis, R. L. Interactions between Schwann and olfactory ensheathing cells with a starch/polycaprolactone scaffold aimed at spinal cord injury repair. J. Biomed. Mater. Res., Part A 2012, 100A (2), 470−476. (17) Santos, T. C.; Marques, A. P.; Horing, B.; Martins, A. R.; Tuzlakoglu, K.; Castro, A. G.; van Griensven, M.; Reis, R. L. In vivo short-term and long-term host reaction to starch-based scaffolds. Acta Biomater. 2010, 6 (11), 4314−4326.
(18) Beilvert, A.; Chaubet, F.; Chaunier, L.; Guilois, S.; Pavon-Djavid, G.; Letourneur, D.; Meddahi-Pelle, A.; Lourdin, D. Shape-memory starch for resorbable biomedical devices. Carbohydr. Polym. 2014, 99, 242−248.
(19) Salgado, A. J.; Coutinho, O. P.; Reis, R. L.; Davies, J. E. In vivo response to starch-based scaffolds designed for bone tissue engineering applications. J. Biomed. Mater. Res., Part A 2007, 80A (4), 983−989.
(20) Beilvert, A.; Faure, F.; Meddahi-Pelle, A.; Chaunier, L.; Guilois, S.; Chaubet, F.; Lourdin, D.; Bizeau, A. A resorbable shape-memory starch-based stent for the treatment of salivary ducts under sialendoscopic surgery. Laryngoscope 2014, 124 (4), 875−881.
(21) Velasquez, D.; Pavon-Djavid, G.; Chaunier, L.; Meddahi-Pellé, A.; Lourdin, D. Effect of crystallinity and plasticizer on mechanical properties and tissue integration of starch-based materials from two botanical origins. Carbohydr. Polym. 2015, 124, 180−187.
(22) Perry, P. A.; Donald, A. M. The Role of Plasticization in Starch Granule Assembly. Biomacromolecules 2000, 1 (3), 424−432.
(23) Wakelin, J. H.; Virgin, H. S.; Crystal, E. Development and Comparison of Two X-Ray Methods for Determining the Crystallinity of Cotton Cellulose. J. Appl. Phys. 1959, 30 (11), 1654−1662.
(24) Le Ster, C.; Gambarota, G.; Lasbleiz, J.; Guillin, R.; Decaux, O.; Saint-Jalmes, H. Breath-hold MR measurements of fat fraction, T1, and T2* of water and fat in vertebral bone marrow. J. Magn. Reson. Imaging 2016, 44 (3), 549−555.
(25) Frisch, H. Sorption and transport in glassy polymers−a review. Polym. Eng. Sci. 1980, 20, 2−13.
(26) Peppas, N. A.; Sinclair, J. L. Anomalous transport of penetrants in glassy polymers. Colloid Polym. Sci. 1983, 261 (5), 404−408.
(27) Park, G.-S., Crank, J., Eds. Diffusion in polymers; Academic Press: London and New York, 1968.
(28) Baille, W. E.; Malveau, C.; Zhu, X. X.; Marchessault, R. H. NMR Imaging of High-Amylose Starch Tablets. 1. Swelling and Water Uptake. Biomacromolecules 2002, 3 (1), 214−218.
(29) Thérien-Aubin, H.; Baille, W. E.; Zhu, X. X.; Marchessault, R. H. Imaging of High-Amylose Starch Tablets. 3. Initial Diffusion and Temperature Effects. Biomacromolecules 2005, 6 (6), 3367−3372.
(30) Peppas, N. A.; Brannon-Peppas, L. Water diffusion and sorption in amorphous macromolecular systems and foods. J. Food Eng. 1994, 22 (1), 189−210.
(31) Thérien-Aubin, H.; Zhu, X.; Ravenelle, F. o.; Marchessault, R. H. Membrane formation and drug loading effects in high amylose
starch tablets studied by NMR imaging. Biomacromolecules 2008, 9 (4), 1248−1254.
(32) Putaux, J.-L.; Buléon, A.; Chanzy, H. Network Formation in Dilute Amylose and Amylopectin Studied by TEM. Macromolecules 2000, 33 (17), 6416−6422.
(33) Moussa, I. S.; Lenaerts, V.; Cartilier, L. H. Image analysis studies of water transport and dimensional changes occurring in the early stages of hydration in cross-linked amylose matrices. J. Controlled Release 1998, 52 (1−2), 63−70.
(34) Russo, M. A. L.; Strounina, E.; Waret, M.; Nicholson, T.; Truss, R.; Halley, P. J. A Study of Water Diffusion into a High-Amylose Starch Blend: The Effect of Moisture Content and Temperature. Biomacromolecules 2007, 8 (1), 296−301.
(35) Buleon, A.; Colonna, P.; Planchot, V.; Ball, S. Starch granules: structure and biosynthesis. Int. J. Biol. Macromol. 1998, 23 (2), 85− 112.