Publisher’s version / Version de l'éditeur:
Journal of Computing in Civil Engineering, 15, January 1, pp. 35-43, 2001-01-01
READ THESE TERMS AND CONDITIONS CAREFULLY BEFORE USING THIS WEBSITE. https://nrc-publications.canada.ca/eng/copyright
Vous avez des questions? Nous pouvons vous aider. Pour communiquer directement avec un auteur, consultez la
première page de la revue dans laquelle son article a été publié afin de trouver ses coordonnées. Si vous n’arrivez pas à les repérer, communiquez avec nous à PublicationsArchive-ArchivesPublications@nrc-cnrc.gc.ca.
Questions? Contact the NRC Publications Archive team at
PublicationsArchive-ArchivesPublications@nrc-cnrc.gc.ca. If you wish to email the authors directly, please see the first page of the publication for their contact information.
NRC Publications Archive
Archives des publications du CNRC
This publication could be one of several versions: author’s original, accepted manuscript or the publisher’s version. / La version de cette publication peut être l’une des suivantes : la version prépublication de l’auteur, la version acceptée du manuscrit ou la version de l’éditeur.
For the publisher’s version, please access the DOI link below./ Pour consulter la version de l’éditeur, utilisez le lien DOI ci-dessous.
https://doi.org/10.1061/(ASCE)0887-3801(2001)15:1(35)
Access and use of this website and the material on it are subject to the Terms and Conditions set forth at
Why industry needs asset management tools Vanier, D. J.
https://publications-cnrc.canada.ca/fra/droits
L’accès à ce site Web et l’utilisation de son contenu sont assujettis aux conditions présentées dans le site LISEZ CES CONDITIONS ATTENTIVEMENT AVANT D’UTILISER CE SITE WEB.
NRC Publications Record / Notice d'Archives des publications de CNRC: https://nrc-publications.canada.ca/eng/view/object/?id=42a6857e-f63a-470b-8c33-23097fb93fff https://publications-cnrc.canada.ca/fra/voir/objet/?id=42a6857e-f63a-470b-8c33-23097fb93fff
Why industry needs asset management tools
Vanier, D. J.
A version of this paper is published in / Une version de ce document se trouve dans : Journal of Computing in Civil Engineering, v. 15, no. 1, Jan. 2001, pp. 35-43
www.nrc.ca/irc/ircpubs NRCC-44702
WHY INDUSTRY NEEDS ASSET MANAGEMENT TOOLS
By D.J. Vanier1
Abstract: This paper provides a retrospective overview of asset management in the construction industry; emphasis is placed on assessing decision-support tools for municipal infrastructure planning. The study identifies the extent of the asset management market in North America, addresses the need for decision-support tools for municipal-type organizations, and identifies the challenges for maintenance, repair and renewal planning faced by asset owners and managers. Integration with existing systems such as computerized maintenance management systems, geographic information systems and corporate legacy systems is seen as the largest challenge for developing and using decision-support tools in the area of asset management. The present study classifies various stages of implementation for asset management using the six “Whats” --questions that asset managers should ask about the status of their portfolio. Finally, the activities of a consortium in the area of strategic asset management are introduced. The investigation leading to this paper located a limited number of decision-support applications, and none provides a comprehensive solution to address the current needs for planning the municipal infrastructure.
INTRODUCTION
This paper provides a retrospective overview of asset management in the construction industry, as it relates to information technologies and decision-support tools. The following sections provide background information of asset management tools and techniques and outlines the extent of the asset management market in North America.
Extent of Built Assets in North America
Owners of large municipal infrastructure portfolios such as federal departments, regional governments, municipalities, universities or the armed forces have responsibility over a diversified set of constructed facilities. These assets range from complex, inter-related underground networks to sophisticated buildings, as well as roadway systems, parks and any other equipment necessary to maintain this infrastructure (to be called municipal infrastructure in this paper). This municipal infrastructure, however, cannot be completely protected from deterioration due to usage, climatic effects or geological conditions. Furthermore, because of inadequate funding or inappropriate support technologies, certain components of this infrastructure have been neglected and have received only remedial treatments (CERF 1996; NRC 1996).
"The United States spends an enormous amount of money annually to replace or repair deteriorated equipment, machines and other components of the infrastructure. In the next several decades, a significant percentage of the country’s transportation, communications, environmental, and power system infrastructure, as well as public buildings and facilities, will have to be renewed or replaced.” (NRC 1999)
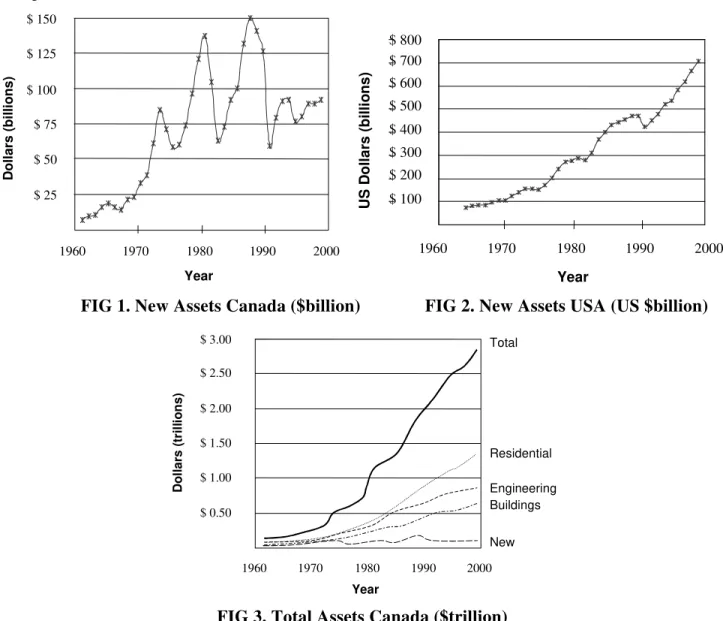
The amount of built assets in Canada is increasing at a rate of approximately $ 100 billion per year, as shown in Fig. 1 (Statistics Canada 1994, 1996, 1999; Vanier 2000). Similar United States of America figures are presented in Fig. 2 (US Census 1999). As a result of the growth in Canada, our country has an
1
Senior Research Officer, Institute for Research in Construction, National Research Council Canada, 1500 Montreal Road, Ottawa, Canada K1A 0R6, Phone: (613) 993-9699, Fax (613) 954-5984, dana.vanier@nrc.ca
Key words: investment planning, maintenance management, municipal infrastructure, decision-making, decision-support systems, condition assessment
established total stock of buildings and constructed infrastructure with an estimated value of more than $ 2.94 trillion, as shown in Fig. 3 (Statistics Canada 1994, 1996, 1999). This could have a value of approximately $ 5.5 trillion if calculated in constant dollars. A conservative ten-time multiplier for the USA (roughly based on the current population ratios and asset growth ratios from Figs. 1 and 2 between the two countries) provides an estimate for the potential value of US assets (all dollar figures in this paper are in current Canadian dollars with the exception of the US Census data in Fig. 2, $ 1.00 CDN equals $ 0.67 US). These values are significant and frightening; however, the magnitude of these numbers does establish the extent of the asset management challenge. The operation, maintenance, repair, and eventual renewal of this “built environment” therefore represent a major, and rapidly growing, cost to Canada and the USA. Similar challenges exist in Australia (Burns et al 1999) and other developed countries. $ 25 $ 50 $ 75 $ 100 $ 125 $ 150 1960 1970 1980 1990 2000 Year Do ll a rs (b illi o n s ) Year U S D o ll a rs ( b illi o n s ) 1960 1970 1980 1990 2000 $ 100 $ 200 $ 300 $ 400 $ 500 $ 600 $ 700 $ 800
FIG 1. New Assets Canada ($billion) FIG 2. New Assets USA (US $billion)
1960 1970 1980 1990 2000 $ 0.50 $ 1.00 $ 1.50 $ 2.00 $ 2.50 $ 3.00 New Buildings Engineering Residential Total Year D o ll a rs ( tri ll io ns )
FIG 3. Total Assets Canada ($trillion)
Organizations investigating asset management recommend the separation of maintenance and repair expenditures from those of capital renewal (NACUBO 1991; Melvin 1992; NRC 1994, 1996) in order to understand the extent of this challenge. Maintenance and repair are defined as interventions to ensure an asset reaches its optimal service life (CICA 1989), whereas capital renewal is defined as a comprehensive action to completely replace an existing asset, potentially with different functionality or location. These two components of asset management are discussed in the following subsections in an attempt to estimate the size of the maintenance, repair and renewal market in Canada and the USA.
Maintenance and Repair Expenditures
Maintenance and repair expenditures should not include “funds for any activities that are primarily operational or any construction work that expands or changes the function of a facility or lengthens its life beyond its original design life” (NRC 1996) but should include routine repairs which are defined as “actions taken to restore a system or piece of equipment to its original capacity, efficiency, or capability” (NRC 1996). The Federal Facilities Council recommends, “in the absence of other information”, that annual budgets for maintenance and repair should be set at approximately 2-4% of the current replacement value (CRV) of constructed facilities (NRC 1994, 1996). The CRV can be defined as the cost to replace an asset in present dollars; a full discussion on CRV is provided in the “What is it worth” section.
In 1995, CERF attempted to validate this 2-4% threshold to determine a suitable “level of investment” necessary to maintain constructed facilities (CERF 1996). CERF reported that the average “level of investment” for most facilities surveyed was less than 2% of the CRV and the results of the survey indicated that the recommended 2-4% “would probably not be adequate for facility upkeep if a substantial amount of deferred maintenance existed”.
Based on these recommendations from NRC and CERF, using a conservative 2% figure, and taking an established asset base in Canada to be $ 2.94 trillion, it can be roughly estimated that the potential cost of maintenance and repair expenditures per year in Canada alone is $ 58.8 billion.
Capital Renewal
In order to establish the costs of capital renewal it is first necessary to establish the service life of assets. Most building components or systems have service lives ranging only from 5 to 35 years(HAPM 1995), whereas engineering works, such as bridges, buried utilities and roadways, have values for services life ranging from 10 to 100 years. The average service lives for existing building and engineering works, as suggested by Statistic Canada (1994), are 37 and 30 years, respectively. If a conservative average service life of 35 years is assumed and if asset renewal follows a normal distribution curve, then the entire asset base should be replaced every 70 years, or twice the average age of the asset. That is, half the assets should be replaced before 35 years and the other half should be replaced in the next 35 years. This is a realistic assumption, as only a small percentage of municipal infrastructure has historical value, therefore the majority will not have to be maintained in perpetuity. Dividing the total asset base in Canada ($ 2.94 trillion) by 70 requires renewals of $ 42.0 billion each year. However, this method does not take into account a large portion of assets that were constructed before 1980 and are now 20 years old. A good percentage of these assets require significant maintenance and repair, while others already require renewal. An alternative method has been developed to take into account the rapid growth of assets in the past three decades. Equation (1) calculates the total renewal requirements using a normal distribution curve for probability of failure (pi), and the annual asset values from Fig. 1. The renewal requirements (rt) in any year (t) are calculated as the sums of the assets built in each previous year (year t0 through to year t) multiplied by that year's probability (based on a normal distribution and a 35 year service life).
r = ni✕ pi where n=value of assets and p= probability of failure in year i Equation (1) i=t0
t
t
The renewal requirements for 1999 (r1999) using this method for Canadian assets alone are $ 45.6 billion. This is close to the $ 42.0 billion calculated earlier using the cruder approximations. Maintenance, Repair along with Capital Renewal
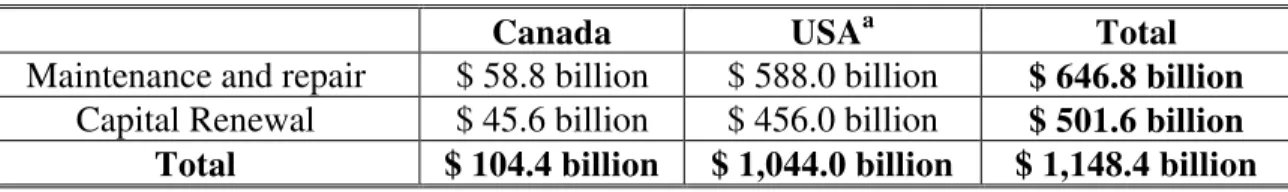
Assuming that the maintenance and repair figure of $ 58.8 billion and the capital renewal figure of $ 45.6 billion are mutually exclusive, then the sum of $ 104.4 billion per year represents the asset
management market in Canada. The conservative ten-time multiplier, mentioned earlier, can be used to estimate the value of the asset management market in the USA. These numbers are summarized in Table 1. In fact, in Canada the maintenance, repair and renewal market of $ 104.4 billion is almost identical to the value of current new construction of $ 100 billion, mentioned earlier. These numbers represent a significant base of work for the construction industry, as well as significant expenditures to owners and operators of facilities, and many feel that this repair and renewal work is not being implemented. Meanwhile, emphasis has been placed on new construction for the past three decades, to the detriment of maintaining the existing facilities (Johnson and Clayton 1998). “Local governments plan an increase of 13.1% [in 1999] to a total of $ 7.6 billion in capital spending” (Statistics Canada 1999). As a result, many organizations may have more facilities than they can afford to maintain; and in many instances, they may be unaware of this situation and their serious predicament.
Table 1: Maintenance, Repair and Capital Renewal in North America
Canada USAa Total
Maintenance and repair $ 58.8 billion $ 588.0 billion $ 646.8 billion Capital Renewal $ 45.6 billion $ 456.0 billion $ 501.6 billion
Total $ 104.4 billion $ 1,044.0 billion $ 1,148.4 billion
a
Based on a ten-time multiplier of the Canadian figures to represent ratios of national populations. All numbers are in current Canadian dollars.
Because not enough is spent on maintenance and repair, owners are accumulating an ever-increasing maintenance deficit, which leads to premature failures and premature renewals. Indeed, even though Canadian cities, for example, currently spend between $ 12 billion and $ 15 billion every year on maintaining and renewing their infrastructure, there is an accumulated shortfall estimated at $ 44 billion to return these assets to an acceptable condition (FCM 1996). Many directors of public works in Canada suspect that this number is low, indicating mounting technical challenges.
There have been numerous reports, both in the popular press and research literature, that many buildings are run inefficiently due to poor monitoring and control systems, water and road networks are deteriorating faster than anticipated and the overall condition of Canada’s bridges remains unknown, and potentially hazardous. A lack of knowledge of the condition of the built environment means that the scarce resources that are available for maintenance and repair are often used inefficiently or inappropriately (CERF 1996). These challenges affect everyone through increased health and safety risks, reduced economic competitiveness, inefficient maintenance strategies, a reduction in the value of a nation’s built assets and a need to increase funding to maintain the built environment. In some cases, this overall inefficiency will actually create the need for “new” buildings and engineering works; even when suitable facilities already exist or can be modified.
Asset managers are the ones who are responsible for managing the substantial maintenance, repair and renewal work. It is their responsibility to optimize expenditures and to maximize the value of assets over the asset's life cycles. In addition, asset managers are faced with many difficult decisions regarding how and when to repair their existing building stock cost-effectively and they have few tools, e.g. literature or intelligent computer software, to assist them in the decision-making process (GAO 1998).
The paper presents an argument defending the need for decision-support tools for strategic asset management by municipal-type organizations. The paper then details the challenges of strategic planning of maintenance, repair and capital renewal by asset owners and managers. The section following provides a definition for asset management using the author's six “Whats”. This section details the six-stage implementation strategy for asset management and in doing so also describes tools currently
available to manage physical assets. The last sections emphasize the need for decision-support tools in the domain of asset management and describe an initiative to address some of the identified requirements.
NEED FOR DECISION-SUPPORT TOOLS FOR MUNICIPAL INFRASTRUCTURE
Efficient information management is the key to better decision-making for municipal infrastructure (CERF 1996). For many organizations, major issues of service delivery are ‘repair and renew’ rather than ‘design and build’ (Johnson and Clayton 1998). Engineers, technical staff, administrators, and politicians all benefit if decisions about maintenance, repair and renewal are based on reliable data, solid engineering principles and accepted economic values. When reliable data and effective decision-support tools are in place, the costs for maintenance, repair and renewal will be reduced and the services will be timely, with less disruptions. These improvements will all reduce the costs of managing municipal infrastructure.
Many major asset owners in North America are beginning to recognize the importance of knowing the current and future states of their infrastructure. For example, the City of Edmonton (1998) recently completed a long-range financial plan for infrastructure assets, in which it recognized the need to establish priorities for renewal or new infrastructure facilities.
Meanwhile, Winnipeg (1998) has made recommendations to: (1) invest more in infrastructure, (2) make strategic investments with the dollars they have, and (3) find ways to reduce the magnitude of the infrastructure deficit problem. More specifically relating to decision-support tools, the City of Winnipeg recommends that:
• life cycle costing analysis be used for all decisions related to infrastructure alternatives;
• maintenance can be deferred only if the impact on life expectancy and life cycle costs is minimized, and if maintenance is factored into initial infrastructure costs;
• computerized maintenance management systems must be adopted. CONFLICTING INFRASTRUCTURE MANAGEMENT GOALS
Economic trends suggest that the next ten years will decrease revenues and reduce profit margins (NACUBO 1991; NRC 1990). Some major asset owners in North America are realizing there will be reductions in operating and maintenance budgets (NRC 1996) and/or “outsourcing” their maintenance and repair responsibilities. Further complicating the asset manager’s challenges are perennial construction problems such as the fragmented and conservative nature of the construction industry (Yu et al, 2000) and the limited financial resources for research and poor technology transfer to building practitioners (CERF 1996).
All of these conflicting factors can make attaining an organization’s management goals extremely difficult. An analysis of these factors is necessary to identify the technical challenges and opportunities for asset managers. These factors are broken into the following three categories: (1) the financial versus technical factors, (2) the conflicting planning horizons and (3) the network versus project factors.
Financial Versus Technical
Asset managers have a constant technical challenge to weigh the costs of maintenance, repair or renewal versus the technical and functional benefits of implementing a solution. This is exacerbated when there are more projects than funds, or when budgets are continuously shrinking (FCM 1996). In many cases, these managers must allocate funds among competing yet deserving needs; often having to make decisions based on incomplete data (CERF 1996). In addition, the asset managers’ resources are being challenged from all sides: managers are also being asked to privatize operations, outsource
responsibilities or reduce overhead. All of these factors make it extremely difficult for long-term decision-making in municipal infrastructure management.
Planning Horizons
Gordon and Shore (1998) have suggested three planning horizons to illustrate the conflicting nature of long-term decision-making for asset managers: operational, tactical, and strategic. The operational planning horizon is identified as that within the two-year time frame; the tactical planning is the two to five year time horizon, whereas the strategic planning is planning beyond the five-year term. Any proponent of life cycle analysis understands these deterrents to long-term planning; -- remedies in the short term may not be the most economical in the long term. Combined with conflicting political and administrative agendas, as well as rapidly changing targets and plans for each organization, the planning for the strategic horizon is a difficult task.
Network Versus Project
Typically, the asset management tools in current use today deal with individual projects or facilities (Vanier and Danylo 1998, 1998a); for example, an engineered management system (EMS) may deals only with paving condition assessment surveys (CAS) and computerized maintenance management systems (CMMS) may deal only with work orders and/or task scheduling. As any good asset manager realizes, municipal infrastructure is an integrated system and the individual components must function both independently as well as in unison with other systems. For example, many municipal infrastructure systems are networks that depend on the weakest link (e.g. bridge and road networks), or the systems are interdependent, where one network should be replaced at the same time as a neighbouring one (e.g. water distribution and sewer).
Another “network” factor is the level at which asset optimization should take place: domain, facility or organization. Should one specific domain (e.g. buildings or fleet) in a municipal portfolio receive a disproportionate amount of funding, should one region attract more funding attention than others, or should one department control the lion’s share of resources?
WHAT IS ASSET MANAGEMENT?
The asset managers' technical challenges, as identified in the first three sections, are indeed complex, but they are not intractable in the author's view. In an attempt to classify and to describe examples of existing decision-support tools for asset management as well as to juxtapose them opposite discrete stages for asset management implementation, the author presents his six “Whats” of asset management:
• What do you own?
• What is it worth?
• What is the deferred maintenance?
• What is its condition?
• What is the remaining service life?
• What do you fix first?
Anecdotal information from a number of typical organizations maintaining municipal infrastructure indicate that many of these organizations fare well with the first two questions, then may fail miserably on the remaining four. Discussions with asset management professionals also indicate that there is a scattering of responses depending on the discipline domain (i.e. roadways, bridges, parks, buried utilities, buildings).
In the following section, the author presents examples of tools currently available to address these six stages for asset management implementation (Vanier and Danylo 1998, 1998a). The author also suggests that practitioners can use this six-stage delineation as a roadmap for an asset management plan.
What do you own?
Geographical information systems (GIS), computer aided design (CAD) systems and relational database management systems provide accurate pictures of the extent of an asset management portfolio.
In GIS, the data about a particular asset are directly related to their physical location on a map of the city or region (GIAC 2000). For example, the location of a specific lot can be viewed in the context of other lots in a neighbourhood; lot surface areas can be calculated, and distances to specific services can be accurately calculated. Satellite imagery data can also be included in GIS systems. System implementation costs for a comprehensive GIS can be expensive for municipal or regional governments (Oppman 1998).
CAD systems can also provide sources of asset management information for the engineering, technical and management staff (Sommerhoff 1999). Dimensional information, such as areas and lengths can be extracted from CAD drawings, and the drawings provide up-to-date information about the extent of the portfolio. However, there are considerable incompatible issues with data formats (Vanier 1998) from CAD and CADFM (facilities management) systems if they are also to be used for asset management.
Another tool that can be used to record what assets are owned is a CMMS. There is a large selection of “fully commercialized” CMMSs available; many of these are relational database applications that can be adapted to meet the data handling needs of asset managers. A quick search on the Internet (AltaVista 2000; Excite 2000) using “computerized maintenance management system” or “cmms” produces thousands of sites dedicated to this topic. Detailed information on over 300 CMMS packages can be obtained from the Plant Maintenance Resource Center (PM 2000). It is obvious from this information that the CMMS domain, at this time, is mature, and that many stable, comprehensive, useful tools exist. For example, any number of CMMS applications can manage work orders, trouble calls, equipment cribs, stores inventories and preventive maintenance schedules, and many programs include features such as time recording, inventory control and invoicing. The CMMS’s capability to store inventory data is formidable; however, their capacity with respect to life cycle costs (LCC), service life prediction and risk analysis is considerably less sophisticated. These systems are currently not able to assist the manager in analysing data or offering scenarios for long-term system readiness, capability, or performance; but the CMMS has become an essential tool for the asset manager in the new millenium. What is it worth?
Once an organization identifies the extent of its assets, it is necessary to establish the assets’ “worth”. Six terms are used to describe the “worth” of an asset. (1) The historical cost is the original “book value” of the asset. (2) The appreciated historical cost of an asset is the historical cost calculated in present day dollars, taking into account annual inflation or deflation. (3) The current replacement value is the cost of replacing an asset today. (4) The “performance in use” value is the prescribed value of the actual asset for the user (Lemer 1998). (5) The deprival cost is the “the cost avoided as a result of having control of an asset” (ANAO 1996). (6) The market value is the value of the asset if it were sold on the open market today.
So, one can take the simple view of the cost of an asset as one data field on the asset record; however, the calculation and the recording of the cost data are neither simple nor straightforward. Typically, large organizations store the historical cost of assets, and bring this cost forward to present day dollars using well-known building economic principles (ASTM E917 1994), or calculate the replacement cost based on the area, volume or length of a system or component. However, they do not have the “worth” of that asset, but only the cost. A number of “off-the-shelf” commercial tools such as Building Life-Cycle Cost program (BLCC 1995) have been developed to implement these ASTM standards. However, there are reports indicating that practitioners do not make use of these well-established LCC tools (McElroy 1999).
Except for these types of LCC tools, there is little to help the asset manager to establish the actual value of an asset and none are comprehensive enough to save all six types of asset values, described earlier.
What is the deferred maintenance?
A portion of the problems associated with the financial and technical issues discussed earlier can be directly attributed to recent history and the recession: notably an escalating maintenance deficit. The deferred maintenance is not simply the sum of the annual maintenance deficits; it also should include the compounding effect of deferring maintenance from one year to the next. This compounding effect is similar to the interest on a debt: if the maintenance is not completed in year one, then the costs of maintenance, repair or replacement are higher in subsequent years, as shown in Fig. 4. De Sitter’s “Law of Fives” (De Sitter 1984) approximates this effect: if maintenance is not performed, then repairs equaling five times the maintenance costs are required. In turn, if the repairs are not effected, then renewal expenses can reach five times the repair costs. Therefore, postponing the maintenance compounds the amount of deferred maintenance.
(a) Total for all assets types (b) Asset type i
(c) Asset type ii (d) Asset type iii
(a) (b) (c) (d) Year D e fe rr e d M a in te n a n c e ( $
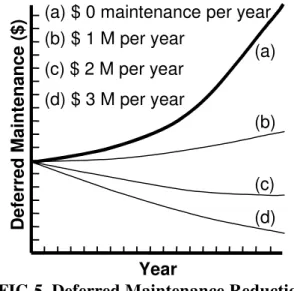
) (a) $ 0 maintenance per year
(b) $ 1 M per year (c) $ 2 M per year (d) $ 3 M per year (a) (b) (c) (d) Year D e fer re d Mai n tena n ce ($ )
FIG 4. Deferred Maintenance FIG 5. Deferred Maintenance Reduction
Spending on maintenance and repair as shown in Fig. 5 can reduce this deferred maintenance. Fig. 5 schematically illustrates the reduction of the deferred maintenance with various levels of maintenance funding. The asset manager should keep in mind that the maintenance and repair funding should be applied first to those assets of the type in curve (b) of Fig. 4, i.e. those with the highest degradation curves.
Traditionally, a relational database only maintains the most current information in its records; however, very often in asset management there is a need to save intermittent snapshots of the state of the assets. These snapshots could be in the form of data dumps from the CMMS database; for example, saving data about the repair dates, repair scope, labour costs, contract specifications and even drawings. These data could be warehoused and mined in future years to extract the trends in the past years on issues such as maintenance backlogs and recurring maintenance scenarios. These data could also be used to establish trends for strategic planning. Data warehousing and trend analysis would allow the asset managers to calculate both the current backlog of deferred maintenance; in addition, these techniques can be used to project future levels of maintenance.
What is its condition?
The National Association of College and University Business Officers (NACUBO 1991; Kaiser 1996) describes a detailed process in which a facility's condition can be assessed using the amount of deferred maintenance and comparing that to its CRV. In this process, the asset manager first identifies
maintenance that has been postponed, phased or deferred, and then attempts to provide an estimate of the current cost of that deferred maintenance (similar to the author's third “What"). NACUBO's “facility condition index” or FCI is the comparison metric that equals the cost of deferred maintenance divided by the CRV. NACUBO studies (1991) indicate those facilities with FCI’s higher than 0.15 are problematic; however, an FCI equaling zero is also not desirable as economies of scale for maintenance contracts come into play (NACUBO 1991). The FCI is an effective metric for ranking the condition of assets and using it for comparative analysis in a portfolio. The NACUBO model can be easily implemented on a spreadsheet.
Another metric to evaluate the condition of an asset is to use technical condition indexes such as those proposed by an EMS and as implemented by the US Army Corps of Engineers (Bailey et al 1989; Shahin 1992).
The US Army Construction Engineering Research Laboratory (CERL) has pioneered the use of EMSs in many construction sectors, such as paving, roofing and rail maintenance (EMS 1998). An EMS assigns a condition index (CI) to an asset based on a number of factors including the number of defects, physical condition and quality of materials or workmanship. The EMS software embodies the results of research studies that estimate the potential degradation of the CI with respect to the loads on the system or external agents acting on materials. With all of these data at hand, it is possible to estimate the future CI, given the current state and a likely degradation curve. A number of systems exist for municipal infrastructure including PAVER (Shahin 1992), ROOFER (Bailey et al 1989), BUILDER (1998), and RAILER (1998).
A CAS is another decision-support tool to establish the existing condition of an asset. A CAS produces a benchmark for comparison; not only between different assets, but also for the same asset at different times (IRC 1994; NRC 1994). “Using CAS, a maintenance manager can formalize the assembly of basic planning elements such as deficiency-based repair, replacement costs, projected remaining life and planned future use” (Coullahan and Siegfried 1996). CAS saves the deficiencies of a system or component, the extent of the defect, as well as the urgency of the repair work. In some cases, the estimated cost of repair is provided at the time of inspection. Management, as a result of the data generated by CAS, is better able to develop optimal plans for maintenance and repair of their buildings (Coullahan and Siegfried 1996). The US Department of Energy had a significant program (Earl 1997; CAS 1993) dealing with life cycle asset management and condition assessment surveys (LCAM/CAS). What is the remaining service life?
After the extent of an infrastructure portfolio is known, with its value and condition determined, the asset manager must establish the remaining service life in order to calculate the life cycle costs for alternative maintenance, repair and renewal strategies.
Techniques employing databases such as EMS and sophisticated mathematical modelling using Markov Chain(Lounis et al 1998) provide estimates for the remaining service life of components and systems. These techniques predict remaining service life based on studies of similar construction forms under test conditions. Unfortunately these techniques require the collection of considerable amounts of data; only a few domains such as bridge (Frangopol et al, 1997), pavement (Shahin 1992) and roofing (Bailey et al 1989; Lounis et al 1998) management have reliable service life prediction techniques. What do you fix first?
Deferred maintenance is not the only challenge for asset managers; in addition, there are continually new maintenance and repair requirements. Fig. 6 illustrates the accumulated maintenance assuming hypothetical zero maintenance expenditures. The on-going maintenance curve (c) in Fig. 6 can fluctuate based on the corporate asset growth or reduction and the age of facilities. Curve (a) is the sum
of the deferred maintenance (curve b) and the on-going maintenance (curve c). Fig. 7 provides the accumulated maintenance given a hypothetical budget of $ 3M/yr to eliminate the backlog.
(a) Accumulated Maintenance (b) Deferred Maintenance (c) Maintenance (2 % of CRV) (a) (b) (c) Acc u mula te d Mainte na nce ($ ) Year
(a) Accumulated Maintenance (b) Deferred Maintenance (c) Maintenance Requirements (2% of CRV)
(assuming $ 3M maintenance per year)
(a) (b) (c) Ac cumu lated Ma in tena nce ( $ ) Year
FIG 6. Accumulated Maintenance FIG 7. Maintenance Projections
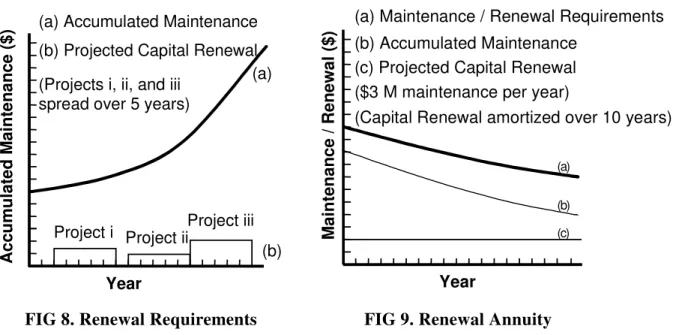
In addition to maintenance and repair, there are also the related problems of cyclical capital renewal: -- nothing lasts forever and sooner or later it has to be renewed, either as a complete system or as a part-by-part renewal. For example, if asset managers know that roofs should be replaced every 20 years, windows every 10 years and seals every five years (HAPM 1995), they should budget for these forecasts accordingly. NACUBO (1991) also provides a practical method to plan this rehabilitation, replacement or renewal. The methodology is related to the Facility Condition Index (FCI) discussed earlier and is called capital renewal (CR) analysis. The CR analysis calculates the renewal costs and spreads these future expenditures equally around the planned renewal date in a five-year time span, as shown in Fig. 8 (b). In this example, three renewal projects are planned; the costs for implementing Project (i) are amortized from year two through year seven. Using CR analysis, costs for the CR for each and every system or facility can be calculated well into the future (knowing the service life), and can be discounted as a present value or calculated as an annuity expense, as shown in curve (c) in Fig. 9. These calculations can also be used to establish “sinking funds” or “reserve funds” for the facility. Spreadsheets can be used to implement this NACUBO Model. Not to be forgotten in any of these calculations are the tax implications of commercial maintenance.
Project ii
(a) Accumulated Maintenance (b) Projected Capital Renewal (Projects i, ii, and iii
spread over 5 years)
(a)
(b) Project i Project iii
Year Ac cu m u la te d Mai n te na nce ($ ) (a) (b) (c)
(a) Maintenance / Renewal Requirements (b) Accumulated Maintenance
(c) Projected Capital Renewal ($3 M maintenance per year)
(Capital Renewal amortized over 10 years)
Year M a intenan c e / Ren e w a l ($)
FIG 8. Renewal Requirements FIG 9. Renewal Annuity
The Real Estate Capital Asset Priority Planning System or RECAPP™ (2000) is a strategic database management system that can calculate the funding requirements for capital repair/renovations over a 25-year time horizon (Gordon and Shore 1998). It is a relational database that develops prioritized capital funding and renewal projections using life cycle costing strategies. It is also a tactical planning tool that allows tracking of capital budgets, project status, and the risks associated with deferring maintenance. RECAPP allows the user to input data at an organizational, regional, district, building or departmental level and permits the user to enter information about assets such as building location, gross area, tenancy, and asset type. It also stores additional data such as digital images of the facility, system and components or CAD drawings of the floor plan. It can save archival information such as construction cost, age of facility, and maintenance expenditures. The output of RECAPP includes sophisticated plotting routines with histograms, pie charts or line plots depicting portfolio age profiles or 25 year expenditure projections.
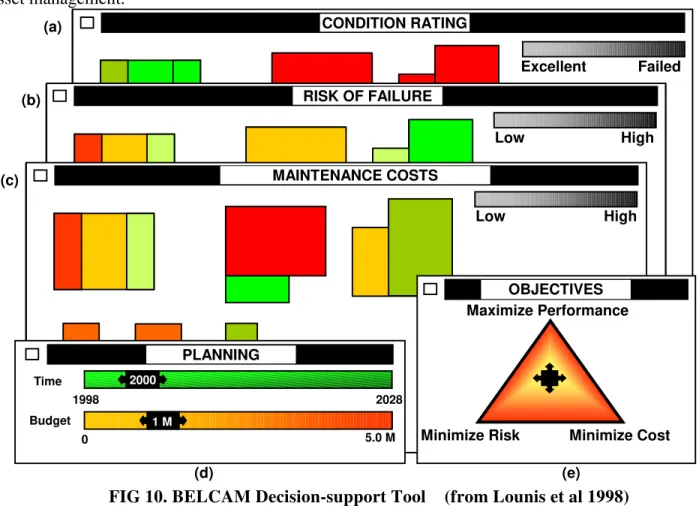
Decision-support tools such as those suggested in the Building Envelope Life Cycle Asset Management Project (BELCAM) can provide standardized interfaces for asset managers (Louniset al 1998). The sophisticated and complex calculations, integrated with numerous computer applications could provide answers to many maintenance, repair and renewal questions. The interface shown in Fig. 10 provides the decision-maker with the relevant data required to prioritize projects using multi-objective optimization.
Starting at the top of Fig. 10, the Windows (a), (b), and (c) provide a graphical aerial view of the existing “Condition Rating”, “Risk of Failure” and “Maintenance Cost” for a number of assets, respectively (roofs in this case). Depending on the optimization “Objective” selected by the user in Window (e), and a budget selected in Window (d), the user can view the projected condition of the assets after the selected priority projects have been implemented. Alternatively, the user can view the projected condition ratings, risk of failure and maintenance costs in future years by manipulating the “Time” slider in Window (d).
DISCUSSION
Computer applications are obviously becoming commonplace throughout the developed world. Johnson and Clayton (1998) found that facility managers from Fortune 500 companies identified the following 'very useful' information technology solutions: email (83%), computer aided design (68%), computer aided facilities management (49%), CAD standards (46%), shared databases (46%). These
were the same IT solutions that will become 'more useful' in the upcoming five years. It is generally understood that information technologies will form a critical part of any decision-support tool in the field of asset management.
FIG 10. BELCAM Decision-support Tool (from Lounis et al 1998)
An application such as the computer game SimCity (2000) may be visualized as a decision-support tool for municipal infrastructure planning. This popular computer game allows the user to create and manage a full city including infrastructure, taxation, and emergencies such as fires, hurricanes and explosions. Of course, SimCity is designed for a single user, while the type of application that is required for municipal infrastructure planning must receive input from a diversity of users. For example, the tool must be accessible to technical, administrative and financial staff; must communicate intelligently with a wide variety of other applications, and must supply data to everyone in the organization from the work scheduler right up to the mayor or base commander, as well as to other computer applications or databases. Unfortunately, such a tool would be complex simulation application that is expensive to develop and would apply to the specific operations of one organization.
General applications such as spreadsheets can calculate long-term costs of a component-based infrastructure, as with the NACUBO Model, but are limited in usage when numbers of regions, districts and organizations need to be analysed. This is true of most spreadsheet applications, as they are normally maintained by one individual.
The asset managers' decision-support tools will therefore fall somewhere between a spreadsheet and a robust, multi-user computer game.
The investigation to date has identified a limited number of applications available for strategic decision-support in the domain of municipal infrastructure, and there exists no comprehensive solution that addresses the current and future needs for investment planning for municipal engineers and managers (Vanier and Danylo 1998a). Partial solutions such as condition assessment surveys, CAD or
Fai
Expe
Minimize Risk MaximizePerformance Minimize Cost Time Budget 0 M0 5.0 M 1998 2028 1 M 2000 CONDITION RATING RISK OF FAILURE MAINTENANCE COSTS PLANNING OBJECTIVES Low High Low High Excellent Failed (a) (b) (c) (d) (e)CADFM systems, or geographic information systems address specific niche markets adequately; however, the author believes there will be considerable integration difficulties with other applications such as computerized maintenance management systems, personal administration databases, or financial information management systems. Integration with existing corporate systems is seen as another big challenge for implementing decision-support tools in the area of municipal infrastructure planning. Because this type of decision-support tool must inter-communicate with a plethora of existing and potential software applications, it is paramount that the development of any tool in this area be founded on the premise that integration is the primary concern.
SUMMARY AND CONCLUSIONS
This paper presents a retrospective overview of asset management. The extent of the asset management market in Canada is large, upwards of $ 2.94 trillion; while in the USA it could be ten-times larger. Maintenance and repair expenditures in Canada are to order of $ 58.8 billion per year, whereas capital renewal expenses are close to $ 45.6 billion per year. The sum of these two figures is close to the value of new construction in Canada each year. Managers of municipal infrastructure are realizing the need for effective tools to manage this vast asset base, and are now demanding the implementation of decision-support tools. This paper discussed the challenges faced by the construction industry when it comes to maintaining, repairing and renewing its existing and its future assets, but cautions that the challenges are not intractable. A multi-stage plan for the implementation of asset management is presented in the form of six questions: What do you own? What is it worth? What is its condition? What is the remaining service life? What is the deferred maintenance? Each successive stage describes currently available tools and techniques for asset management and each “What” establishes a growing framework for the implementation of an asset management plan. Unfortunately, few tools exist in the area of strategic asset management and managers of municipal infrastructure have considerable work ahead in order to implement the full six stages described. The investigation leading to this paper located a limited number of decision-support applications in the domain of municipal infrastructure but did not find any comprehensive solution that addresses the current and future needs for investment planning for municipal engineers and managers. The paper identifies the many challenges faced by these asset managers: the need for seamless data integration, the requirement for enhancement and standardization of currently available tools, the need for information exchange and technology transfer, and requirement for addition research in areas such as life cycle analysis and service life prediction. The paper concludes by outlining the activities of consortium to address these upcoming challenges.
Based on the investigation completed to date and the experience learned from various related projects (Vanier and Lacasse 1996; Lounis et al 1998), the author identifies several administrative, financial and technical challenges to fully address the need of municipal infrastructure planning:
• seamless data integration of the software environment;
• enhancement and standardization of the currently available tools;
• central repository for the information;
• shared experiences and “best practices” such as proposed in the National Technical for Municipal Infrastructure (Felio 1998);
• life cycle analysis and long-term service life prediction; and
• intercommunication between municipal infrastructure research and the field of service life research.
The National Research Council Canada and the City of Montreal, in conjunction with the Regional Municipality of Hamilton-Wentworth, Greater Toronto Authority and the Regional Municipality of Ottawa-Carleton are cooperating on a “Municipal Infrastructure Investment Planning” (MIIP) Project. This project addresses the need for decision-support tools and addresses some of the challenges
identified earlier. The MIIP project builds on the existing service life and asset management information developed in the Building Envelope Life Cycle Asset Management Project (Lacasse and Vanier 1996; Vanier and Lacasse 1996).
The objectives of the MIIP Project are as follows:
• Serve as a clearinghouse for asset management for municipal infrastructure.
• Locate tools and techniques to assist municipal infrastructure investment planning.
• Develop prototype tools and techniques for asset managers to better manage their municipal infrastructure.
• Cooperate with software vendors to develop useful, usable and reliable software. REFERENCES
AltaVista. (2000). “AltaVista Home Page.” <http://www.altavista.com> (Sep. 26, 2000).
ANAO. (1996). Asset Management Handbook, Australian National Audit Office, Jun., Canberra, Australia, <http://www.anao.gov.au> (Sep. 26, 2000)).
ASTM E917. (1994). Standard Practice for Measuring Life-Cycle Costs of Buildings and Building
Systems, American Society for Testing and Materials, West Conshohocken, Pa.
Bailey, D.M., Brotherson, D.E., Tobiasson, W. and Knehans, A. (1989). ROOFER: An Engineered
Management System for Bituminous Built-Up Roofs, Technical Report M-90/04/ ADA218529, US Army Construction Engineering Research Laboratory, Champaign, Ill.
BLCC. (1995). The NIST "Building Life-Cycle Cost" Program, Version 4.3, User's Guide and Reference
Manual, NISTIR 5185-3, National Institute of Standards and Technology, Gaithersburg, Md. BUILDER. (1998). “BUILDER Fact Sheet.” <http://www.cecer.army.mil/facts/sheets/
FL25.html> (Sep. 26, 2000).
Burns, P., Hope, D., and Roorda, J. (1999). “Managing Infrastructure for the Next Generation”,
Automation in Construction, Vol. 8, 689-703.
CAS. (1993). Condition Assessment Survey (CAS) Program: Deficiency Standards & Inspections
Methods Manual, The United States Department of Energy, Washington, D.C.
CERF. (1996). Level of Investment Study: Facility and Infrastructure Maintenance and Repair, Civil Engineering Research Foundation, Washington, D.C.
CICA. (1989). Accounting and Reporting for Physical Assets by Governments, Canadian Institute of Chartered Accountants, Toronto, Ontario, Canada.
Coullahan, R. and Siegfried, C. (1996). “Facilities Maintenance Using Life Cycle Asset Management”,
Facilities Engineering Journal, Mar/Apr, Association for Facilities Engineering, Cincinnati, Oh <http://www.afe.org> (Sep. 26, 2000).
De Sitter, W.R. (1984). “Costs for Service Life Optimization: The 'Law of Fives'”, Durability of
Concrete Structures, Workshop Report, Ed. Steen Rostam, 18-20 May, Copenhagen, Denmark, 131-134.
Earl, R. (1997). “The Condition Assessment Survey: A Case Study for Application to Public Sector Organizations”, Proc. Infrastructure Condition Assessment: Art, Science and Practice, American Society of Civil Engineers, Boston, Aug., 277-286.
Edmonton. (1998). Securing our Future: Edmonton’s Long Range Financial Plan, KPMG presentation to Council, Available from: The City of Edmonton, Alberta, Canada.
EMS. (1998). “EMS Fact Sheet.” <http://www.cecer.army.mil/facts/sheets/fl08.html> (Sep. 26, 2000). Excite. (2000). “Excite Home Page.” <http://www.excite.com> (Sep. 26, 2000).
FCM. (1995). Report on the State of Municipal Infrastructure, Federation of Canadian Municipalities. Available from: Federation of Canadian Municipalities, Ottawa Canada and McGill University, Montreal Canada.
Felio, G.Y. (1998). “A Framework for Innovation in Urban Infrastructure”, Canadian Consulting
Engineer Vol. 39(2) March/April, 31, 32, 41.
Frangopol, D.M., Lin, K.Y., and Estes, A.C. (1997). “Life-cycle cost design of deteriorating structures”,
ASCE J. of Struct. Engrg., Vol. 123, No. 10, 1390-1401.
GAO. (1998). Leading Practices in Capital Decision-Making, United States General Accounting Board, Washington, D.C.
GIAC. (2000). 2000 Canadian Geomatics Source Book, Third Edition, Geomatics Industry Association of Canada, Ottawa, Canada <http://www.giac.ca/site/info/source.cfm> (Sep. 26, 2000).
Gordon, A.R. and Shore, K.R. (1998). “Life Cycle Renewal as a Business Process”, APWA International
Public Works Congress: NRCC/CPWA Seminar Series Innovations in Urban Infrastructure, Las Vegas, Nv, pp. 41-53 <http://www.nrc.ca/irc/uir/apwa/apwa98> (Sep. 26, 2000).
HAPM. (1995). LifeSpans of Building Components, Technical Note 6, Housing Association Property Mutual, June, 1995, London <http://www.hapm.co.uk/technotes/technote6.htm> (Sep. 26, 2000). IRC. (1994). Protocols for Building Condition Assessment, Institute for Research in Construction,
National Research Council Canada, Ottawa, Canada.
Johnson, R. E., and Clayton, M.J. (1998). “The Impact of Information Technology in Design and Construction: The Owner’s Perspective”, Automation in Construction, (8) 3-14.
Kaiser, H.H. (1996). A Foundation to Uphold: A Study of Facilities Conditions at U.S. Colleges and
Universities, Association of Physical Plant Administrators, Alexandria, Virginia.
Lacasse, M.A. and Vanier, D.J. (1996). “A Review of Service Life and Durability Issues”, Proc. 7th
International Conference of the Durability of Building Materials and Components, Stockholm, Sweden, Vol. 2, 857-866.
Lemer, A.C. (1998). “Progress Toward Integrated Infrastructure-Assets-Management Systems: GIS and Beyond”, APWA International Public Works Congress: NRCC/CPWA Seminar Series Innovations in
Urban Infrastructure, Las Vegas, Nv, 7-24 <http://www.nrc.ca/irc/uir/ apwa/apwa98> (Sep. 26, 2000).
Lounis Z., D.J. Vanier, M.A Lacasse, and B.R. Kyle. (1998). “Effective Decision-Making Tools for Roofing Maintenance Management”, First International Conference on New Information
Technologies in Civil Engineering, Montreal, Oct., 425-436.
McElroy R.S. (1999). “Update on National Asset Management Initiatives: Facilitating Investment Decision-Making”, Innovations in Urban Infrastructure Seminar of the APWA International Public
Works Congress, Denver, CU.S.Ao, 1-10., <http://www.nrc.ca/irc/uir/ apwa/apwa99> (Sep. 26, 2000).
Melvin, E. (1992). Plan, Predict, Prevent: How to Reinvest in Public Buildings, Special Report #62, American Public Works Association Research Foundation, Chicago, IL.
NACUBO. (1991). Managing the Facilities Portfolio, National Association of College and University Business Officers, Washington, D.C.
NRC. (1990). Committing to the Cost of Ownership, Building Research Board, National Research Council, Special Report # 60, Washington, D.C.
NRC. (1994). Toward Infrastructure Improvement: An Agenda for Research, Building Research Board, National Research Council, National Academy Press, Washington, D.C.
NRC. (1996). Budgeting for Facilities Maintenance and Repair Activities, Standing Committee on
Operations and Maintenance, Report 131, National Research Council, National Academy Press, Washington, D.C.
NRC. (1999). Research Agenda for Test Methods and Models to Simulate the Accelerated Aging of
Infrastructure Materials, Board on Infrastructure and the Constructed Environment, National Research Council, National Academy Press, Washington, D.C.
Oppman, R.S. (1998). “A True Enterprise GIS: Oakland County, Michigan", Municipal GIS, Sep-Oct, The Sanborn Map Company, Inc., 629 Fifth Avenue, Pelham, NY, 1,4-6.
<http://www.sanbornmap.com/sept-oct.pdf> (Sep. 26, 2000).
PM. (2000). Plant Maintenance Resource Center, Winthrop, Western Australia. <http://www.plant-maintenance.com/maintenance_software.shtml> (Sep. 26, 2000).
RAILER. (1998). “RAILER Fact Sheet.” <http://www.cecer.army.mil/facts/sheets/FL44.html> (Sep. 26, 2000).
RECAPP. (2000). “RECAPP Home Page.” <http://www.recapp.com> (Sep. 26, 2000). Shahin, M.Y. (1992). “20 Years Experience in the PAVER Pavement Management System:
Development and Implementation", Pavement Management Implementation, F.B. Holt and W.L. Gramling, editors, ASTM, West Conshohocken, Pa.
SimCity. (2000). “SimCity Home Page.” <http://www.simcity.com> (Sep. 26, 2000).
Sommerhoff, E.W. (1999). World Wide Work, Facilities Design and Management, Chicago, Ill., May. Statistics Canada. (1994). Fixed Capital Flows and Stocks, 1961-1994 Historical, Statistics Canada,
Ottawa, Canada.
StatisticsCanada. (1996). Capital Expenditures by Type of Asset, Statistics Canada, Ottawa, Canada. StatisticsCanada. (1999). Private and Public Investment in Canada, Intentions 1999, Statistics Canada,
Ottawa, Canada
US Census. (1999). C30 - Value of New Construction Put In Place, U.S. Census Board, United States Department of Commerce, Washington, D.C. <http://www.census.gov/pub/const/C30/
c30_hist.html> (Sep. 26, 2000).
Vanier D.J. (1998). “Product Modeling: Helping Life Cycle Analysis of Roofing Systems", Proceedings of W78 Conference on The Life-Cycle of Construction IT Innovations: Technology Transfer from
Research to Practice, Stockholm, Jun , 423-435.
Vanier D.J. (2000). “Whole Life Building Management: Occupancy to Dismantling”, Proc. of
Vanier D.J., and Danylo, N. (1998). “Municipal Infrastructure Investment Planning: Managing the Data”, First International Conference on New Information Technologies in Civil Engineering, Montreal, Oct., 587-600.
Vanier D.J., and Danylo, N. (1998a). “Municipal Infrastructure Investment Planning: Asset Management”, APWA International Public Works Congress: NRCC/CPWA Seminar Series
Innovations in Urban Infrastructure, Las Vegas, Nv, 25-39. <http://www.nrc.ca/irc/uir/apwa/ apwa98> (Sep. 26, 2000).
Vanier, D.J. and Lacasse, M.A. (1996). “BELCAM Project: Service Life, Durability, and Asset
Management Research” Proc. 7th International Conference on the Durability of Building Materials and Components, Stockholm, Sweden, Vol. 2, 848-856.
Winnipeg. (1998). Strategic Infrastructure Reinvestment Policy: Report and Recommendations, Available from: Strategic Infrastructure Reinvestment Policy, City of Winnipeg, 100 Main Street, Winnipeg, Manitoba, Canada R3C 1A4, Tel: (204) 986-7997.
Yu K., Froese T., and Grobler, F (2000). “A development framework for data models for computer-integrated facilities management”, Automation in Construction, 9, 145-167.
Appendix A: Notation
BELCAM Building Envelope Life Cycle Asset Management Project
CAD computer aided design
CADFM computer aided design - facilities management
CAS condition assessment surveys
CERL Construction Engineering Research Laboratory (US Army Corps of Engineers) CERF Civil Engineering Research Foundation
CMMS computerized maintenance management systems
CR capital renewal
CRV current replacement value EMS engineered management system FCI facility condition index
GIS geographical information systems
LCAM/CAS life cycle asset management and condition assessment surveys
LCC life cycle costs
MIIP Municipal Infrastructure Investment Planning Project
NACUBO National Association of College and University Business Officers