Publisher’s version / Version de l'éditeur:
Vous avez des questions? Nous pouvons vous aider. Pour communiquer directement avec un auteur, consultez la première page de la revue dans laquelle son article a été publié afin de trouver ses coordonnées. Si vous n’arrivez pas à les repérer, communiquez avec nous à PublicationsArchive-ArchivesPublications@nrc-cnrc.gc.ca.
Questions? Contact the NRC Publications Archive team at
PublicationsArchive-ArchivesPublications@nrc-cnrc.gc.ca. If you wish to email the authors directly, please see the first page of the publication for their contact information.
https://publications-cnrc.canada.ca/fra/droits
L’accès à ce site Web et l’utilisation de son contenu sont assujettis aux conditions présentées dans le site LISEZ CES CONDITIONS ATTENTIVEMENT AVANT D’UTILISER CE SITE WEB.
Internal Report (National Research Council of Canada. Institute for Research in Construction), 1993-03
READ THESE TERMS AND CONDITIONS CAREFULLY BEFORE USING THIS WEBSITE.
https://nrc-publications.canada.ca/eng/copyright
NRC Publications Archive Record / Notice des Archives des publications du CNRC : https://nrc-publications.canada.ca/eng/view/object/?id=b4125201-d362-495f-86cc-e0e770493b9d https://publications-cnrc.canada.ca/fra/voir/objet/?id=b4125201-d362-495f-86cc-e0e770493b9d
NRC Publications Archive
Archives des publications du CNRC
For the publisher’s version, please access the DOI link below./ Pour consulter la version de l’éditeur, utilisez le lien DOI ci-dessous.
https://doi.org/10.4224/20358506
Access and use of this website and the material on it are subject to the Terms and Conditions set forth at
Fire Resistance Evaluation of Reinforced Concrete Columns Zhu, H. L.; Lie, T. T.
National Research Conseil national
*I
CoundCanada derecherchescanada interlral ,rp,x,ri : ~ ~ ~ t i t ~ t ~... .
.
.
ANAi..YGi<I S
",..',"
*. ...- -
Fire Resistance Evaluation of
Reinforced Concrete Columns
by H.L. Zhu and T.T. Lie
Internal Report No. 639
Date of issue: March 1993
( I ' i S T i Y I C I S T r,,$?i:::/~c$jE,;:
IQf'.
.
.. -. R e f"
....C > X ? T
K. *,.e.r - . . ve.d on:
<>e-:zf+q7;
-iiiterga: re7nr.i: t- - : j.i.!5ti.~i.%te for R e s e a r c h i n
Cuns%ri!c%i on C:anada
This is an internal report of the Institute for Research in Construction. Although not intended for general distribution, it may be cited as a reference in other publications
FIRE RESISTANCE EVALUATION OF REINFORCED CONCRETE COLUMNS
ABSTRACT
Experimental and theoretical studies were canied out to predict the fire resistance of reinforced concrete columns made with materials commonly used in China. For this purpose, the thermal properties at elevated temperatures were determined for the siliceous and carbonate aggregate concretes, of which the columns were made. Using these properties as input data in a mathematical model, calculations were made of the fire resistance of seven columns, which were constructed at the Tianjin Fire Research Institute and tested at the National Fire Laboratory of the Institute for Research in Construction, National Research Council of Canada.
A comparison between calculated and experimental results indicated that the method
employed in this study is capable of predicting the fire resistance of rectangular reinforced concrete columns, made of materials commonly used in China, with an accuracy that is adequate for
FIRE RESISTANCE EVALUATION OF REINFORCED CONCRETE COLUMNS
1 INTRODUCTION
For a number of years, joint research has been carried out between the Tianjin Fire Research Institute (TFRI) of the Fire Bureau of the Public Security lvIinistry of China and the Institute for Research in Construction @RC) of the National Research Council of Canada (NRC), in a project entitled "Fire Resistance Evaluation for Housing (China)". As a part of this project, experimental and theoretical studies were carried out to evaluate the fue resistance of reinforced concrete columns.
The main objective of these studies was to develop methods for the calculation of the fire
resistance of reinforced concrete columns made with materials commonly used in China. For this purpose, a mathematical model, developed recently at the National Fire Laboratory of IRC, was used as a basis for analysis [I].
In this report, the model is described and the results, obtained from the calculation of the fire resistance of TFRI columns and test results of siliceous and carbonate aggregate reinforced
concrete columns with varying dimensions, are presented.
2 CALCULATION PROCEDURE
The calculation procedure is described in detail in Reference [I]. The calculation of the fue resistance of columns is carried out in various steps. It involves the calculation of the temperatures in the column, plus its deformations and strength during the column's exposure to fire.
A flow chart of the calculation procedure is illustrated in Fig. 1.
2 . 1 Temperatures of the Column
The column temperatures were calculated using a finte diierence method [2]. Since the methods used to derive the heat transfer equations and to determine the temperatures for square and rectangular columns are described in previous reports published by NRC [I, 3,4,5], only the assumptions for the mathematical model and the calculated results will be presented in this paper. 2.1.1 Division of cross-section into elemen@
The cross-sectional area of the column is subdivided into a number of elements which are then arranged in a triangulw network (Fig. 2). The elements are square inside the column and triangular at its surface. For the interior elements, the temperature at the centre is taken as
representative of the entire element. For the triangular surface elements, the representative points are located on the centre of each hypotenuse.
For reasons of symmetry, only one quarter of the section needs to be considered when calculating the temperature distribution for columns with square or rectangular cross-sections. As illustrated in Fig. 2, for a Cartesian co-ordinate system (x-y), the point pm, has the co-ordinates x = (n-l)~d(2)1/2 and y = (m-l)Ad(2)1/2.
2.1.2 Assum~tions for the fire-concrete boundary
It is assumed that the columns are exposed on all sides to the heat of a fire whose temperature distribution follows that of the standard fue described in ISO-834 [5]. The temperature
distribution can then be given by the following expression:
where:
Tf = FurnaceTemperature ('C) To = Ambient Temperature (OC) t = Time (minutes)
The ambient temperature. To at the start of the tests was approximately 20°C.
The heat transfer between the furnace fire and the concrete surface of a column
is assumed to
be mainly by heat radiation, following Stefan-Boltzmann's law.2.1.3 Effect of moistm
The effects of moisture are taken into account by assuming that, for each element, the moisture in an element starts to evaporate when the temperature of the element reaches 100°C. During the period of evaporation, all of the heat supplied to an element is used for the evaporation of moisture, which continues until the element is dry.
2.1.4 Stabilitv criterion
Since the f ~ t e difference method is explicit, a stabiity criterion has to be satisfied to ensure that any existing error at some time will not be amplified in subsequent calculations. Following the method described in Ref. [2], it can be shown that, for the fire-exposed column, the criterion of stability is most restrictive along the boundary between the fire and concrete. From the reference, the criterion of stabiity is:
where the maximum value of the co-efficient of heat transfer, during exposure to the standard fire
am),
is approximately 675 W/m°C.The thermal and mechanical properties for concrete and steel used in the subsequent calculations are given in the Appendix.
2 . 2 Column Strength
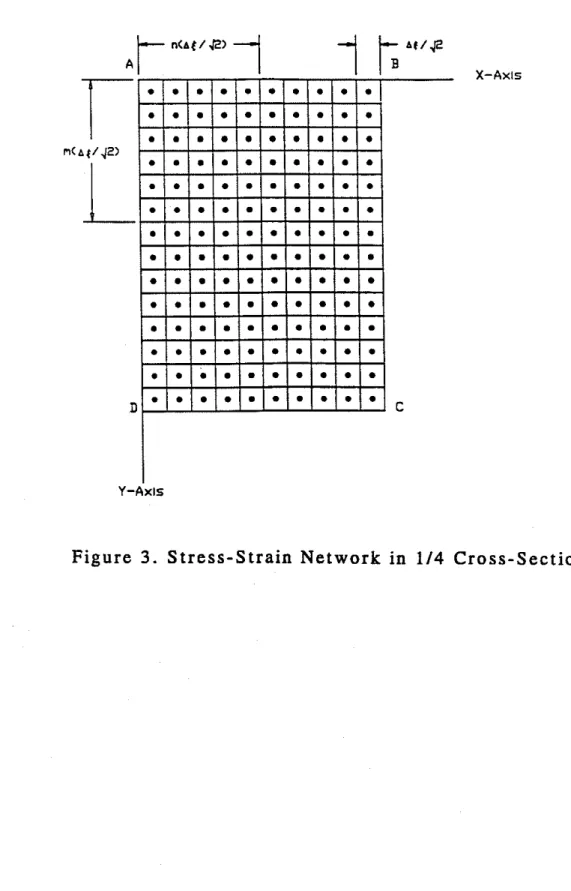
To calculate the deformations, stresses and strength of a column, the triangular network is transformed into a square network. In Fig. 3, a quarter section of this network, consisting of
square elements arranged parallel to the x and y axes of the section, is shown. The arrangement of the elements in the three other quarter sections is identical.
The temperatures, deformations and stresses of each element are represented by the temperatures, deformations and stresses at the centre of each element. The temperature at the centre of each element is obtained by averaging the temperatures of the elements in the triangular network.
For the steel reinforcing bars, a representative bar temperature can also be indicated. Measurements at various locations in steel bar sections during fire tests have shown that the differences in temperature in the bar and column sections are small [6]. A close approximation of the average bar temperature can be obtained by considering the column as consisting entirely of concrete and selecting the temperature at the location of the centre of the bar section as the
representative bar temperature. Thus, for a steel reinforcing bar, the centre of which is located at an element p-, the representative temperature of that bar is equal to that found at h.
Similarly, it is assumed that the stresses and deformations found at the centre of an element are representative of those of the whole element.
2.2.1 Assum~tions used in the calculation of streneth d u r i n ~ f%
During the exposure of the column to fm, the strength of a column decreases with the duration of exposure to the
fm.
The strength of a column can be calculated by using a method based on a load deflection analysis [7]. In this method, the columns, which are fixed at the ends during the tests, are idealized as pin-ended with length KL (Fig. 4). In this test series, a number of the columns were tested under concentric loading conditions. Since there are imperfections in the columns and the loading device, a small eccentricity exists. In subsequent calculations, a small value for the eccentricity (0.2 mm), representing a nearly concentric load, was selected to account for the initial eccentricity. The selection of a fmite value for the initial eccentricity is needed in order for the computer program to work.One column was tested under an eccentric load. In the calculation of the strength of this column, the contemplated eccen&icity of the load was assumed.
The curvature of a column is assumed to vary from pin-end to mid-height according to a straight line relation, as illustrated in Fig. 4. For such a relationship, the deflection at midheigh~ Y, in &s of the curvature of the column at this height, can be given by:
For any given curvature, and thus for any given deflection at mid-height, the axial srrain is varied until the internal moment, at the midsection, is in equilibrium with the applied moment given by the product:
load x (deflection
+
eccentricity)In this way, a load deflection curve can be calculated for specific times during the exposure to fire. From these curves, the strength of the column, i.e., the maximum load that the column can
cany, can also be determined for each time. In the calculation of column strength, the following assumptions were also made:
1 . The properties of the concrete and steel are those given in the Appendix. 2. Concrete has no tensile strength
3. Plane sections remain plane.
In the calculations, the network of elements shown in Fig. 3 was used. Since the stresses and strains of the elements are not symmetrical, with respect to the y axis, the calculations were performed for both the network shown and the identical network at the left of the y axis. The load that the column can carry and the moments in the section were obtained by adding the loads carried by each element and the moments contributed by them.
2.2.2 Equations for concrete
The strain in the concrete for the elements on the right hand side of the y-axis (Fig. 3) is given by:
and for the elements on the left hand side of the y-axis:
(E& = - ( d T + E
-
Xc/P
where:(EST
= the thermal expansion of the concrete (m m-1)E = the axial strain of the column (m m-1)
x,
= the horizontal distance from the centre of the elements to the veaical plane through they-axis of the column section (m)
P = the radius of curvature (m)
The stresses in the elements are calculated by using the stress-strain relations for concrete, given in the Appendix.
2.2.3 Eauations for steel
The strain in the steel reinforcing bars can be given as the sum of the thermal expansion of the steel (%)I. and the axial strain of the column %lp, where x, is the horizontal distance of the concrete of the section of steel bar to the vertical plane through the y-axis of the column section, and p is the radius of curvature. For the steel bars to the right of the y-axis, the strain ( E ~ ) ~ is given by:
For the steel bars to the left of the y-axis, the strain (E~)L is given by:
The stresses in the steel are calculated using the stress-strain relation for steel given in the Appendix. 2.2.4 Procedure for the calculation of column strength -
With the aid of Equations 4 through 7 and the stress-strain relations given in the Appendix, the stresses, at midsection in the concrete elements and in the steel bars, can be calculated for any value of the axial strain and curvature. From these stresses, the load that each element and
reinforcing bar carries and its subsequent contribution to the internal moment at midsection, can be determined By adding these loads and moments, the load that the column carries and the total internal moment at midsection can be calculated.
The fire resistance of the column is then derived by calculating its strength, defined as the maximum load that the column can carry, at several consecutive times during its exposure to fm. The strength reduces gradually with time. At a certain point, the strength becomes so low that it is no longer sufficient to support the load and the column fails. The time to reach this failure point is then the fm resistance of the column.
3 TEST SPECIMENS
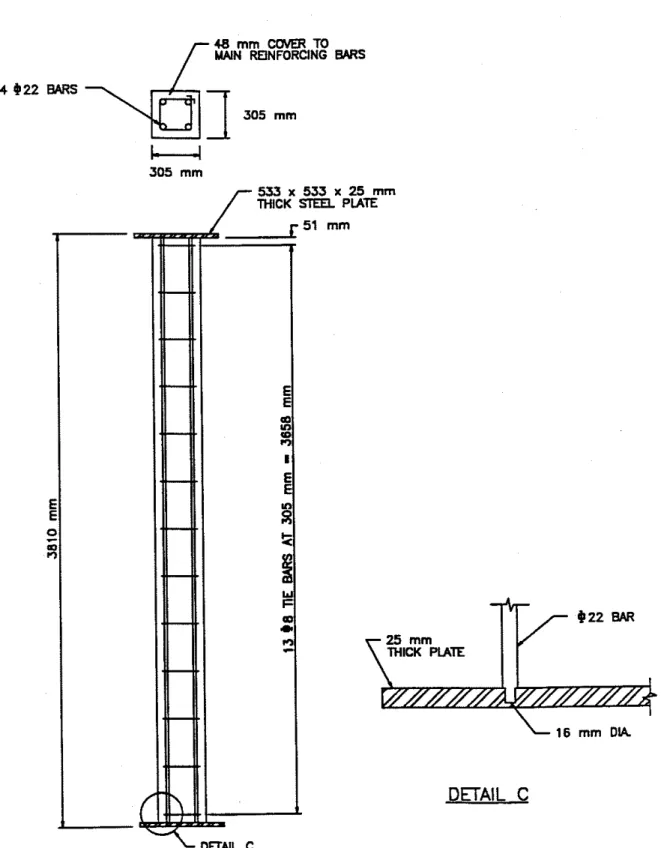
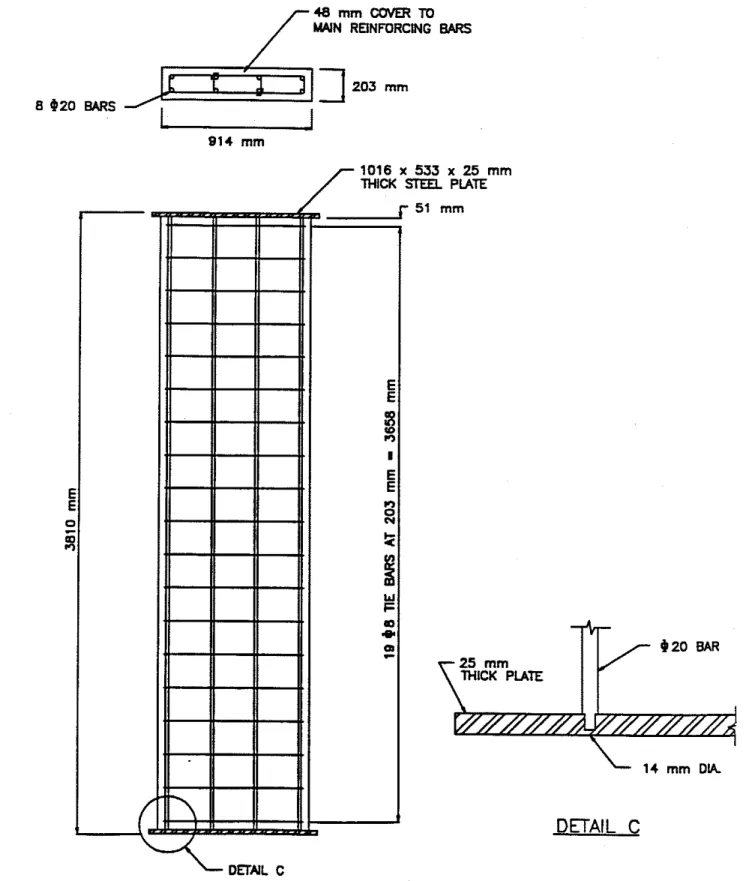
The specimens consisted of rectangular reinforced concrete columns made with siliceous and carbonate aggregate. They are described in detail in Reference 181 and flustrated in Figs. 5-9. The dimensions of the columns and other specifics of the columns are given in Table 1.
Columns 1 to 4 and 7 had four 22 mm longitudinal bars. Columns 5 and 6 had eight 20 mm longitudinal bars. The bars of these columns were tied with 8 mm ties. The location of the main reinforcing bars, which were welded to steel end plates, and ties are shown in Figs. 5-9.
The main reinforcing bars had a specifiid yield strength of 340 MPa and the yield strength of the ties was 240 MPa.
The concrete mix was designed for a compression cylinder strength at 28 days of approximately 25 MPa. The mix proportions were as follows:
Siliceous Concrete Mix
Cement 304 kg/m3 Aggregate 1265 kg/m3 Sand 626 kg/m3 Water 170 kg/rn3 Carbonate Concrete M i Cement 314 kg/m3 Aggregate 1306 kg/m3 Sand 647 kg/m3 Water 176 kg/m3
The average compressive cylinder strengths of the test columns, measured on the day of testing, are given in Table 1. The moisture condition at the centre of the column was also measured on the day of the test and the measured relative humidities are given in Table 1. The density of the siliceous aggregate concrete was 2365 kgIm3 and that of the carbonate aggregate concrete was 2443 kgtm3.
Chromel-alumel thermocouples, 0.91 mrn thick, were installed at midheight in the columns for measuring concrete temperatures at different locations in the cross-section. The locations of the thermocouples are described in detail in Reference [8].
4 TEST APPARATUS
The tests were carried out by exposing the columns to heat in a column test furnace. The test furnace was designed to produce the conditions to which a member might be subjected during a fire. The furnace consists of a steel framework supported by four steel columns, with the furnace chamber inside the framework The characteristics and instrumentation of the furnace, which has a loading capacity of 1000 t, are described in detail in a previous paper [9].
5 RESULTS AND DISCUSSION 5 . 1 Measured Results
Seven specimens were tested. The specimens consisted of five square, and two rectangular, tied reinforced concrete columns. The dimensions and properties of the columns are described in detail in Ref. [8]. In this report, only a comparison of the results, obtained from measurements and calculations, will be given.
The calculated and measured temperatures at various depths along the centreline of a column, as a function of exposure time,
are
given in Figs. 10-18. The calculated and measured axial deformations of the columns, as a function of exposure time, are given in Figs. 19-25. 5 . 2 DiscussionUsing the mathematical model described in this paper, the temperatures in the columns and the axial deformations of the columns were calculated. In the calculations, the thermal properties - . of the two types of concrete most commonly used in China were used.
In Figs. 10-18, the calculated temperatures are compared with those measured at various depths in the square columns (Column Nos. 1-4 and 7) and the columns with rectangular cross- sections (Column Nos. 5-6). Except for Column No. 6 , which had a section 200 x 900 mm, all of
the columns showed reasonably good agreement between the calculated and measured column temperatures, except for the temperatures measured at the centre of the specimens at an early stage. The temperatures in these Figures are the average of the measured temperatures recorded by the symmetrically-located thermocouples at the same depth.
The temperatures measured at the centres of the columns initially showed a rapid rise in temperature followed by a period of nearly constant temperature for the early stages of the test This temperature behaviour may be the result of thermally-induced migration of the moisture towards the centre of the column where, as shown in the figures, the influence of migration is most
pronounced. Although the model takes into account the evaporation of moisture, it does not take into account the migration of moisture towards the centre of a column. This migration appears to account for the deviations between the calculated and measured temperatures at the early stages of
fire exposure. At the later stages, however, (the most important stage for the prediction of the fue resistance of a column) there is good agreement between the calculated and measured temperatures. Column No. 6 , with a cross-section of 200 x 900 mm, did not show as good an agreement
between the calculated and measured values. This temperature behaviour may be the result of reduced uniformity of the heat transfer from the furnace to the column surface, because of the relatively large width of the column. This width is 900 mm whereas the width of the cross-section of the column furnace is 2500 x 2500 mm. Since the distances between the surfaces of the
specimen and the inner surface of the column furnace are less on the shorter sides of the column section than on the longer sides, there is a difference in the thickness of the hot gas layers between the different column surfaces and the inner surface of the column furnace. In general, the thicker the layer, the higher the heat transfer by radiation from the hot gas to the column surfaces.
Therefore, the heat transfer by radiation from the hot gas to the smaller sides of the column will be lower than to the larger sides. The lower heat transfer produces relatively lower temperatures in the column as shown in Figs. 16 and 17.
In Figs. 19-25, the calculated and measured axial deformations of the columns, during exposure to fire, are shown. It can be seen that the mathematical model predicts reasonably well the trend in the progression of the axial deformations with time. The largest differences between calculated and measured axial deformations are on the order of 5 mm, which may be regarded as small when considering that these are differences between calculated and measured deformations for columns of a length of more than 3500 mm. It should also be noted that these columns deform axially as a result of several factors, namely, load, thermal expansion, bending and creep. These factors cannot be completely taken into account in these calculations.
The calculated and measured fire resistances of the columns are listed in Table 1. For square cross-sectional columns (Column Nos. 1-4), with non-eccentric load, it can be seen that the results calculated by the model are in good agreement with those measured in the furnace. The differences between the calculated and measured fire resistances are less than 10% for these columns. For the rectangular columns (Column Nos. 5 and 6). the calculated
fire
resistance is in reasonableagreement with the measured fue resistance for the column with a cross-section of 300 x 400 mm
(Column No. 5). The difference between the calculated and measured f r e resistances for this column is approximately 15%. For the column with a cross-section of 200 x 900 mm (Column
No. 6), however, the predicted f r e resistance is substantially lower than the measured fire
resistance. A part of this difference can be attributed to the lower heat transfer to the smaller sides of the column, as explained earlier. Another part is caused by the considerable contraction of this relatively slender column, which the model can only partly take into account
For the eccentrically-loaded column (Column No. 7). the predicted fire resistance is substantially higher than the measured fire resistance. The reason for the low experimental fue resistance is that, during the test of this column, cracks developed which, at 38 minutes into the test, suddenly became large in length and width, causing the column to fail prematurely at 40 minutes. Such failures did not occur in tests carried out earlier on similar columns.
6 CONCLUSIONS
Based on the results of this study, the following conclusions can be drawn:
1. The mathematical model employed in this study is capable of predicting the fire resistance of concentrically-loaded, square reinforced concrete columns, made of materials commonly used in China, with an accuracy that is adequate for practical purposes.
2. The results indicate that the predictions are also reasonably accurate for rectangular
concentrically-loaded columns, provided the height to breadth ratio of the cross-section does not exceed approximately 1.5.
3. Using the model, the fire resistance of concentrically-loaded square and rectangular reinforced concrete columns can be evaluated for any value of the significant parameters (such as load, column section size, column length, concrete strength and percentage of reinforcing steel), without the necessity of testing.
REFERENCES
Lie, T.T. and Irwin, R.J., Evaluation of the Fire Resistance of Reinforced Concrete
Columns with Rectangular Cross-Section, IRC Internal Report No. 601, Institute For
Research in Construction, National Research Council of Canada, Ottawa, 1990.
Dusinberre, G.M., Heat Transfer Calculations by Finite Differences, International Textbook
Company, Scranton, PA, 1961.
Lie, T.T. and Harmathy, T.Z., A Numerical Procedure to Calculate the Temperature of
Protected Steel Columns Exposed to Fire, Fire Study No. 28, Division of Building
Research, National Research Council of Canada, NRCC 12535, Ottawa, Ontario, 1972. Lie, T.T., Temperature Distributions in Fire-Exposed Building Columns, Journal of Heat Transfer, Vol. 99, Series C, No 1, 1977, P.113-119.
Fi Resistance Tests - Elements of Building Construction, International Standard ISO-834,
1975.
Lie, T.T., Lin, T.D., Allen, D.E. and Abrams, M S . , Fire Resistance of Reinforced
Concrete Columns, National Research Council of Canada, Division of Building Research,
NRCC 23065, Ottawa, Ontario, 1984.
Allen, D.E. and Lie, T.T., Further Studies of the Fire Resistance of Reinforced Concrete
Columns, National Research Council of Canada, Division of Building Research, NRCC
14047, Ottawa, Ontario, 1974.
Wu, H.J., and Lie, T.T., Fire Resistance of Reinforced Concrete Columns - Experimental Studies, IRC Internal Report No. 632, Institute For Research in Construction, National
Research Council of Canada. Ottawa. 1992.
9. Lie, T.T., New Facility to ~ e t e n n i n e Fire ~esistance of Columnr, Canadian Journal of Civil
Engineering, Vol. 7, No. 3, 1980, pp. 551-558.
10. Hu, X.F., Lie, T.T., Polomark, G. and MacLaurin, J.W., Thermal Properties of Building
Materials at Elevated Temperature, in preparation.
1 1. Lie, T.T. and Woollerton, J.L., Fire Resistance of Reinforced Concrete Columns: Test
Results, Internal Report No. 569, Institute for Research in Construction, National Research
NOTATION
c specific heat (J/(kg°C))
fc compressive strength of concrete at temperature T @Pa)
f' c cylinder strength of concrete at temperature T (MPa) f co cylinder strength of concrete at room temperature @Pa)
f~ strength of steel at temperature T (MPa)
f ~ 0 yield strength of steel at room temperature (MF'a)
h coefficient of heat transfer at fire exposed surface (WI(m2OC))
j 0, 1, 2 ,
...
k thermal conductivity (Wl(m°C)) K effective length factor
1 length of column used in the calculation of axial deformation (m)
L
unsupported length of column (m)M number of points along y-axis
N
number of points along x-axisP point t time (h) T temperature ("C) V volume of moisture (m3) x coordinate (m) Y coordinate (m)
Y
lateral deflection of column at mid-height (m)a coefficient of thermal expansion (11°C)
A increment
A t mesh width (m)
E emissivity, strain ( d m )
h heat of vaporization (Jlkg)
P density (kg/m3), radius of curvature (m)
0 Stefan-Boltzmann constant (WIm2K4)
9 concentration of moisture (fraction of volume) X curvature of column at mid-height (llm) Subscripts
B
of steel reinforcement 0 at room temperature c of concretef of the fire
m&l at the points m, M in the column max maximum
n,N at the points n,
N
in a row L left of the x-axisR right of the x-axis
P pertaining to proportional stress-strain relation
S of steel
T pertaining to temperature w of water
1 2 at the points 1,2
APPENDIX: MATERIAL PROPERTIES AND SPECWICS OF COLUMNS AND FURNACE
The values of the material properties used in this study are the same as those used in
Reference 1 for the calculation of the fire resistance of reinforced concrete columns with the exception of the thermal properties of the concrete. The thermal properties have been measured recently for both siliceous and carbonate aggregate concrete and are given in Reference 10.
CONCRETE PROPERTIES Stress-strain relations where = 0.0025
+
(6.OT+
0.04p) x 10-6 and for O°C < T < 450°C fc = f a for 450°C<
T<
874OC fc = fco p . 0 1 1 - 2.353( 1
for T > 874OCfc
= 0 Specific heatFor carbonate aggregate concrete for 0 I T I 570°C c = 1136.03
+
0.05T for 570 < T 5 610°C c = -1867.1+
5.32T for 610 <T1690°C c = -52846.32+
88.89Tfor 690 < T I 800°C c = 55469.09 - 68.09T for 800 < T 1 880°C c = 5927
-
6.16T for 880 < T I 1000°C c = 329.07+
0.21T For siliceous aggregate concretefor 0 S T 5 500°C c =992.29 - 0.78T for 500 < T 1 570°C c = -3504.56
+
8.22T for 570 < T 1 600°C c = 12111 - 19.18T for 600 < T 1 680°C c = 1953 - 2.25T for 680 < T 1 740°C c = -10853.67+
16.58T for 740 < T 5 770°C c = 26383.13-
33.74T for 770 < T 5 1000°C c = 400 Thermal conductivity for 0 1 T 1 293OC k, = 1.355 W m-1°C-I for T > 293OC k, =-0.001241T+
1.7162 W m-1°C-ICoefficient of thermal expansion
STEEL PROPERTIES Stress-strain relations
where Ep = 4 X 10⁻⁶ fyo and f(T,OOl) = (50 - 0.04T) x [ I - exp((-30
+
0.03~)-] x 6.9 (32) for ES > EP fy = f(T,0.001) 0.001 + f(T,(&, - E~+
0.001)) - f(T,0.001) where f(T,(& - E,+
0.001)) = (50 - 0.04T) x [ I - exp((-30+
0.03T).((~, - E~+
0.001))1 x 6.9 (34) Thermal capacity for 0°C S T 1 650°C p,c, = (0.004T+
3.3) x lo6 J~I-~oc-'
for 650°C < T 5 725OC p,c, = (0.068T+
38.3)x
106 J m-3°C.' for 725OC < T I 800°C p,c, = (-0.086T+
73.35)x
lo6 J m-3OC-I for T > 80O0C p,c, = 4.55 x lo6 J m-3°C' Thermal conductivity for 0°C S T 1 900°C&
= - 0.022T+
48 W m-l°C-' for T > 900°C k, = 28.2 W m-1°C-'Coefficient of thermal expansion
for T < 1000°C
a, = (0.004T
+
12) x 1 ~ ~ O c - lfor T 2 1000°C
WATER PROPERTIES Thermal capacity
Heat of vaporization
h, = 2.3
x
lo6 J kg-'SPECIFICS OF COLUMNS AND FURNACE ~f = emissivity of column furnace fire: 0.75
E = emissivity of concrete: 0.8
KL = effective length of columns: 2.0 m for fire resistance calculations 1 = length of column that contributes to axial deformation: 3.5 m
15
TABLE 1. SUMMARY OF TEST PARAMETERS AND RESULTS
Column No. 1 2 3 4 5 6 7 Cross-section (mm) 300 x 300 x 3810 3 0 0 ~ 3 0 0 ~ 3 8 1 0 300 x 300 x 3500 300 x 300 x 3500 300 ~ 4 5 0 ~ 3 8 1 0 2 0 0 ~ 9 0 0 ~ 3 8 1 0 300 x 300 x 3810 Steel (%) 1.689 1.689 1.689 1.689 1.862 1.392 2.533 Failure (min) Aggregate Siliceous Carbonate Siliceous Carbonate Carbonate Carbonate Siliceous Theory 104 164 96 184 266 82 78 Actual 98 164 108 175 230 175 40 f'c (MPa) 30.2 23.2 23.4 26.4 26.8 21.9 27.3 Test Load (kN) 1180 1180 1180 1180 1585 2218 910 (axial) 49 (eccen.)
LIST OF FIGURES
Figure 1 Flow chart of calculation procedure Figure 2 Thermal network in 114 cross-section Figure 3 Stress-strain network in 114 cross-section Figure 4 Load deflection analysis
Figure 5 Elevation and cross-section of Column Nos. 1 and 2 Figure 6 Elevation and cross-section of Column Nos. 3 and 4 Figure 7 Elevation and cross-section of Column No. 5
Figure 8 Elevation and cross-section of Column No. 6 Figure 9 Elevation and cross-section of Column No. 7
Figure 10 Temperatures at various depths along centreline of Column No. 1 (305 x 305 x
38 10 mm, siliceous)
Figure 11 Temperatures at various depths along centreline of Column No. 2 (305 x 305 x
3810 mm, carbonate)
Figure 12 Temperatures at various depths along centreline of Column No. 3 (305 x 305 x
3500 mm, siliceous)
Figure 13 Temperatures at various depths along centreline of Column No. 4 (305 x 305 x
3500 mm, carbonate)
Figure 14 Temperatures at various depths along centreline parallel to short side of Column No. 5 (300 x 450 x 3810 mm, carbonate)
Figure 15 Temperatures at various depths along centreline parallel to long side of Column No. 5 (300 x 450 x 3810 mm, carbonate)
Figure 16 Temperatures at various depths along centreline parallel to short side of Column No. 6 (200 x 900 x 3810 mm, carbonate)
Figure 17 Temperatures at various depths along centreline parallel to long side of Column No. 6 (200 x 900 x 3810 mm, carbonate)
Figure 18 Temperatures at various depths along centreline of eccentrically loaded Column No. 7 (305 x 305 x 3810 mm, siliceous)
Figure 19 Calculated and measured axial deformations of Column No. 1 (305 x 305 x
38 10 mm, siliceous)
Figure 20 Calculated and measured axial deformations of Column No. 2 (305 x 305 x
21 Calculated and measured axial deformations of Column No. 3 (305 x 305 x 3500 mm, siliceous)
Figure 22 Calculated and measured axial deformations of Column No. 4 (305 x 305 x
3500 mm, carbonate)
Figure 23 Calculated and measured axial deformations of Column No. 5 (300 x 450 x
38 10 mm, carbonate)
Figure 24 Calculated and measured axial deformations of Column No. 6 (200 x 900 x
3810 mm, carbonate)
Figure 25 Calculated and measured axial deformations of eccentrically loaded square Column No. 7 (305 x 305 x 3810 mm, siliceous)
CALCULAnON OF FIRE
TEMPERATURE
THERMAL CALCULATION OF hEMBER
PROPERTIES EMeER4m
/
~
A
CALCULATION OF SlltAINS-
~
RELATIONS ANDSlRESSES
CHANGE CURVATURE
AND AXIAL SlRAIN
\
/
L IYES
INCREASE TIME
Curvature
22
/-
48 W I N REINFORCING mm COMR TO BARS25 mm
THICK PLATE
I Y
DETAIL C
4 8 mm COW?
m
M N REINFORCING BARSf -
533 x 533 x 25 mmTHICK STEEL PIATE
DETAIL
C
24
/-
48 MAlN REINFORCING BARS mm COMR TOa 420 c m s - - / ~
457 m m
864 x 533 x 38 mm
THICK STEEL PLATE
1 E E
z
ID n 38 mm DETAILC
-
4 8 mm COVER TO
W N REINFORCING BARS
1016 x 533 x 25 mm THICK STEEL PLATE
14 mm DIA
DETAIL
C
4 8 mm COVER TO
MAlN REINFORCING BARS
4 *22 BARS
/
I
I
I-Jo5mm
I
711 mmI
864 x 635 x 38 mm
THICK SlEEL PIATE
4 422 BARS M N D
10 TOP OF COLUMN
38 mm
THICK PLATE
I
r
DETAIL
C
I I I I
- - -
Measured-
I I I I Depth: 12mm 150mm (Centre) Time, minFigure 10. Temperatures a t Various Depths Along Centreline of Column No. 1
Time, min I I I
---
Measured-
Depth: 12mm 150mm (Centre)Figure 11. Temperatures a t Various Depths Along Centreline of Column No. 2
I I Calculated
---
- I I Time, min Depth: l2mm 150mm (Centre)Figure 12. Temperatures a t Various Depths Along Centreline of Column No. 3
Depth: 12mm
150mm (Centre)
Time, min
Figure 13. Temperatures a t Various Depths Along Centreline of Square Column No. 4 (305 X 305 X 3500 mm, Carbonate)
000 I I I I
Calculated
Depth: l2mm
Time, min
Figure 14. Temperatures a t Various Depths Along Centreline Parallel to Short Side of
Column No. 5 (300 X 450 X 3810 mm, Carbonate) 150mm (Centre)
I I I Calculated
- -
- -
-
Measured - @ @ Depth: 12mm (Centre) Time, minFigure 15. Temperatures a t Various Depths Along Centreline Parallel t o Long Side of
I I I Calculated -I e e
---
Measured * * * 0 ) - / @ - - I Depth: 12mm lOOmm (Centre) Time, minFigure 16. Temperatures a t Various Depths Along
Centreline Parallel t o Short Side of Column No. 6 (200 X 900 X 3810 mm, Carbonate)
Depth: 12mm 800 38mm 63mm 600 U lOlmm 6
2
450mm c, 6 400 (Centre) & w2
w b 200 0 0 50 100 150 Time, minFigure 17. Temperatures a t Various Depths Along
Centreline Parallel t o Long Side of Column No.6 (200 X 900 X 3810 mm, Carbonate)
I I I
- Calculated
---
Measured --
-
-
-___---
I I I Depth: 12mm 150mm (Centre) Time, minFigure 18. Temperatures of Various Depths Along Centreline of Eccentriccally Loaded Column No. 7
50 Time, min I \ \ \
-
'
.
\ Calculated \ \ \ , , , , , , Measured \ \ \ \ \ \ \ \ I I I IFigure 19. Calculated and Measured Axial Deformations
I I I - \ \ \ \ \ Calculated \ \ \
-
\ - , ,-
--
, Measured I I I 50 100 150 Time, minFigure 20. Calculated and Measured Axial Deformations of Column No. 2 (305 X 305 X 3810 mm, Carbonate)
5
I I U 02
-
& \ a Calculated \ r-r \ a, ,-
, , ,-
Measured \z
\ a, \ E-. \ \ \ - 5 I 1 0 50 100 Time, minFigure 21. Calculated and Measured Axial Deformations
Time. mm I I I
_---
-
.
-
\.
.
\.
\ \ \ \ Calculated \ \ \- - -
-
Measured \ \ \ \ - \ - \ \ \ I I IFigure 22. Calculated and Measured Axial Deformations
Time, min
5 I I I I
_---
.
-
-
-
.
Figure 23. Calculated and Measured Axial Deformations
of Column No. 5 (305 X 457 X 3810 mm, Carbonate)
!i
0 .* 4;
L o W e,a
-5 m .,.. X 4 -10 Calculated-
---Measured \\
\ I I I I 0 50 100 150 200 2505
E
0E
-
d 0 .A 42
L 0 II ala
-5 d m.-
2
-10 0 50 100 150 Time, minFigure 24. Calculated and Measured Axial Deformations
of Column No. 6 (200 X 900 X 3810 mm, Carbonate)
I I I
.
.
\ \ \ \ \ - \ \ \ \ \ \ Calculated \ \---
Measured \ \ \ - \ - \ \ \ \ \ \ \ \ I I I I \, , , , , , Measured
I
- 5
0 10 20 30 40
Time, min
Figure 25. Calculated and Measured Axial Deformations of Eccentriccally Loaded Column No. 7