Publisher’s version / Version de l'éditeur:
Journal of Wind Engineering and Industrial Aerodynamics, 34, 3, pp. 223-250, 1990-08
READ THESE TERMS AND CONDITIONS CAREFULLY BEFORE USING THIS WEBSITE.
https://nrc-publications.canada.ca/eng/copyright
Vous avez des questions? Nous pouvons vous aider. Pour communiquer directement avec un auteur, consultez la première page de la revue dans laquelle son article a été publié afin de trouver ses coordonnées. Si vous n’arrivez pas à les repérer, communiquez avec nous à PublicationsArchive-ArchivesPublications@nrc-cnrc.gc.ca.
Questions? Contact the NRC Publications Archive team at
PublicationsArchive-ArchivesPublications@nrc-cnrc.gc.ca. If you wish to email the authors directly, please see the first page of the publication for their contact information.
NRC Publications Archive
Archives des publications du CNRC
This publication could be one of several versions: author’s original, accepted manuscript or the publisher’s version. / La version de cette publication peut être l’une des suivantes : la version prépublication de l’auteur, la version acceptée du manuscrit ou la version de l’éditeur.
Access and use of this website and the material on it are subject to the Terms and Conditions set forth at
Snow drifts on flat roofs : wind tunnel tests and field measurements
da Matha Sant'Anna, F.; Taylor, D. A.
https://publications-cnrc.canada.ca/fra/droits
L’accès à ce site Web et l’utilisation de son contenu sont assujettis aux conditions présentées dans le site LISEZ CES CONDITIONS ATTENTIVEMENT AVANT D’UTILISER CE SITE WEB.
NRC Publications Record / Notice d'Archives des publications de CNRC: https://nrc-publications.canada.ca/eng/view/object/?id=ed70dc40-7dea-4315-a27c-09fbbc337545 https://publications-cnrc.canada.ca/fra/voir/objet/?id=ed70dc40-7dea-4315-a27c-09fbbc337545
Ser
-TH
1
National Research Consell nationalN21
d1
Council Canadade
~ r e h e s Canadano.
1689c * 2 Institute for
"
lnstitut deBLDG Research in recherche en
- Construction construction
Snow Driits on Flat Roofs:
Wind Tunnel Tests and Field 4
Measurements
by F. Da Matha Santanna and D.A. Taylor
Reprinted from
Journal of Wind Engineering and Industrial Aerodynamics, 34 (1990) 223-250
Elsevier Science Publishers B.V., Amsterdam (IRC Paper No. 1689)
- - - - Resume
On a mis au point des r&gles de mise B khelle pour concevoir des experiences et choisir des particules en vue de la mod6lisation, dans une soufflerie aerodynamique
B couche limite, des amoncellements de neige sur les batiments. Plusieurs maquettes de batiments B toit plat A d e w niveaux ont 6t6 btudiks dans la soufflerie. Le rapport longueur-hauteur des bgtiments variait entre 1,O et 10,0, et la longueur des niveaux infbrieurs variait entre 1,3 et 5 fois leur hauteur aux niveaux superieurs. Pour evaluer les hauteurs de simili-neige apr&s chaque essai, on a utilisC un appareil de mesure tridimensionnelle ?I course transversale muni d'un indicateur de hauteur. Deux batiments B toit plat situbs B Ottawa (Canada) ont Ct6 choisis aux fins de comparaison des mesures en soufflerie et de celles en vraie grandeur. L'kart entre les resultats des essais en vraie grandeur et ceux des essais sur maquettes tient en partie B des conditions de realisation differentes : les changements de direction du vent n'ont pu &re pris en compte parce que les maquettes etaient trop longues pour effectuer une rotation compl&te dans la soufflerie. Les similarites entre les hauteurs de neige A l ' a e l l e r a u i t e et B Mchelle r&ue sent assez nomh
---
"-""-
2- u snuc~&s dans une soufflerie plus graniJournal of Wind Engineering and Industrial Aerodynamics, 34 (1990) 223-250 Elsevier Science Publishers B.V., Amsterdam - Printed in The Netherlands
SNOW DRIFTS ON FLAT ROOFS: WIND TUNNEL TESTS AND FIELD MEASUREMENTS
1 F. DA MATHA SANT'ANNA* and D.A. TAYLOR
Structures Section, Institute for Research in Construction, National Research Council, Ottawa, KIA OR6 (Canada)
r ; (Received August 23,1985; accepted in revised form April 4,1990)
Summary
Scaling rules are developed for the design of experiments and choice of appropriate particles to model snow drifting on buildings in a boundary-layer wind tunnel. Several model buildings with two-level flat roofs were studied in the tunnel. The length-to-height ratios of the buildings varied from 1.0 to 10.0 and the lengths of lower roofs varied from 1.3 to 5 times the heights to the upper levels. A three-dimensional traversing mechanism holding a depth-marker was used for collecting "snow" depths after each test. Two flat-roofed buildings in Ottawa, Canada, were selected for comparison of wind tunnel with full-scale measurements. The discrepancy between results of full- scale and model-scale testing is due in part to dissimilar running conditions: the changes in wind directions could not be followed because the model buildings were too long to be rotated fully in the wind tunnel. There are enough similarities between model and full-scale snow depths to in- dicate that further investigation with a larger wind tunnel would be worthwhile.
1. Introduction
In 1982 research on modelling the formation of snow drifts on roofs was started at the Institute for Research in Construction, National Research Coun- cil of Canada. The aim was to simulate depths of snow drifts on roofs using models in a wind tunnel.
( 1 ) Scaling relations were developed for simulating snow drifting on build- ings in a thick boundary-layer wind tunnel. These allowed the selection of
L' particles to model the snow.
(2) A water tunnel was used for visualizing flow behaviour around two-level flat roofs as an aid to understanding the drifting process.
( 3 ) Wind tunnel tests were done and the results compared with field mea- surements of snow drifts on two two-level flat roofs obtained during a 15 year survey.
*Present address: 1785-F Lamoureux Drive, Orleans, Ont., K1E 2H3, Canada.
224
2. Particle and time scaling 2.1. Introduction
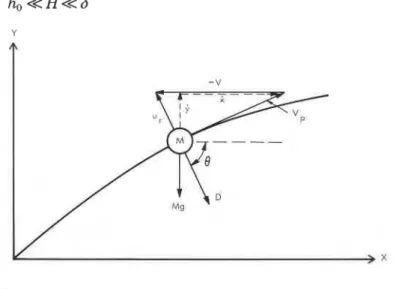
For modelling of snow transported by saltation, particles are scaled to achieve geometric, kinematic, and dynamic similarity. Scaling requirements can be de- rived from a particle trajectory (Fig. 1 ) to give the following relation between velocities and forces [ I ]
and
In eqn. ( I ) ,
x
is the horizontal distance in the direction of particle movement and y is the distance above the floor of the tunnel; the drag forceD
is equal to K,u,, where u, is the velocity of the particle relative to the fluid and KO is a constant of proportionality related to "d", the particle diameter. The vertical velocity component of the fluid is assumed to be zero; therefore the second term in eqn. ( 2 ) will be zero. Further, the velocity profile is assumed to be linear within the thick, turbulent, boundary-layer where y is less than the roughness length, 2,. Thus V= KO where V is the local fluid velocity at the particle; g is the gravitational acceleration.In addition, the following is assumed.
(1 ) The thickness S of the boundary layer is not a relevant parameter because
where h, is the height of the roughness elements in the upstream boundary layer and H is the height of the model building. Further, the model building is sharp edged causing a well defined separation bubble downstream.
(2) The model height
H
is the only length scale imposed on the flow.( 3 ) Flow is independent of viscosity if
Rey,
>>
1 (4)River silt and, in moving air, sand, dust and snow rise from the surface as "clouds" of particles [2-61. The clouds are thrown up by surface eddies and may penetrate into the mean flow [7-91. The authors observed such clouds over models of flat-roofed buildings in water tunnel experiments which they performed prior to using the wind tunnel (Figs. 2 and 3 ) . Such experiments show approximate mean flow patterns over flat-roofed buildings due to flow separation.
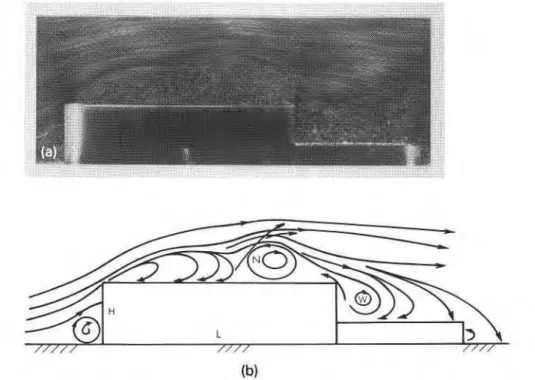
From observations of flow over models in the water tunnel (Figs. 2 ( a ) , (b ) ) it appears that the separation bubble collapses periodically and that vortices from the collapsing bubble become a downstream-moving vortex system (lo- cation N in Fig. 2 ( b ) ). This vortex system moves the "cloud" of particles until
Fig. 2. Flow behaviour around a two-dimensional bluff body (building with two-level flat roof) in a water tunnel, showing collapsing and rolling bubble, L / H = 3.74 and Rey = lo4. (b) Sketch of mean flow patterns over long building, indicating fully developed bubble a t leading edge. The formation region is shown rolling up as vortex system N.
GROWING
REATTACHMENT SHEAR LAYER SECONDARY POINT
BUBBLE LINE FLUCTUATES OF SEPARATION
SEPARATION RECIRCULATION POINT POINT L \ 'ONTAL /// I / / / ' \ ZONE VORTEX L - = 3 . 7 4
CORNER^
H EDDIES (a)Fig. 3. (a) Approximate mean flow pattern over a building. Arrows show reverse flow and growing bubble. ( b ) Flow behaviour around a two-dimensional bluff body (building with a two-level flat roof) in a water tunnel, showing collapsing bubble exhausting into the near-wake. L/H=3.74 and Rey = lo4.
the system breaks down and casts up particles into the near wake (W in Fig. 2(b) ).
The dimension 1 of the "clouds" depends on the variation of the flow field near the model, the structure of the turbulence, and the velocity gradient in the shear layer. 1 is related to the turbulent convection process of the particles,
1 is chosen as a reference length of the micro scale of the motion of the solid.
particle
[lo]
; thus the following non-dimensional parameters are obtained:where 1 is as defined above, d is a characteristic dimension, of a particle, and p
is the characteristic density for a particle of mass M. The subscript m repre- sents model scale conditions.
roughness length, 2 , which depends on the density of the roughness elements
[81:
lccz0 (6)
From eqns. 1 and 2 one can deduce the motion of a model scale particle (subscript m ) of mass
M,
and
As explained in Appendix
A,
non-dimensional parameters introduced in eqns. 7 and 8 give:Strom et al. [ I ] obtained similar equations for trajectories of particles in the model tests in a wind tunnel.
2.2. Scaling requirements
Geometric similarity. The macro scale of the model building was assumed to be
From eqn. (11) one can obtain:
where m and p represent respectively model and prototype. The micro scale of the motion of the solid particle
Dynamic similarity. From comparison of eqns. (9) and (10) and eqns. (1) and (2), the basic requirement for dynamic similarity,
may be obtained. In another form
and finally from eqn. (5)
Density scaling requirements. The relation between physical characteristics of model and prototype can be obtained, as before, from eqns. (9) and (10) and eqns. (1 ) and (2). Thus
and
where z,,, is obtained from the boundary-layer wind tunnel, and z,, is an ap- propriate roughness length for local topography.
Kinematic similarity. The kinetic similarity is expressed in the form [6,12]
where UTER is the mean terminal velocity of the particle and u* the mean shear velocity.
It appears (Figs. 2 and 3 ) that the shear flow over the building causes an acceleration of the particles, while particles trapped in the reattachment bub- ble are decelerated. The mean velocity U, at the separation point and the mean shear stress uit; at the model height are influential parameters. Thus the flow- ing relations apply for kinematic scaling:
These relations imply that the corresponding angles between the stream- lines and paths (or waves) remain the same over model and full-scale buildings. 2.3. Time scaling
All stages of deposition in full and model scales are similar if the time scale is chosen properly. Newton's second law in non-dimensional form provides an adequate time scale for fully rough flow, with air as the medium in model and prototype (Appendix B ):
The factor of d,/dp in eqn. (22) implies that drift profiles will be identical in model and field studies.
The micro scale of the solid particle (eqn. (14) ), the physical relationship described in eqn. (19) and the time law (eqn. (22) ) were all used as described in the following section, to choose the modelling particles and time scaling. Time scaling is required to predict final profile dimensions of drifts and pro- vides information on drift evolution. Indeed the wind tunnel experiments in the following section are solely concerned with simulating drift geometry.
3. Wind tunnel measurements
3.1. Choice of modelling particles
Three types of particles - Ottawa sand, ground foam and sawdust - were examined for simulating snow drifting in the wind tunnel. Of these, sawdust passing a 0.297 mm mesh sieve and collected on a 0.250 mm sieve (average 0.274 mm characteristic dimension) was used in the model studies.
The ratio of sawdust to snow densitypm/pp was taken to be 0.8 for the Ottawa area, (although snow density can vary enormously), and the ratio of charac- teristic dimension of the sawdust particles to snow particles was dm/& = 0.2741 0.8. Further, the characteristic length ratio, equal to the roughness ratio, is lm/
6
=z0,/zOp = 151750 = 1/50. Substitution in eqn. (19) gives:Equation (19) is thus not fully satisfied.
Because of the considerable variability of real snow and the assumptions made in the development of the equations, the sawdust was nevertheless con- sidered acceptable. Sawdust with a larger particle size should probably have
been used. The time scaling was (eqn. (22) ):
Using the sawdust as described, a run time of 5 min in the wind tunnel is equivalent to just over 2 h of wind at full scale.
3.2. Experimental set-up
3.2.1. Environmental wind tunnel
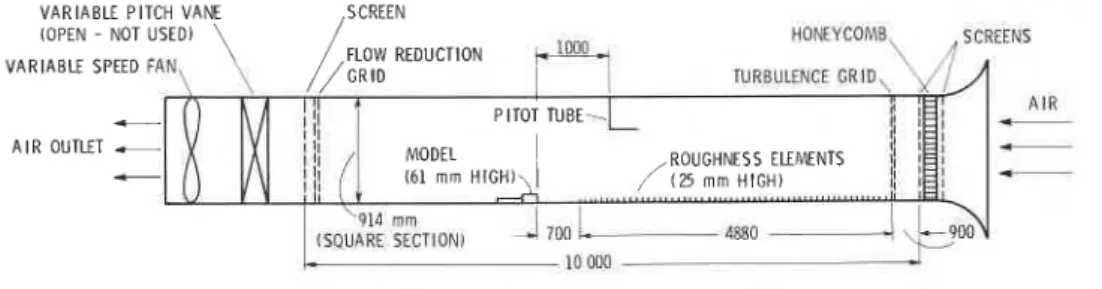
The experiments reported here were performed in a 10 m long, 0.914 m
x
0.914m open-circuit wind tunnel (Fig. 4). The width of the working section re- stricted testing of a full range of wind directions /3 for long models. The free- stream turbulence level was approximately 0.6% in the empty working section. To establish mean velocity profiles and turbulence characteristics in good agreement with those of urban areas, surface roughness elements and a tur-
bulence grid [13] were used. The power-law exponent a of the velocity profile
obtained was 0.38; the roughness length z0 was 15 mm, and the mean shear
velocity u* was 0.26 m s-l. Variation of the longitudinal turbulence intensity based on the local mean velocity is illustrated in Fig. 5. The thickness of the boundary layer was 430 mm.
3.2.2. Traversing mechanism
A traversing mechanism capable of moving in three directions was mounted inside the low-speed test section after each experiment (see Fig. 6 ) . All three
VARIABLE PITCH VANE ,SCREEN (OPEN - NOT USED) \ / VARIABLE S
PITOT
TUBE-L
nlnA I R OUTLET
-
MODEL1
ROUGHNESS ELEMENTS/ ( 2 5 m m HIGH)
A l l dimensions i n mm Not to scale
1 . 2 I I I I I 1 I 1 . 0
-
8
- 0 . 8-
\
-2
0 . 6-
"\
-
0 . 4-
0 . 2 - \ O --
s,
0 I I I I I 0 0. 1 0. 2 0. 3 0. 4 0. 5 0. 6 - ("2)1'2/u
Fig. 5. Longitudinal component of turbulence intensity distribution at the model location.
directions of motion are controlled manually to obtain depths of sawdust to within 0.05 mm at predetermined locations on the roofs after each test. 3.3. Testing procedure
Definition of some terms is required. "First fall" applies to snowfall accom- panied by winds of about 0.60 m s-' at the model height (or 4.25 m s-' in full scale). "First drifting" applies to wind at 2.4 m s-l (17 m s-l full scale) with- out snowfall. Snowstorm effects are therefore identified by "first drifting, first fall" and "second drifting, first fall" etc. The ratio between model and full scale velocities are obtained from eqns. (16) and (17). Thus
In earlier experiments, particles were distributed to a uniform depth on the upper roof before the wind tunnel was turned on. This effectively increased the height of the building. Moreover the particles "smoothed" the leading edge and modified the characteristics of the reattachment bubble. As a result, this approach was abandoned and a two-step approach to testing was adopted. Dur- ing the first step the particles were fed slowly through a slot in the roof of the tunnel 0.65 m upstream of the model while a light wind was blowing. This continued for 15 min, equivalent to a snowstorm of about 6.5 h. The free stream dynamic pressure at a height of 0.650 m above the tunnel floor and 1.0 m up- stream of the model location was maintained at a constant value indicating a
velocity of 0.91 m s
-'.
The corresponding velocity at the model height mea-sured by a hot wire anemometer was 0.60 m s-l, equivalent to 4.25 m s-' in full scale. During the second step a stronger wind of 2.4 m s-l at the model height blew for about 5 min, simulating a windstorm of approximately 2 h. It redistributed the particles from the upper (windward) to the lower (leeward) roof in drifts like those formed in a real storm [6,7,14].
3.4. Wind tunnel results
The results of the experiments using sawdust as described in section 3.1 are presented in Figs. 7-13. h,/AH and l,/AH are plotted against the aspect ratio
L / H (Fig. 11) and building separation ratio S/H (Fig. 13). The drift on the
lower of a two-level flat roof is seen to vary with the wind direction and the aspect ratio L/H of the upper building (Figs. 9 and l o ) , and with the difference
in elevation AH between the upper and lower roofs. H a n d
L
are the height andlength of the building, and
h,
and 1, are the height and length of the drift onthe lower roof (Figs. 7-13 )
.
3.4.1. Estimate of the drift height h,
I I I I I I - SAWDUST - - - - I I I I I
Fig. 7. Drift height as a function of wind direction P and aspect ratio of the upper roof, when
AHIH=0.5.
Figure 7 shows that the drift height varied with wind direction and aspect
ratio of the main building. The maximum height (h, = 0.94 AH) was observed
at L / H = 3 with
P=
30". A change in the wind direction strongly affected thedrift shape in the near-wake of the model in which L / H = 3 (Fig. 7 ) . However, the effect of wind direction was less spectacular for other models. From Fig. 7 it appears that h, was not a function of the angle of incidence when L / H = 5 and P 2 15". This may indicate that the nature of flow in the recirculation
region is stationary at angles of incidence between 15 " and 45
"
.
When L / H = 5,the length of roof beyond the reattachment point is sufficient to start the re- development of a new boundary layer. For values of L / H 2 5 , the new boundary layer grows thicker with distance downstream. At the "step" the greater thick-. ness allows a greater depth of snow to accumulate. This depends to some extent
on
P.
For buildings with L / H 2 5, Fig. 7 shows that the sawdust accumulation has
not reached the height of the upper roof - its maximum depth was only 0.54
AH.
As noted previously, the width of the wind tunnel did not allow the use of1 I SAWDUST
I
p : W I N D D I R E C T I O N
I
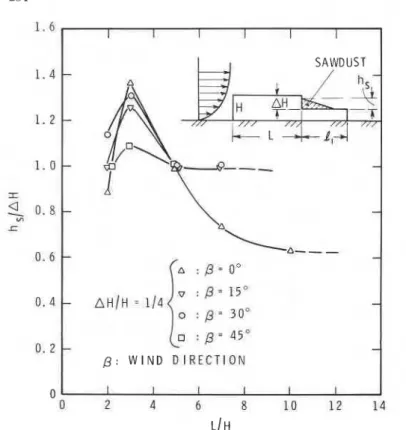
Fig. 8. Drift height as a function of wind direction P and aspect ratio of the upper roof, when AHIH= 0.25.
Case II: M / H = 114.
Figure 8 shows that for long roofs ( L I H 2 5) with low values of A H there
was no difference between the drift profiles obtained for all wind directions
except
/?=
0'. With a decrease in AH12 to H/4, the vortex formation movedvertically upwards and the space between the upper and lower roofs was more
rapidly filled with particles. The critical L / H ratio was 3 and the maximum
h,
was observed at
/?=
0". In water tunnel tests, the size of this vortex formationappeared to be greater than AH and could therefore result in
h,
being higherthan AH as shown in Fig. 8.
3.4.2. Estimate of the
drift
length 1,The reattachment length of the lower roof, which is the horizontal distance between the trailing edge of the upper roof and the point of reattachment on
the lower roof, can be obtained by analysis of shear stress profiles [15].
The maximum length of a drift on the lower roof is probably directly related to the reattachment length, as snow deposited downstream of the reattach- ment point would be carried away by the increasing speed of the shear layer.
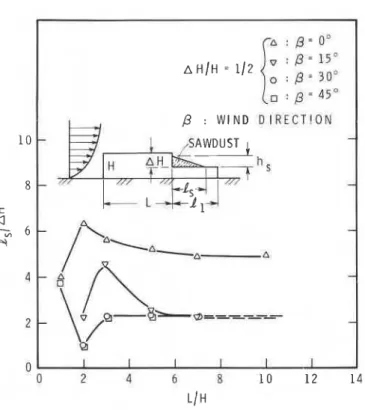
Fig. 9. Length of drift on lower roof as a function of wind direction P and aspect ratio of the upper roof when AHIH=0.5
Case I: AH/H= 112.
The length of drift on the lower roof is plotted in Fig. 9 against the aspect ratio L / H of the upper building. At
P=
0" and L / H = 2,1, is 6.4 AH but changes quite rapidly as the angle of incidence changes. As the aspect ratio L / H of the upper building is increased, 1, tends to reach a constant value of about 5 AHwhen
p=
0°, but drops to approximately 2 AH as shown in Fig. 9 for values ofp
equal to 15 " ,30° and 45"
.
Also the flow behaviour behind the upper building is only weakly affected by an increase in the angle of incidence for values of , L I H 2 5 . For most design situations the National Building Code of Canadarecommends that 1, be 2 AH, which is in good agreement only with tunnel results for
p 2
15" and L / H 2 5. O'Rourke et al. [16] found from field data for many types of buildings and many AH/H ratios that ZJAH was often greater than 2 AH. Their paper does not give enough information to allow actual drift lengths to be determined. Taylor's [ 1 4 ] data indicated, however, that 2 AH was adequate for long buildings with AH/H of about 0.5 and lower roofs less than 5 AH in length.Case II: AH/H= 114.
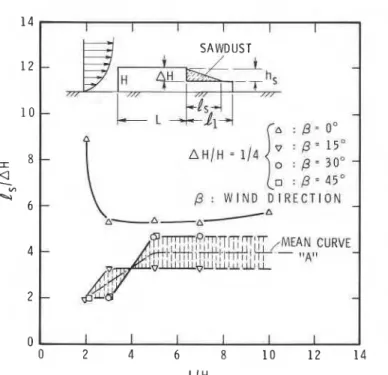
236 1 4 I I I 1 I I SAWDUST 1 0 - - I 8 - Q
.
w ar 6 - p : W I N D D I R E C T I O N - &-5-A-a 4 2 0 - - - - I I I I I I 0 2 4 6 8 1 0 1 2 1 4 L I HFig. 10. Length of drift on lower roof as a function of wind directionpand aspect ratio of the upper roof when AH/H=0.25.
1 2 1 0 I 8
.
w -4 -- 6-
I I 1 I I 1-
+
SAWDUST-
--- [H+A,,
--7
4
h s ///-
l s / A H : a . r-
& / H : 0,.-
I I - 4 --.- w -4 \-
I-.----
A HIH = 114 0 2 4 6 8 1 0 1 2 1 4ell
Fig. 11. Effects of lower roof length 1, on length of drift on lower roof 1, when L / H = 10.0, p=Oo.
2 0 /
-
,.
I.
-
.;*O-O-~----
L--- I I I I I IP
-
m P-
0- r 4-
=
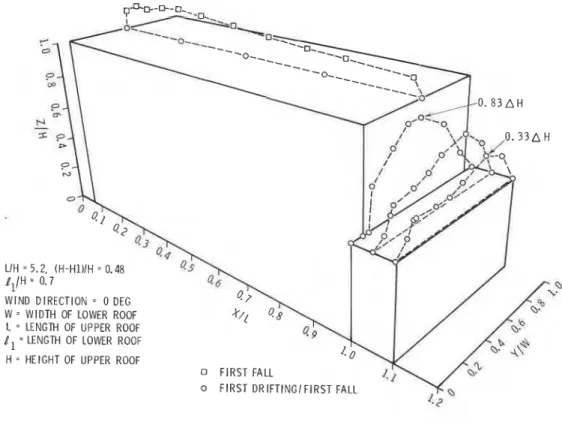
P- LIH = 5.2, (H-H1)IH = 0.48 Jl/H = 0.7WIND DIRECTIOh = 0 DEG W = WIDTH OF LOWER ROOF
L = LENGTH OF UPPER ROOF el = LENGTH OF LOWER ROOF H = HEIGHT OF UPPER ROOF
FIRST FALL
0 FIRST D R l F T l N G l F l R S T FALL
Fig. 12. Drift shape on a long model ( L / H = 10) with a short lower roof 1,/H=0.7
Fig. 13. Effect on drift height h, of a gap between the upper and lower buildings. The effect is the same for AH/H=0.25 and 0.50.
3 . 3 M to 4.7AH (Fig. 10). For short models, L/H=3, with P=30° and L/H> 5, the drift length tends asymptotically to 4.7 AH. In terms of loads this could be a significant difference from the results obtained when M / H = 0.5
(Fig. 9).
The drift lengths obtained during the testing were in good agreement with most of the observations summarized by Eaton and Johnston [15] for condi- tions when
p
was O 0 and when the free-stream turbulence was less than 1%.Figures 9 and 10 reveal that, for models with L / H 2 3 and /3= 30" and 45", the nature of the recirculation in the near-wake is independent of the aspect ratio L/H. When L / H I 3, the free stream turbulence will cause an earlier reat- tachment of the flow and will move the centre of the reattachment bubble upstream towards the leading edge [17].
3.4.3. Effect of lower roof length on the length of drift for a long model (L/ H=10)
The length of the lower roof is 1,. Figure 11 shows that for 1,/H between 2 and 5, the drift length 1, decreases with an increase in
AHIH.
For a long lower roof (1,/H2 5 ) , the drift length is independent of 1, as shown in Fig. 11, prob- ably because the maximum shear stress within the shear layer decreases rap- idly downstream of the reattachment point [18]. For a short lower roof on the other hand ( (1,/H=0.7) as shown in Fig. 12), the contact between the trailing edge of the lower roof and the shear layer from the trailing edge of the upper roof forces the vortices to form very close to the back face of the upper building. The depth profile on the lower roof in Fig. 12 whenP=OO
is strong evidence of the large change in turbulence structure which occurs when the shear layer encounters the trailing edge of a short lower roof.3.4.4. Effect of a gap between high and low buildings
When a gap
S
is introduced between a windward and leeward building, the height of the drift on the lower roof is reduced (Fig. 13). Figure 13 also shows that the non-dimensional gap widthS/H
strongly affects the drift height h, on the lower roof. The kinetic energy of flow in the passage is increased due to the additional energy from flow along the sides of the building and the strength ofthe vortex system in the near-wake is reduced. a
This results in an increased flow velocity near the lower roof and conse- quently a reduction in the deposition of particles there.
For gaps ranging from 0.25H to 0.50H (Fig. 13), the height of drifts is in- dependent of the gap width. This suggests that the structure of the flow in the passage is stable and remains the same for this range of gap widths. The oc- currence of a stationary vortex is probably the dominant phenomenon [19].
For S I H 2 5 , an increase in the gap width was accompanied by a large de- crease in the drift size. Indeed, no drift was formed on the lower roof when S/H was greater than 0.75.
3.4.5. Effects of wind velocities and snowfall o n drift formation
Figure 14 ( a ) presents profiles of sawdust accumulation on a model building
with L / H = 7.0 and
P=
30". The aspect ratio of the lower roof was l,/H= 3.25.The effects of strong perturbations in the flow resulted in the leeward half of
the upper roof being almost bare. As a result the maximum drift height h,
,
,
,
is about 0.5AH in the near-wake of the upper building.
The effect of more than one snowstorm is shown in Fig. 14(b). After the "second fall? the drift behind the upper building had a maximum height of
about 0.5AH. With increased wind speed, this height increased to AH. The
profile of the sawdust accumulation on the upper roof indicates that when
P=
30°, the flow is split into two vortex streets which scour away the snow.The next section compares experimental results with full-scale measure- ments on two buildings in Ottawa, Canada.
4. Comparison with field data
4.1. Introduction
The two buildings modelled, PWC and Ottawa Sufferance, are shown in Fig. 15 with their correct orientations and dimensions [14]. A heavy drift on Ot- tawa Sufferance is illustrated in Fig. 16. The roofs are in an industrial area of similar buildings of about the same height. The space between buildings is generally 45 m or more on each long side although there is a large warehouse
parallel to the long side of the PWC building and 15 m away on the north side.
To the south-west of the PWC building there are houses 400 m away while
buildings to the ENE of Ottawa Sufferance are more than 500 m distant. The
terrain is flat with the occasional tree no higher than the buildings. This is unusually open terrain upstream which satisfies the conditions in eqn. (3) and Section 3.2.1.
Figure 17 illustrates the variation of the maximum drift load from year to year and shows that during short surveys major peaks could be missed entirely. For example, for a period of four years from 1974 to 1977 the maximum drift load on Ottawa Sufferance was less than 55% of the maximum measured dur- ing a period of 10 years. Thus field surveys should be conducted over long periods (usually at least ten years). As such surveys are expensive, it is clear that an effective modelling technique would save a lot of time and money if it reduced the need for such surveys.
4.2. Comparison of drifts o n full-size and model buildings
Because the models were too long to be rotated fully in the tunnel, it was important to search the meteorological records for snowstorms with winds blowing in the same direction as those modelled in the wind tunnel. Further snowstorms that occurred early in Ottawa winters and deposited large drifts
I
W = WIDTH OF ROOF o FIRST FALL
H = HEIGHT OF UPPER ROOF A FIRST D R l F T l N G l F l R S T FALL
H 1 = HEIGHT OF LOWER ROOF o SECOND D R l F T l N G l F l R S T FALL
NOT TO SCALE
(a)
LIH = 7, (H-H1)IH = 0.5 l l l H = 3.25
WIND DIRECTION = 30 DEG
L = LENGTH OF UPPER ROOF
.j, = LENGTH OF LOWER ROOF
--
W = WIDTH OF ROOF 0 SECOND FALL
H = HEIGHT OF UPPER ROOF
H 1 = HEIGHT OF LOWER ROOF 6 FIRST DRlFTlNGlSECOND FALL
NOT TO SCALE 0 SECOND DRIFTING1 SECOND FALL
L/H = 5 . 2 PWC -- I I I H = 7.01 rn a H ~ 6 . 7 1 rn 1.5
Fig. 15. Plan view of buildings showing sizes and orientations to true north. I t should be noted that the scales are different from building to building. AH is the difference in elevation between the upper and lower flat roofs.
Fig. 16. Large "triangular" drift in the lee of the upper roof of Ottawa Sufferance, mid-January 1978 ( A H / H = 0 . 4 8 ) .
on roofs completely bare prior to the storms would have been ideal. This sel- dom occurred.
Y E A R
Fig. 17. Variation of the annual maximum drift load on two two-level flat roofs in Ottawa.
The model of this building was tested at an angle of attack
P=
0". On the full- size building this corresponded to winds from the ENE. On four occasions large drifts were deposited but the conditions did not correspond to the ideal situa- tion. Indeed the measurements (Fig. 18) and photograph taken on 23 January 1978 (Fig. 16) followed a succession of snowfalls almost daily from mid-No- vember with winds from all directions, although a good number were from the ENE. In December 1977 there were four major snowfalls: 18.0 cm on the 6th with average ENE winds at 27.6 km h-'; 21.6 cm on the 9th with east winds at 28.2 km h-'; 12.8 cm on the 14th with ENE winds at 16.1 km h-'; 30.4 cm on the 21st with ENE winds averaging 21.3 km h-l. Temperatures were below zero throughout this period. The last two events were on 8 January when 10.0O T T A W A S U F F E R A N C E
FIELD MEASUREMENTS
D I S T A N C E F R O M W A L L , X I L
Fig. 18. Non-dimensional profiles of heights and lengths of drifts measured on the centre-line CL
of the lower roof.
cm fell at temperatures between
+
2.0 and - 11.0" C with average winds of 14.1 km h-l East, and on 18 January when 10.2 cm fell at temperatures between -5.7 and - 15.4"C with average winds of 19.8 km h-l NNE.The other three profiles in Fig. 18 were observed: (1) after a snowstorm of 30 cm on 23 February 1971 (highest temperature -3.9"C) with the readings taken on the 25th (temperature between - 10°C and 0°C); (2) following a snowstorm on 3 and 4 February 1972 (highest temperature -3.3"C) with readings on 7 February (temperature between - 3.3 and - 23.3 "C overall); (3) after a snowstorm on 21 January 1979 (highest temperature -4.4"C) with readings taken on the 23rd (temperature between - 4.4 and - 14.4" C overall). The dashed line in Fig. 18, presenting the model results, is similar to the profiles of depths measured along the building centre-line during the four storms, although the depth would increase or decrease depending on the com- binations of snowfall and winds used during testing. It is important to note that these depth measurements were occasionally exceeded by profiles at other locations after storms in which
P#
0".The PWC building (L/H= 7.6, AH/H = 0.30).
The direction of winds blowing down the centreline of this building is WSW.
As the model was small enough to rotate 15" in the tunnel, the influence of a 15" shift in wind direction could be studied. It is clear from the dashed lines in Fig. 19 that varyingp from 0" to 15" makes a significant difference in the depth
I 244 P W C - B U I L D I N G FIELD MEASUREMENTS I 0 0 . 0 2 0 . 0 4 0 . 0 6 0 . 0 8 0 . 1 0 0 . 1 2 0 . 1 4 0 . 1 6 D I S T A N C E F R O M W A L L , X I L
Fig. 19. Non-dimensional profiles of the heights and lengths of drifts measured on the centre-line
CL and at the side of the lower roof.
profiles at the centreline of the model. At the full-size building the natural wind would not cooperate.
/3
varied enormously during storms. As there was a large flat-roofed building about 5 m higher and 15 m to the north and parallel to the PWC building, winds blowing from the north-west passed over some portion of it before arriving over the PWC building. The buildings were too large for both to be modelled together in the tunnel.The snowfall in the winter of 1970-1971 was very heavy with 111 cm falling in December, 76.5 cm in January and 157.5 cm in February up to the 25th. On 13 February 1971, 32 cm of snow fell accompanied by winds averaging 26 km h-l from the NNW. On the 14th, winds at 22-40 km h-l blew from the west for 13 h and on the 15th a t 5-18 km h-l from the west, south-west and WSW
for 11 h. The resulting snow load profile at the side of the roof compares fa- , vourably with that for
/3=
15" a t the side of the model except near the wallwhere strong axial vortices are likely to affect the drifting.
.
A profile of snow depths recorded a t the centre-line of the roof on 13 January1977 is also plotted in Fig. 19. On 10 January, 23.2 cm of snow fell accompanied by strong wind averaging 27.8 km h-l ( E N E ) and gusting to 46.3 km h-'
(ENE). This wind blew in a direction 180" from that expected to give the maximum drift on the roof. During 11 and 12 January, however, another 2.4 cm fell with winds from the west averaging 11-20 km h-l. Although the re- sulting snowdrift was deep a t the wall, it dropped away very steeply, its slope more resembling the model prediction for
/3=
15 " than for /3= 0".cm of snow. Although the wind was mostly from the south while the snow fell,
on the 7th and 8th the wind was largely from the west
(P=
22.5" ) averagingabout 19 km hkl, and on the 9th it came from the east and south at only 8.5 km h-l. The depth profile recorded at the centre-line of the roof is also shown in Fig. 19. The snow depths exceed those recorded on the model by a large amount near the wall but farther away, snow depths are considerably less than those indicated by the model.
It is apparent that although some of the drifts measured on the PWC build- ing resemble in shape some of those obtained in the tunnel, the time variability of wind direction resulting in high drifts was too complex to be modelled in the tunnel used.
a
5. Summary and conclusions
Modelling criteria were developed to select a suitable particle to simulate the heights and lengths of snow drifts on roofs. Visualization of the flow process in a water tunnel led to the observation that the vortex system on the roof surface throws up the modelling particles in clouds. Comparison of wind tunnel measurements with field observations leads to the following conclusions.
1. Turbulent transport of snow along an upper roof is the main mechanism
for drift formation in its near-wake. Such transport is strongly affected by changes in the after-body length. Results from the wind indicate that the maxi- mum drift occurs when the length of the upper roof is about three times its height.
2. The wind tunnel testing also indicates that the height and length of drifts depend primarily on the behaviour of the separated flow over the upper roof. The maximum height could be as much as 40% greater than the difference in
elevation, M between the upper and lower roofs when this difference is rela-
tively low ( M / H x 0.25) and when the angle of attack
P
is constant at 0".3. The introduction of a gap between a windward and leeward building re-
sults in a reduction in the deposition of particles on the lower roof due to in-
* creased flow velocity near the lower roof. Model tests indicate that for a gap
greater than 75% of the upper roof height, no drift forms on the lower roof. There are no field data to confirm this.
, 4. There are similarities between the geometry of snowdrifts on roofs mo-
delled in the wind tunnel and those on full-size buildings. Some of the differ- ences in drift height and shape were due to the time variations in wind direc- tion outdoors, variations that could not be simulated in the tunnel.
5. Some discrepancies between model and full scale arise because a wind tunnel can only model aerodynamic effects and also because the upstream ge- ometry was not modelled exactly in the wind tunnel. It cannot account for the influence of heat loss, solar radiation, changes in humidity, air temperatures and rainfall. These all affect snow density, scouring and drifting.
Acknowledgements
The authors are grateful for advice and support from W.A. Dalgliesh and for the assistance of J.D. Atkins and Yves Grenier with the wind tunnel testing and P.J. Daly with the field measurements of snow depths and densities. They would also like to acknowledge the use of the wind tunnel facility at the hy- draulics laboratory of the Division of Mechanical Engineering, NRC, and the willing cooperation of Dr. Bruce Pratte. They are grateful for the advice of
R.L. Wardlaw and for the loan of equipment from the Low Speed Aerodyn- i
amics Section of the National Aeronautical Establishment, NRC.
This paper is a contribution from the Institute for Research in Construction, National Research Council of Canada. Copyright in the paper belongs to the Crown in right of Canada, i.e. to the Government of Canada.
References
G.H. Strom, G.R. Kelly, E.L. Keitz and R.F. Weiss, Scale model studies on snow drifting, Res. Report No. 73 (U.S. Army, Snow, Ice and Permafrost Research Establishment, Hano- ver, N H ) , September 1962,50 pages.
R.A. Bagnold, The Physics of Blown Sand and Desert Dunes, Methuen, London, 1954,265 pages.
E.A. Finney, Snow drift control by highway design; results of wind tunnel investigations interpreted, Roads Streets, 83 (3) (1940) 45-48.
J.D. Iversen, Drifting snow similitude: drift deposit rate correlation, Proc. 5th Int. Conf. on Wind Engineering, July 8-14 1979, Fort Collins, CO, pp. 1035-1047.
D. Kobayashi, Studies on snow transport in low-level drifting snow, Institute of Low Tem- perature Science, Hokkaido University, Japan, Series A, No. 24, 1972, pp. 1-58.
N. Isyumov, An approach to the prediction of snow loads, Ph.D. Thesis, University of West- ern Ontario, London, Ont., Research Report BLWT-9-71,1971,534 pages.
J.S. de Krasinski and W. Anson, The study of snow drifts around the Canada Building in Calgary, Report No. 71, October 1975, University of Calgary, Dept. Mechanical Engineering. J.S. de Krasinski and T. Szuster, Some fundamental aspects of laboratory simulation of snow or sand drifts near obstacles, Report No. 151,1979 (University of Calgary, Dept. Mechanical Engineering).
T. Szuster and J.S. de Krasinski, Experimental methods and techniques related to laboratory *
study of snow drift formation near obstacles on the ground, Report No. 154,1980 (University
of Calgary, Dept. Mechanical Engineering).
..
A.K. Dyunim, Vertical Distribution of Solid Flux in a Snow-Wind Flow. Technical Trans- , lation 999, National Research Council of Canada, 1961,16 pages (translated into English by
G. Belkov).
M. Jensen and N. Franck, Model-Scale Tests in Turbulent Wind, Part I, The Danish Tech- nical Press, Copenhagen, 1963,96 pages.
R.J. Kind, A Critical Examination of the Requirements for Model Simulation of Wind-In- duced Ground-Drift or Erosion Phenomena in Wind Tunnels with Particular Emphasis on Snow Drifting, LTR-LA-167, August 1974 (National Research Council of Canada, National Aeronautical Establishment).
N.J. Cook, Wind tunnel simulation of the adiabatic atmospheric boundary layer by rough- ness, barrier and mixing-device methods, J . Ind. Aerodyn., 3 (1978) 157-176.
14 D.A. Taylor, Snow loads on two-level flat roofs, Proc. Eastern Snow Conf. V29,41st Annu. Meet., Washington, DC June 7-8,1984, pp. 3-13. Also National Research Council of Canada, Division of Building Research, reprint No. NRCC 24905, Ottawa.
15 J.K. Eaton and J.P. Johnston, A review of research on subsonic turbulent flow reattachment, AIAA J. 19(9) (1981) 1093-1100.
16 M.J. O'Rourke, R.S. Speck and U. Stiefel, Drift snow loads on multilevel roofs, Proc. Eastern Snow Conf. V29,41st Annu. Meet., Washington, DC, June 7-8 1984, pp. 14-25. Also ASCE
J. Constr. Div., 111, (2) (1985) 290-306.
17 F. da Matha Sant'Anna, Contribution & la comprbhension de l'bcoulement autour des corps prismatiques A. section rectangulaire. These de doctorat (Ph.D.), Universitb de Sherbrooke, Quebec, January 1983.
18 P. Bradshaw and F.Y.F. Wong, The reattachment and relaxation of a turbulent shear layer, J . Fluid Mech., 52 (1) (1972) 113-135.
19 A. Diemling, I. Kronke, F. Schramke and H. Sockel, Wind-induced vibrations of a facade element, J. WindEng. Ind. Aerodyn., 11 (1983) 133-148.
Appendix A: Derivation of equations 9 and 10
The governing equations of motion for a particle are:
where subscript m represents the model scale. Equations ( A l ) and (A2) are
identical with eqns. 7 and 8.
For similarity conditions, eqn. 5 gives:
In addition, acceleration of the particle in non-dimensional terms can be derived as follows
from eqn. 5:
The term in brackets is also expressed as a function of non-dimensional parameters
The right terms are products of three quantities and eqn. 5 gives
a1 1
---
and - = Uaim
-azm-
i
a1Then
From eqn. (A5),
The term
i
ail81 has the same units asih, and it is assumed that this term is
equivalent to
Z:
Thus..
0 2 . ."
=Tl (A12)Similarly,
The various non-dimensional parameters are introduced in eqns. ( A l ) and (A2) to obtain:
Appendix B: Derivation of time scaling
Governing equations use Newton's second law:
or
Ma=F+Mg
Equation (B2) in terms of x and y is:
di
-M-=D, and d9
dt -M-=D,,+Mg dt
where D, and D, are, respectively, drag along the x and y directions. The ver-
tical velocity component of the fluid is zero (i.e. D,= 0)
,
thusNow
and drag
Dr =
1
CD, nr 2 p f i 2where p is the particle density, d is the particle characteristic diameter, pf is
the fluid density, and CD, represents the drag coefficient along the x direction.
The governing equation of particle movement is:
Then
Equation (B6) is a simple form of the general form of particle movement in
air. Similarly for a model particle,
Various non-dimensional parameters have been defined in Appendix A:
-
Pm = PP dm = Jd
X,
=Ui
(B8)- - Pfm = PfPf t m = t t (CD,),=CD, CLL From eqn. (B7):
From comparison of eqns. (B6) and (B10) one can write:
0
- Ip = d = l
t (B11)
cD,fif12=1
Time scaling will be given by eqn. (B11). Then,
~m dm i m tm
--- -
p d i t
If p, d, i and t are associated with the prototype particle (in full-scale), then:
with
1/2
(see eqn. (15) )
In terms of zo, and z,, (roughness length)
This paper is being distributed in reprint form by the Institute for Research in Construction. A list of building practice and research publications available from the Institute may be obtained by writing to Publications Section, Institute for Research in Construction, National Research Council of Canada, Ottawa, Ontario, KIA 0R6.
Ce document est distribuC sous fome de tir6-b-part par 1'Institut de recherche en construction. On peut obtenir une liste des publications de 1'Institut portant sur les techniques ou les recherches en matiere de Mtiment en ecrivant b la Section des publications, Institut de recherche en construction, Conseil national de recherches du Canada, Ottawa (Ontario), KIA 0R6.