HAL Id: hal-01873794
https://hal.archives-ouvertes.fr/hal-01873794
Submitted on 13 Sep 2018
HAL is a multi-disciplinary open access
archive for the deposit and dissemination of
sci-entific research documents, whether they are
pub-lished or not. The documents may come from
teaching and research institutions in France or
abroad, or from public or private research centers.
L’archive ouverte pluridisciplinaire HAL, est
destinée au dépôt et à la diffusion de documents
scientifiques de niveau recherche, publiés ou non,
émanant des établissements d’enseignement et de
recherche français ou étrangers, des laboratoires
publics ou privés.
Efficient Energy Sources Scheduling in Green Powered
Datacenters: A Cloudsim Implementation
Enida Sheme, Patricia Stolf, Georges da Costa, Jean-Marc Pierson, Neki
Frasheri
To cite this version:
Enida Sheme, Patricia Stolf, Georges da Costa, Jean-Marc Pierson, Neki Frasheri. Efficient Energy
Sources Scheduling in Green Powered Datacenters: A Cloudsim Implementation. 3rd International
Workshop on Sustainable Ultrascale Computing Systems (NESUS 2016), Oct 2016, Sofia, Bulgaria.
pp. 45-50. �hal-01873794�
O
pen
A
rchive
T
OULOUSE
A
rchive
O
uverte (
OATAO
)
OATAO is an open access repository that collects the work of Toulouse researchers and
makes it freely available over the web where possible.
This is an author-deposited version published in :
http://oatao.univ-toulouse.fr/
Eprints ID : 19036
The contribution was presented at NESUS 2016
To link to this article URL :
http://hdl.handle.net/10016/24231
To cite this version :
Sheme, Enida and Stolf, Patricia and Da Costa, Georges
and Pierson, Jean-Marc and Frasheri, Neki Efficient Energy Sources
Scheduling in Green Powered Datacenters: A Cloudsim Implementation.
(2016) In: 3rd International Workshop on Sustainable Ultrascale Computing
Systems (NESUS 2016), 6 October 2016 - 7 October 2016 (Sofia, Bulgaria).
Any correspondence concerning this service should be sent to the repository
administrator:
staff-oatao@listes-diff.inp-toulouse.fr
• •
Efficient Energy Sources Scheduling in
Green Powered Datacenters: A Cloudsim
Implementation
Enida Sheme†Patricia Stolf∗Georges Da Costa∗Jean-Marc Pierson∗Neki Frashëri†
Polytechnic University of Tirana, Albania† esheme@fti.edu.al, nfrasheri@fti.edu.al
University of Toulouse, France∗
patricia.stolf@irit.fr, Georges.Da-Costa@irit.fr, jean-marc.pierson@irit.fr
Abstract
In this paper we address the issue of managing different energy sources which supply green powered datacenters. The sources are scheduled based on a priority scheme, aiming to maximize the renewable energy utilization, minimize the energy used from the grid and optimize battery usage. Dynamic power capping technique is used to put a threshold on the drawn energy from the grid. The algorithm is implemented and tested in CloudSim simulator. Renewable energy is considered as solar energy. A workload scheduling algorithm is already implemented for higher renewable energy utilization. The results show that the proposed scheme is efficient and it is a promising direction in the field of the optimization in datacenters using renewable energy.
Keywordsgreen datacenter, renewable energy, grid energy, battery, priority scheme, dynamic power capping, simulator, CloudSim
I. Introduction
Recent studies have addressed the topic of using different sources of energy, mainly renewable one, to supply datacen-ters. As such, studying the energy sources engagement with resource scheduling has become one of the research direc-tives of this field. Some of the existing techniques take in consideration renewable energy only with batteries and/or grid as a backup. This approach has two disadvantages: first it is not realistic for the current conditions when grid is still the main source of energy in most of datacenters. Second, it requires high capacity of batteries to compensate energy needs in time periods when renewable energy is lacking. This means higher costs, longer charging time and higher environmental risks from battery pollution.
In our paper we propose a new prototype scheme for man-aging three sources of energy: renewable, grid and battery, following this priority level. The aim is to maximize renew-able energy utilization, minimize energy taken from the grid and optimize battery usage. Dynamic power capping tech-nique is used in order to limit the grid power used to supply the datacenter. The proposed algorithm is evaluated through simulations.
The paper is organized as follows. Section II describes the energy context where the new sources scheduling algorithm
is studied: the energy consumption of a chosen datacenter and the renewable energy used to supply it. At section III the proposed scheduling scheme is introduced and its im-plementation in CloudSim simulator is illustrated. Another workload scheduling algorithm is integrated in the simula-tor, being described at section III.2 . Section IV illustrates the conducted experiments and the results of implement-ing the proposed priority scheme. The paper finalizes with conclusions at section V .
II. Energy Consumption and Renewable Energy
In this section we evaluate the energy consumption of a datacenter running a given workload, describing datacenter parameters and workload characteristics. The available re-newable energy is explored and presented as well, based on real weather data in Tirana, Albania.
II.1 Energy Consumption
The energy consumption is evaluated in a simulator environ-ment, running a chosen workload over a specific datacenter. The datacenter size is chosen based on similar experimental studies in the field of energy efficiency in datacenters. Data-center represents the processing entity in our system. It runs
the workload and consumes energy, which we track during 24 hours of simulations. Datacenter parameters are chosen based on similar experimental studies in the field of energy consumption in datacenters and typical datacenter size in Albania. To run the simulation we configured the number of hosts equal to 100 and the number of virtual machines run-ning over hosts equal to 200. This means, 2 virtual machines run in every host. The host model is HP ProLiant ML110 G5, Xeon 3075 , processing capacity 2660 MHz, 2 cores and RAM of 4GB. The workload chosen to run the experiments repre-sent a synthetic reproduction of a Google workload, scaled over our own simulating datacenter parameters. A Google trace file was published in 2011, giving detailed information of 12.000 Google servers traffic over 29 days, processing var-ious types of applications. This workload data are studied in order to know its characteristics. The main findings of studies [1], [2], are used in our workload in order to produce patterns that resemble to the Google workload.
Figure 1: Energy consumption over 24 hours of simulation.
As such, we configure the following workload parameters for our study: total number of jobs, their length, deadline, resource requirements and inter-arrival time. The chosen number of jobs is 400, where 200 of them are short, 150 are medium and 50 are long. The length of short jobs varies from 5 to 7 minutes, medium jobs from 25 to 50 minutes and long jobs from 100 to 300 minutes. The jobs length is generated through Poisson distribution. Deadline is another parameter we set, which is the limit of time it can pass till the job is fully completed. Based on bibliography [1], [2], we categorize jobs into three types of deadline: loose, medium and urgent. 130 of short jobs have loose deadline, which means they are tolerant to be postponed for running in a later moment, 50 of short jobs have medium deadline and 20 are urgent. Out of 150 medium length jobs, 100 of them have loose deadline and 50 have medium deadline. Meanwhile, all long jobs have loose deadline. Loose, medium and urgent deadline is set in proportion to the length of jobs. Regarding
resource requirements, half of short jobs require an average of 25% of CPU usage and other half requires 50% of CPU. 50 out of 150 medium jobs require 25% CPU and 100 of them need an average of 50% CPU. While long jobs need to use an average of 80% CPU. The inter-arrival time is set to every 7 minutes for short jobs, every 10 minutes for medium length jobs and every 30 minutes for long jobs.
The energy consumed by the datacenter running the de-scribed workload over 24 hours time of simulation is evalu-ated through CloudSim simulator. The total value of energy consumption is 120 kWh and its distribution through time is shown in figure 1 .
II.2 Renewable Energy
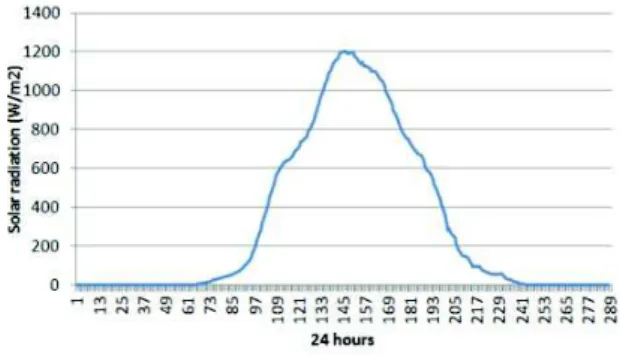
In our study, we used solar energy to represent renewable energy. A. Maraj presents a study regarding solar energy in Tirana [3]. We acquire the solar energy data from the results of this study. The parameters are provided from the database built through the utilization of a data collecting system, which is installed on behalf of the Department of Energy, Faculty of Mechanical Engineering, Polytechnic Uni-versity of Tirana. Solar power irradiance on a 45 degrees tilted 1 squared meter solar panel, installed over the terrace of the central building of this University, has been collected, providing data for every 5 minutes of its daily operation. We consider a typical clear summer day as input for renewable energy in our experiments. The specific date is July 16, 2010. Further details on solar panel specifications and results of the study are explained in the article [3]. The solar irradiance over 24 hours of a typical summer day in Tirana is shown in figure 2 .
• •
III. Energy Sources Scheduling Scheme
In this section, we describe the working platform, CloudSim simulator, and a workload scheduling algorithm already im-plemented aiming to maximize the utilization of available renewable energy. We further present the analysis and im-plementation of the energy sources scheduling algorithm, which is the new prototype scheme we propose in this pa-per. A detailed explanation of how this algorithm works is described at section III.3 .
III.1 CloudSim Simulator
CloudSim is an extensible simulation toolkit that enables modeling and simulation of Cloud computing systems and application provisioning environments [4]. The CloudSim toolkit supports both system and behavior modeling of Cloud system components such as datacenters, virtual ma-chines (VMs) and resource provisioning policies. Its main functional entities include:
• Hosts: physical machines where the jobs are to be exe-cuted.
• Virtual machines: virtual entities running over real phys-ical entities.
• Cloudlets: representing the workload or the jobs to be executed in the datacenter.
• Broker: a scheduler which allocates virtual machines to hosts and cloudlets to virtual machines.
CloudSim is chosen as a simulator because of its high rate in reviews of the energy efficiency in datacenter field, 7 years among researchers and still being widely used, open source code and a rich forum of programmers and researchers. III.2 Workload Scheduling Algorithm
The algorithm already implemented in CloudSim regarding efficient workload scheduling aims higher leveraging of avail-able renewavail-able energy. The main idea is to postpone non urgent jobs towards periods of time when renewable energy availability is higher. Equivalently, some jobs might be run urgently though they are not urgent in order to exploit cur-rent available renewable energy if this level is predicted to be decreasing in the near future. The steps of this algorithm are presented at figure 3 .
Basically, the code is divided in two sections, testing if the available renewable energy is increasing or decreasing. In each case, the behaviour will be different. After testing the urgency of the arrived job, the algorithm decides to run it
if it is urgent or postpone it if it is not urgent. The amount of time it will be postponed depends on renewable energy prediction and length of the job. If it is an increasing period, than short jobs are postponed with a time period equal to their length, medium jobs are postponed to medium time between arrival and start deadline time, while long jobs are postponed at their maximum allowed time, as long as it does not violate the desired quality of service. Otherwise, if it is a decreasing period, the behaviour will be contrary to the mentioned approach. Short jobs will be postponed at their maximum, as they require less processing resources, while the long jobs are immediately run in order to use the available solar energy, as figure 3 presents.
Figure 3: Workload scheduling algorithm.
The result of implementing this algorithm is illustrated in figure 4 . The energy consumption through 24 hours without using the workload scheduling algorithm is compared to the energy consumption after implementing this algorithm. The workload is intentionally modelled in higher intensity in the morning and in the evening to show the benefits of the algorithm. The results show 21% higher utilization of solar energy. More details on this algorithm can be found at article [5].
III.3 Energy Sources Scheduling Algorithm
The energy sources scheduling algorithm works in coopera-tion with the jobs scheduling algorithm described at seccoopera-tion III.2 . Both algorithms are implemented in CloudSim simula-tor.
Based on prior studies on the field [6], [7], [8], [9] only two sources of energy are used, according to a priority scheme
Figure 4: Energy consumption without and with implemented workload scheduling algorithm.
as given in Equation 1 .
Consum = RE + battery(+grid) (1) where Consum is the energy consumption of the datacen-ter, RE represents renewable energy, battery is the energy drawn from battery and grid represents energy taken from the grid. First priority is given to renewable energy source, and battery is mainly used as the second source, alternatively combining with grid energy. We evaluate this scheme as not yet realistic and not optimal. The main reason is because: if only grid is used as a backup, high amount of grid energy is needed during times when renewable energy is lacking. If only battery is used a backup, we cannot yet switch to no grid energy systems when nowadays grid energy serves as main source of energy supplier in almost 100% of electric and electronic equippments. Furthermore, we mention 4 drawbacks of batteries to argument why using battery as a second source is not a good choice:
• High capacity battery is needed to compensate required energy during periods when renewable energy is lack-ing. This means higher costs of using batteries. • Up to 30% of its produced energy is wasted due to
AC/DC convertion. • Batteries self - discharge.
• Batteries are toxic for the environment.
We propose a new priority scheduling scheme, where first priority is given to renewable energy, second priority to the grid energy, power capped dynamically, and third priority to the battery, as given in Equation 2 .
Consum = RE + gridcapped+ battery (2)
The proposed scheme uses three priority levels for the different sources of energy. The aim is to prioritize renewable energy usage, in order to maximize its utilization which is equivalent to minimizing its waste. First priority is given to available renewable energy. Second, power from the grid is used if energy consumption is greater than the available quantity of renewable energy. However, dynamic power capping, a well-known technique on energy efficiency [10], is applied to the grid energy aiming to limit the power taken from the grid. The dynamic power capping factor is based on the difference between energy consumption and renewable energy. Table 1 describes how the power capping factor is set based on combinations between 3 levels of renewable energy and 4 levels of energy consumption.
Consumption / Renewable 1 2 3
1 2 1 1
2 3 2 1
3 4 3 2
4 4 4 3
Table 1: Power capping factor value based on combinations of energy consumption and renewable energy levels.
Figure 5: Energy sources scheduling algorithm.
Available renewable energy, which we assume to be known, is divided into 3 levels: 0-33% of its maximum generated
• •
value belongs to level 1, 34%-66% of the maximum belongs to level 2 and 67% - 100% of the maximum belongs to level 3. Likewise, energy consumption, which we suppose it is known, is categorized into 4 levels: 1 means low energy consumption and 4 means very high energy consumption. The levels are set in segments of 0-25%, 26%-50%, 51%-75% and 76%-100% of the maximum value of daily energy con-sumption. The power capping factor is assigned a value from 1 to 4, accordingly, as illustrated at table 1 : higher is the gap between required energy and available renewable energy higher it is this value and vice versa. Higher power capping value means more power will be drawn from the grid. Dynamic power capping is already used for energy savings purpose in datacenters [10], [11], but it is never used, to our knowledge, in green powered datacenters for energy sources scheduling.
The energy sources scheduling algorithm is explaind in details by the depicted flowchart given at figure 5 . Consum represents the energy consumption at a given time and RE is the available renewable energy at the same moment of time. Variables re, grid, and battery represent the amount of energy that is drawn from each of the energy sources to supply the datacenter. Given a certain amount of energy consumption and available renewable energy in a given mo-ment of time t, first conducted test is to know whether the available renewable energy is enough to meet datacenter energy need. If yes, then all needed energy is taken from renewable source and grid energy and battery is assigned a value equal to 0. If energy consumption is higher than the available renewable energy, then power from grid will be taken. The amount to be drawn from it is calculated from a function named calculateP(C,RE) which assigns the value of power capping factor, according to the logic described at table 1 . If the energy drawn from both sources is not enough for the datacenter energy requirements then the bat-tery will be used. The amount that will be drawn from it is defined by the difference between energy consumption and energy taken from renewable and grid sources. All the three sources are printed out to be used for illustrating and further ellaboration purpose.
IV. Experiments and Results
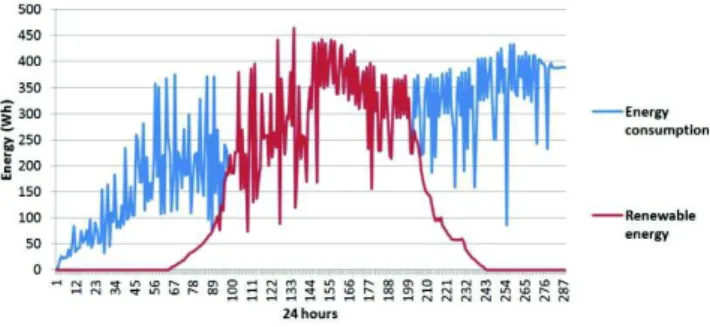
The experiments aim to assess the result of applying the pro-posed scheduling algorithm to the energy quantity driven from each of the energy sources used to fulfill the energy requirements of the datacenter. Figure 6 represents the re-newable energy utilization over total energy consumption through 24 hours of simulation. The horizontal axis repre-sents 288 5-minutes time intervals of energy consumption
in blue and renewable energy shown in red, expressed in Wh unit. The total energy consumption is 120 kWh and the total renewable energy used is 90kWh. This figure is interconnected to figure 7 which illustrates the energy drawn from the grid and from the battery considering the same energy required for the datacenter. We can notice that re-newable energy is fully used when it is available, during the day, while grid and battery are used during the night, when solar energy is lacking. It can be clearly seen from the graph that the grid power is capped at 4 levels and battery is used exactly during these periods when renewable energy and limited energy from the grid do not satisfy the need for energy.
Figure 6: Renewable energy usage and datacenter energy consump-tion over 24 hours.
Figure 7: Grid energy and battery usage over 24 hours.
Table 2 presents experiment results regarding the value and percentage of using these three energy sources. We in-tentionally chose a 75% renewable energy supply scenario, to explore the quantity that would be used from two other sources. The results show that out of 100% of energy con-sumption, 75% is drawn from the renewable energy source, 20% is taken from the grid and 5% is taken from battery.
Energy source Renewable Grid Battery
Value(kWh) 90 25 5
Percentage(%) 75 20 5
Table 2: Value and percentage of energy sources utilization.
V. Conclusions
In this paper we present a new energy sources scheduling scheme in order to maximize the renewable energy utiliza-tion, and reduce energy drawn from the grid and batteries. First priority is given to renewable energy, second priority is given to grid energy and third one to batteries. A dynamic power technique is used for capping the energy used from the grid. In a 75% renewable energy coverage scenario, the results of the experiments show that 20% of the required energy is supplied by the grid and 5% is drawn from bat-teries. The advantage of this algorithm is that it is enough realistic to consider supplying the datacenter with energy from the grid, which is limited by implementing a dynamic power capping technique. On the other hand, we optimize the battery usage by encouraging lower capacity batteries.
The proposed algorithm has higher efficiency if it is imple-mented over a platform where renewable energy is efficiently and maximally exploited, e.g using a workload scheduling algorithm. Also, a precondition of this new algorithm to function is it assumes energy consumption and renewable energy are already known through prediction.
To conclude, we point out that the proposed scheme is a first prototype. Other elements should be taken in considera-tion in the future, like: the lifetime of the battery (number of cycles) and other power characteristics. Furthermore, the experiments will be extended to 2 days of simulation in order to monitor jobs that are postponed to the consecutive day. Acknowledgment
The work presented in this paper has been supported by EU under the COST programme Action IC1305: Network for Sustainable Ultrascale Computing (NESUS).
References
[1] M. Alam, K. Shakil, Sh. Sethi, Analysis and Clustering of Workload in Google Cluster Trace based on Resource Usage, CoRR Journal, Volume 1501.01426, 2015.A. [2] F. Gbaguidi, S. Boumerdassi, E. Renault, E. Ezin,
Charac-terizing servers workload in Cloud Datacenters, In
Pro-ceedings of 3rd International Conference on Future Internet of Things and Cloud (FiCloud), 2015
[3] A. Maraj A. Londo, C. Firat, A. Dorri, M. Alcani. Energy investigation of the flat plate solar collector during its daily operation in clear days of summer and winter.
Jour-nal of Natural and Technical Sciences, Vol XIX (1), Academy
of Sciences, Albania, 2014.
[4] Rodrigo N. Calheiros, Rajiv Ranjan, Anton Beloglazov, Cesar A. F. De Rose, Rajkumar Buyya. CloudSim: a toolkit for modeling and simulation of cloud computing environments and evaluation of resource provisioning algorithms. Published in Journal of Software, Practice and
Experience, Vol. 41, Issue 1, New York, USA, January 2011
[5] E. Sheme, N. Frasheri. Implementing workload postpon-ing in CloudSim to maximize renewable energy utiliza-tion. In International Journal of Engineering Research and
Application (IJERA), Vol. 6, Issue 8, August 2016
[6] Raymond Carroll, Sasitharan Balasubramaniam, Dmitri Botvich, William Donnelly. Application of Genetic Algo-rithm to Maximise Clean Energy usage for Data Centres. Volume 87 of the series Lecture Notes of the Institute for
Computer Sciences, Social Informatics and Telecommunica-tions Engineering, Pages 565-580, 2012.
[7] Inigo Goiri, William Katsak, Kien Le, Thu D. Nguyen, Ricardo Bianchini. Parasol and GreenSwitch: Manag-ing Datacenters Powered by Renewable Energy, In
ASP-LOS’13, 2013
[8] M. A. et al., Towards the design and operation of net-zero energy data centers. In ITherm’12, 2012.
[9] Sonja Klingert, Florian Niedermeier, Corentin Dupont, Giovanni Giuliani, Thomas Schulze, and Hermann de Meer. Renewable Energy-Aware Data Centre Operations for Smart Cities, the DC4Cities Approach, International
Conference on Smart Cities and Green ICT Systems (SMART-GREENS), 2015, Pages 1-9
[10] Hao Chen, Can Hankendi, Michael C. Caramanis and Ayse K. Coskun. Dynamic Server Power Capping for Enabling Data Center Participation in Power Markets. In Proceedings of the International Conference on
Computer-Aided Design ICCAD ’13, San Jose, California, 2013
[11] Simon Seagrave. HP Dynamic Power Capping. Available online through URL http://techhead.co/hp-dynamic-power-capping/, 2008