https://doi.org/10.4224/12328541
READ THESE TERMS AND CONDITIONS CAREFULLY BEFORE USING THIS WEBSITE.
https://nrc-publications.canada.ca/eng/copyright
Vous avez des questions? Nous pouvons vous aider. Pour communiquer directement avec un auteur, consultez la
première page de la revue dans laquelle son article a été publié afin de trouver ses coordonnées. Si vous n’arrivez pas à les repérer, communiquez avec nous à PublicationsArchive-ArchivesPublications@nrc-cnrc.gc.ca.
Questions? Contact the NRC Publications Archive team at
PublicationsArchive-ArchivesPublications@nrc-cnrc.gc.ca. If you wish to email the authors directly, please see the first page of the publication for their contact information.
Archives des publications du CNRC
For the publisher’s version, please access the DOI link below./ Pour consulter la version de l’éditeur, utilisez le lien DOI ci-dessous.
Access and use of this website and the material on it are subject to the Terms and Conditions set forth at
Properties of Level Landfast Ice and Hummocked Ice near Nain, Labrador
Johnston, Michelle
https://publications-cnrc.canada.ca/fra/droits
L’accès à ce site Web et l’utilisation de son contenu sont assujettis aux conditions présentées dans le site
LISEZ CES CONDITIONS ATTENTIVEMENT AVANT D’UTILISER CE SITE WEB.
NRC Publications Record / Notice d'Archives des publications de CNRC:
https://nrc-publications.canada.ca/eng/view/object/?id=21e6c808-aa99-484d-82c1-7a5592aad5a1 https://publications-cnrc.canada.ca/fra/voir/objet/?id=21e6c808-aa99-484d-82c1-7a5592aad5a1
Properties of Level Landfast Ice and Hummocked Ice
near Nain, Labrador
M. Johnston
Technical Report, CHC-TR-031
March 2005
TP 14387E
Properties of Level Landfast Ice and Hummocked Ice
near Nain, Labrador
M. Johnston
Canadian Hydraulics Centre National Research Council of Canada
Montreal Road Ottawa, Ontario K1A 0R6
prepared for
Transport Canada 11th Fl. Place de Ville, Tower C
330 Sparks Street Ottawa, Ontario K1A 0N8
and
Canadian Ice Service 373 Sussex Drive, Bld. E-3 Ottawa, Ontario K1A 0H3
Technical Report, CHC-TR-031
Abstract
This report discusses property measurements that were made on level first-year sea ice near Nain, from early February to mid May 2004. Ice thickness ranged from 0.41 to 0.65 m in February, and 0.89 to 1.20 m in mid-May. The highest borehole strengths were measured in March, when the ice was coldest. Results showed that, in general, ice strength decreased more rapidly towards the top and bottom surfaces than in the ice interior. The strength reduction was due to ice decay, clear evidence of which was provided by the deteriorated state of the extracted cores, and changes in the temperature and salinity of the ice.
Measurements are also given for hummocked ice sites that were sampled in a quasi-stable area of landfast ice, in April. The ice surface relief increased, as did the ice and snow thickness, as the hummock field was penetrated. Ice thickness at the first site ranged from 0.99 to 1.17 m, whereas ice at the fourth site ranged from 1.14 to 2.20 m thick. The hummocked ice was isothermal at near melting temperatures throughout its full thickness. The ice salinity was minimal in the top ice, ranged from 4 to 5‰ in the ice interior, and was upwards of 8‰ towards the bottom ice. The highest borehole strength was measured in the interior of the ice. On average, the hummocked was thicker and stronger than the level landfast ice (for the same time of year).
Résumé
Dans ce rapport on analyse des données de terrain, recueillies près de Nain à partir du début de février jusqu’à la mi-mai 2004, sur les propriétés de la glace de mer plane de première année. L’épaisseur de cette glace variait de 0,41 à 0,65 m en février, et de 0,89 à 1,20 m à la mi-mai. La résistance de la glace, mesurée dans des trous de sondes, était la plus élevée en mars alors que sa température était la plus basse. Les résultats indiquent en général une réduction plus rapide de la résistance près des surfaces supérieure et inférieure qu’au centre. Cette réduction de la résistance est attribuée à la décomposition de la glace, mise en évidence par des signes de détérioration dans les carottes, et à des changements de la température et de la salinité de la glace.
On présente également des données provenant de sites de glace hummockée qui ont été échantillonnés en avril dans une zone presque stable de la banquise côtière. Le relief à la surface de cette glace s’accentuait au fur et à mesure que l’on pénétrait dans le champ de hummocks, alors qu’on observait aussi une augmentation de l’épaisseur de la glace et de sa couverture de neige. L’épaisseur de la glace sur le premier site variait de 0,99 à 1,17 m; sur le quatrième site, elle variait de 1,14 à 2,20 m. La température de la glace hummockée se situait près du point de fusion sur toute son épaisseur. La salinité était minime dans la partie supérieure, variait de 4 à 5‰ au centre et excédait 8‰ près de la surface inférieure. La résistance la plus élevée a été mesurée dans la partie centrale du couvert de glace. En moyenne, la glace hummockée était plus épaisse et plus résistante que celle de la banquise côtière (durant la même période de l’année).
Table of Contents
Abstract...i Résumé ...i Table of Contents...iii List of Figures...v List of Tables ...v 1.0 Introduction...1 2.0 Background ...13.0 Air Temperatures during Four Site Visits ...2
4.0 Location of Sampling Sites in Landfast First-year Ice...3
5.0 Properties of Level Landfast Ice ...4
5.1 February...6
5.2 March...6
5.3 April...7
5.4 May...7
5.5 Profiles of Ice Temperature...8
5.6 Profiles of Ice Salinity...9
5.6.1 February...9
5.6.2 March...10
5.6.3 April...10
5.6.4 May...10
5.7 Profiles of Ice Borehole Strength ...12
5.7.1 Rate of Reduction in Strength...12
6.0 Location of Sampling Sites in Hummocked First-year Ice...15
7.0 Hummocked Ice: Its Development and Destruction...16
8.0 Properties of Hummocked Ice...18
8.1 Temperature Profiles of Ice in Hummock Field ...19
8.2 Salinity Profiles of Ice in the Hummock Field ...20
8.3 Borehole Strength Profiles of Ice in Hummock Field ...21
9.0 Strengths of Level and Sub-Arctic Ice, Compared to Arctic Ice ...22
10.0 Conclusions ...23
11.0 Acknowledgments ...24
12.0 References ...25 Appendix A: Sampling Methodology used for Level and Hummocked Ice ...A-1
List of Figures
Figure 1 Hourly air temperatures for Nain, January to May 2004... 2
Figure 2 Level ice sites in Strathcona Run and Anaktalak Run ... 4
Figure 3 Evolution of ice surface conditions in Anaktalak Run from February to May... 5
Figure 4 Snow and ice thickness in (a) Strathcona Run and (b) Anaktalak Run... 5
Figure 5 Uppermost 0.50 m of ice in Strathcona Run in (a) February and (b) May... 8
Figure 6 In situ ice temperatures at (a) Site S7 and (b) Site A1... 9
Figure 7 Ice Salinity in Strathcona Run and Anaktalak Run, from February to May... 11
Figure 8 Profiles of ice borehole strength, three-hole average... 13
Figure 9 Sampling sites in a rough (hummocked) area of quasi-stable landfast ice... 15
Figure 10 Rough ice between Whale Island and Skull Island... 16
Figure 11 Mapping the landfast ice edge with the CIS Ice Charts ... 17
Figure 12 Conditions at sites in hummocked ice, ice thickness shown in brackets ... 18
Figure 13 Temperature of ice at (a) Sites H1, H2 and H3 and (b) Site H4 ... 19
Figure 14 Salinity of ice at (a) Sites H1, H2 and H3 and (b) Site H4 ... 20
Figure 15 Strength of ice at four sites in hummock field... 21
Figure 16 Seasonal decrease in borehole strengths for sub-Arctic ice and Arctic ice... 22
List of Tables
Table 1 Sampling Sites and Properties Measured during 2004 Season... 3Table 2 Ice Thickness during Four Site Visits, and its Rate of Change ... 6
Table 3 Ice Strength during Four Site Visits, and its Rate of Change ... 14
Properties of Level Landfast Ice and Hummocked Ice
near Nain, Labrador
1.0
Introduction
This report discusses the property measurements that were made on level, landfast first-year ice near Nain, Labrador. The objective of the fieldwork was to provide an enhanced understanding of the properties of landfast first-year ice in the sub-Arctic, as it grows and decays. This study follows on the past three years of fieldwork that the Canadian Hydraulics Centre (CHC) of the National Research Council Canada (NRC) has conducted on decaying first-year ice in the high Arctic. The Labrador fieldwork was sponsored by Transport Canada and the Canadian Ice Service (CIS).
The Labrador field program involved sampling sites along two transects in the level, landfast first-year ice near Nain (56.53°N, 61.68°W), from early February to mid-May 2004. In April, four sites were also sampled in a quasi-stable area of hummocked ice. The first part of the report focuses on the properties of level, landfast ice at two locations near Nain. The second part of the report includes measurements made at four sites in a hummocked area of quasi-stable landfast ice.
2.0
Background
In the year 2000, the Canadian Hydraulics Centre (CHC) began conducting measurements on decaying Arctic first-year sea ice, to provide much needed information about properties of the ice in summer. An improved understanding of ice decay, and the property changes that it induces, has direct relevance to shipping in the Arctic, most of which takes place from June to September. To date, three seasons of measurements have been made on decaying first-year ice in the Arctic (Johnston et al., 2001; 2002; 2003). Those measurements provided systematic documentation of the decay-related changes that occur in the ice from April to August. That information was useful input to the Arctic Ice Regime Shipping System (AIRSS), in terms of how AIRSS accounts for ice decay (Timco and Johnston, 2003). Another outcome of the ice decay work was the Ice Strength Charts that are issued each summer by the Canadian Ice Service (CIS), as discussed in Gauthier et al. (2002) and Langlois et al. (2003). Although the Ice Strength Charts include regions of first-year ice south of the high Arctic, there is little confidence in extending the Charts to southerly latitudes because so few measurements have been made in that area (Johnston and Timco, 2004).
Realizing that both Transport Canada and CIS would benefit from a better understanding of Arctic ice, the CHC proposed that the decay work be shifted from ice in the high Arctic, to sub-Arctic ice off the coast of Labrador. The shift was timely, considering that shipping to the Voisey’s Bay Mine is due to commence in the winter of 2006 (Rowell and Metcalf, 2005).
3.0
Air Temperatures during Four Site Visits
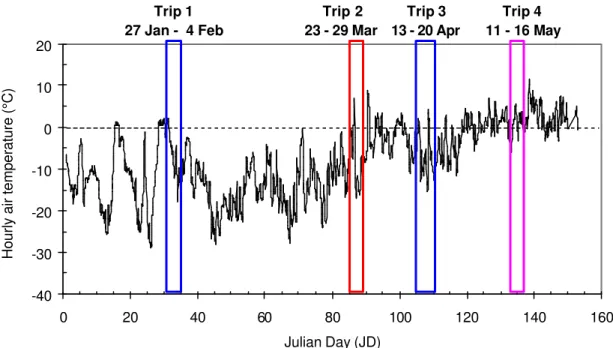
Adequately characterizing the growth and decay of sub-Arctic ice required that four trips be made to Labrador during the winter and spring of 2004, to capture the winter ice growth season, and the spring/summer decay season. Figure 1 shows the dates of each trip, along with the air temperatures for Nain during the 2004 season. The first trip to Labrador was from 27 January to 4 February (Julian Day, JD27 to JD351). The second trip was made from 23 to 29 March (JD83 to JD89). The third trip was made from 13 to 20 April (JD104 to JD111). The fourth and final trip to Labrador was made from 11 to 16 May (JD132 to JD137).
Figure 1 shows that large temperature fluctuations are characteristic of the climate near Nain. Take, for instance, late-March (Trip 2) when the air temperature dropped 23°C over a 16-hour period (from a temperature of +7°C to -16°C). Radical temperature fluctuations occurred frequently, and were usually accompanied by high winds and precipitation. Those conditions made traveling to Nain difficult, and they made working on the ice extremely challenging. Traveling to Nain from Ottawa took several days in good weather (an overnight in Goose Bay was required), but the journey could take up to a week, or more, in inclement weather. As a result, only a few of the days noted in Figure 1 were available for sampling the ice.
-40 -30 -20 -10 0 10 20 0 20 40 60 80 100 120 140 160 Julian Day (JD)
Hourly air temperature (°C)
Trip 1 27 Jan - 4 Feb Trip 3 13 - 20 Apr Trip 4 11 - 16 May Trip 2 23 - 29 Mar
Figure 1 Hourly air temperatures for Nain, January to May 2004
(data courtesy of Environment Canada)
1
4.0
Location of Sampling Sites in Landfast First-year Ice
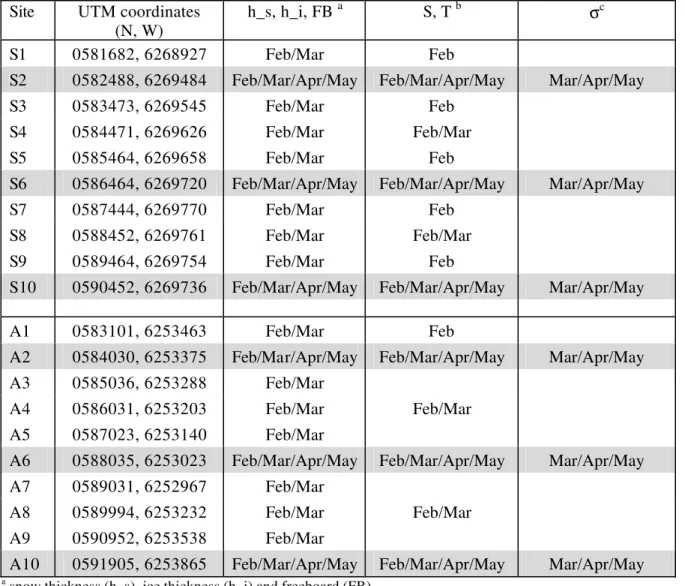
Property measurements were made at sampling sites along the two transects shown in Figure 2. The first transect coincided with the ‘traditional’ shipping route to Nain, in Strathcona Run. The second transect was made about 15 km south, on the approach to Anaktalak Bay, in order to coincide with the proposed shipping route to the Voisey’s Bay Mine site, in Edwards Cove (Rowell and Metcalf, 2005). Each transect included ten sampling sites, spaced at 1 km intervals. The UTM coordinates of each site are shown in Table 1. The table also lists the types of property measurements made at the different sites. The most complete set of measurements was made at Sites S2, S6 and S10 in Strathcona Run and Sites A2, A6 and A10 in Anaktalak Run. Appendix A provides a discussion of the sampling methodology that was used during the Labrador field program.
Table 1 Sampling Sites and Properties Measured during 2004 Season
Site UTM coordinates
(N, W)
h_s, h_i, FB a S, T b σc
S1 0581682, 6268927 Feb/Mar Feb
S2 0582488, 6269484 Feb/Mar/Apr/May Feb/Mar/Apr/May Mar/Apr/May
S3 0583473, 6269545 Feb/Mar Feb
S4 0584471, 6269626 Feb/Mar Feb/Mar
S5 0585464, 6269658 Feb/Mar Feb
S6 0586464, 6269720 Feb/Mar/Apr/May Feb/Mar/Apr/May Mar/Apr/May
S7 0587444, 6269770 Feb/Mar Feb
S8 0588452, 6269761 Feb/Mar Feb/Mar
S9 0589464, 6269754 Feb/Mar Feb
S10 0590452, 6269736 Feb/Mar/Apr/May Feb/Mar/Apr/May Mar/Apr/May
A1 0583101, 6253463 Feb/Mar Feb
A2 0584030, 6253375 Feb/Mar/Apr/May Feb/Mar/Apr/May Mar/Apr/May
A3 0585036, 6253288 Feb/Mar
A4 0586031, 6253203 Feb/Mar Feb/Mar
A5 0587023, 6253140 Feb/Mar
A6 0588035, 6253023 Feb/Mar/Apr/May Feb/Mar/Apr/May Mar/Apr/May
A7 0589031, 6252967 Feb/Mar
A8 0589994, 6253232 Feb/Mar Feb/Mar
A9 0590952, 6253538 Feb/Mar
A10 0591905, 6253865 Feb/Mar/Apr/May Feb/Mar/Apr/May Mar/Apr/May
a
snow thickness (h_s), ice thickness (h_i) and freeboard (FB)
b
ice salinity (S) and ice temperature (T)
c
Anaktalak Bay/ Edward’s Cove
(7 km west) “Anaktalak Run”
S2 A2 x x x 10 km S10 A10 Nain Strathcona Run temperature chains S6 A6 temperature chain
property measurements (w/o strength) property measurements (w/ strength)
Figure 2 Level ice sites in Strathcona Run and Anaktalak Run
5.0
Properties of Level Landfast Ice
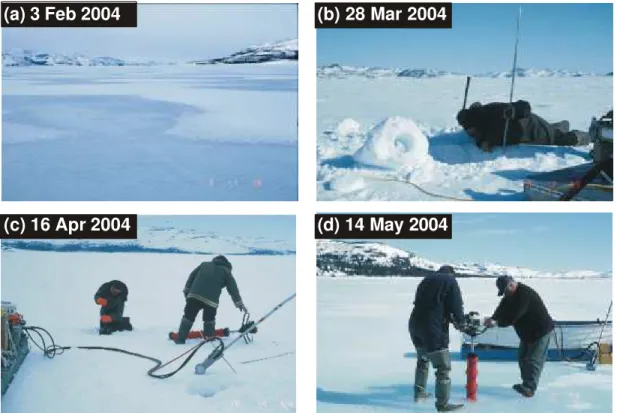
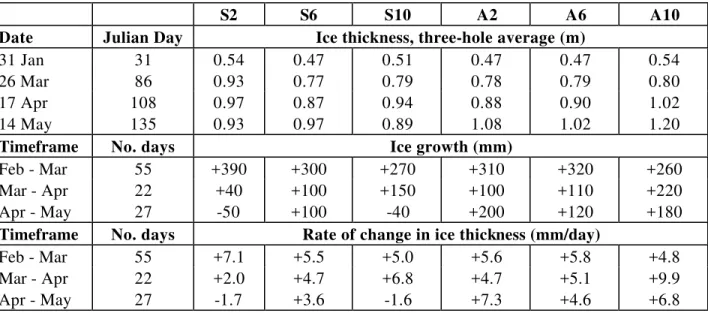
The photographs in Figure 3 show the ice in Anaktalak Run during the different site visits. Similar conditions were observed in Strathcona Run. Clearly, very different ice conditions were encountered during each trip. The snow and ice thickness measured at Sites S2, S6 and S10 in Strathcona Run, and Sites A2, A6 and A10 in Anaktalak Run are plotted in Figure 4. The data in the figure represent the average of the measurements made in up to three boreholes at each site (see Appendix A). Table 2 lists the three-hole average of the ice thickness measured at those six sites, and the rate at which the ice thickness changed during the sampling program.
Since the three-hole average obscures some of the variability in measurements made at the different boreholes, those ‘local variations’ will be described briefly. Snow thickness measurements at Sites S2, S6 and S10 varied by as much as 210 mm, and the ice thickness varied by up to 105 mm. In Anaktalak Run, snow thickness measurements varied by as much as 230 mm, and the ice thickness varied by up to 130 mm.
(a) 3 Feb 2004 (b) 28 Mar 2004
(c) 16 Apr 2004 (d) 14 May 2004
Figure 3 Evolution of ice surface conditions in Anaktalak Run from February to May
-1.5 -1.0 -0.5 0.0 0.5 0 20 40 60 80 100 120 140 160 Julian Day Thickness (m) S2 S6 S10 (a) -1.5 -1.0 -0.5 0.0 0.5 0 20 40 60 80 100 120 140 160 Julian Day Thickness (m) A2 A6 A10 (b)
JAN FEB MAR APR MAY
Table 2 Ice Thickness during Four Site Visits, and its Rate of Change
S2 S6 S10 A2 A6 A10
Date Julian Day Ice thickness, three-hole average (m)
31 Jan 31 0.54 0.47 0.51 0.47 0.47 0.54
26 Mar 86 0.93 0.77 0.79 0.78 0.79 0.80
17 Apr 108 0.97 0.87 0.94 0.88 0.90 1.02
14 May 135 0.93 0.97 0.89 1.08 1.02 1.20
Timeframe No. days Ice growth (mm)
Feb - Mar 55 +390 +300 +270 +310 +320 +260
Mar - Apr 22 +40 +100 +150 +100 +110 +220
Apr - May 27 -50 +100 -40 +200 +120 +180
Timeframe No. days Rate of change in ice thickness (mm/day)
Feb - Mar 55 +7.1 +5.5 +5.0 +5.6 +5.8 +4.8
Mar - Apr 22 +2.0 +4.7 +6.8 +4.7 +5.1 +9.9
Apr - May 27 -1.7 +3.6 -1.6 +7.3 +4.6 +6.8
5.1 February
The morning of 1 February (Julian Day JD32) was spent freezing a temperature chain into the ice at Site S7 (Figure 2), a site that was far enough from the community to avoid interfering with snowmobile traffic. In the afternoon, the ice at Sites S8, S9 and S10 was sampled, when air temperatures ranged from -2.6 to -3.5°C. The next day, JD33, the ice at Sites S1 to S6 was sampled, when air temperatures were from -5.5 to -6.8°C. Figure 4-a shows that ice thickness at the ten sites in Strathcona Run ranged from 0.47 to 0.65 m, and snow thicknesses varied from 0 to 80 mm.
The morning of JD33 was spent installing a second temperature chain in the ice at Site A1, 35 km south of Nain (Figure 2). The ten sites in Anaktalak Run were sampled On JD34, when air temperatures ranged from -8.5 to -11.5°C. Figure 4-b shows that ice thickness in Anaktalak Run ranged from 0.41 to 0.55 m in February, with snow thicknesses from 0 to 100 mm. Table 2 lists the three-hole average of the ice thickness measured at Sites S2, S6 and S10 and Sites A2, A6 and A10.
5.2 March
Strength tests were added to the suite of property measurements during the second visit. On the first day of sampling, 26 March (JD85), strength tests in the third borehole at Site S2 were abruptly terminated when the rented generator failed to power the system. The next day, strength tests were conducted at Sites S6, S8 and S10, using a different generator. Air temperatures ranged from -1.8 to +8.5°C during those two days. Ice thickness at the ten sites in Strathcona Run ranged from 0.74 to 0.95 m, with snow depths from 80 to 410 mm. On average, ice thickness at Sites S2, S6 and S10 increased from 270 to 390 mm between the February and March site visits, resulting in a growth rate of 5.0 to 7.1 mm/day during that period (Table 2).
The ice in Anaktalak Run was sampled on 27 March (JD87) at air temperatures from -5.1 to -8.6°C. In March, the ice in Anaktalak Run ranged from 0.71 to 0.90 m thick, with snow depths from 0 to 360 mm. No strength tests were conducted that day because, once again, generator problems plagued the test program. The following day, borehole strength tests were conducted successfully at Sites A2, A6 and A10. The photograph in Figure 3-b shows measurements being made at Site A6, and the chunk of densely packed snow (with a hole in it) that was dislodged during the coring process. On average, the ice thickness at Sites A2, A6 and A10 increased from 260 to 320 mm between the February and March site visits, resulting in an average ice growth rate of 4.8 to 5.8 mm/day during that period (Table 2).
5.3 April
In April, the third trip to Labrador was made with a new 2600 W generator in tow. Since the clear and cold conditions on April 16 (JD107) made excellent traveling weather, the more distant sites in Anaktalak Run were sampled prior to those in Strathcona Run. While attempting to take the second core at Site A2, the recoil mechanism on the corer motor broke. Although it is possible to extract a core manually, without a motor, it was realized that the sampling planned for the considerably thicker hummocked ice would require a motor. The field party returned to camp to see what could be done about the problem. Although no parts were available in that remote location, a motor was borrowed from a Nain; that motor was used during the remainder of the trip. When Sites S2, S6 and S10 were sampled on the morning of 17 April (JD108), the skies were clear and the air temperature was -9.7°C. When measurements at Site S10 were complete, four hours later, the air temperature had increased to +4.9°C. Ice thickness at the three sites in Strathcona Run ranged from 0.85 to 0.98 m, and snow depths from 90 to 290 mm (Figure 4-a). A trip to Anaktalak Run was made that afternoon, to continue work that had been interrupted the previous day. Warm air temperatures persisted into the afternoon: the air temperature at Site A10 was +6.0°C, and +5.3°C at Site A6. Ice thickness at Sites A2, A6 and A10 ranged from 0.85 to 1.04 m, with snow depths from 110 to 290 mm (Figure 4-b).
Table 2 shows that, between the March and April site visits, the average ice thickness at Sites S2, S6 and S10 increased from 40 to 150 mm, resulting in an average growth rate of 2.0 to 6.8 mm/day. The average ice thickness at Sites A2, A6 and A10 increased from 100 to 220 mm during that same timeframe, resulting in an average ice growth rate of 4.7 to 10 mm/day during that period.
5.4 May
The fourth and final trip to Labrador was made in mid-May, when the snow cover in most areas had melted completely, and the ice surface had a considerable amount of ponding (Figure 4-d). Surface conditions made traveling by snowmobile extremely difficult. The ice in Strathcona Run and Anaktalak Run was sampled on one of the few days that the ice could be accessed: 14 May (JD135). Although the ice had been covered with up to 0.30 m of standing water the day before (Sikumiut Environmental Management, personal communication), much of that surface water had drained through the ice when the sites were visited on 14 May.
Sites A2, A6 and A10 were sampled that morning, under sunny skies, minimal wind and air temperatures from +1.2 to +5.2°C. The ice thickness at those three sites ranged from 0.97 to 1.22 m, and snow depths from 0 to 90 mm. In the afternoon, Sites S2, S6 and S10 were sampled. By that time, the clear skies of the morning had clouded over, the wind had increased, it was threatening to rain, and the air temperature was about +3°C. Ice thickness at Site S2, S6 and S10 ranged from 0.89 to 0.99 m, with snow depths from 0 to 60 mm.
Table 2 shows that the average ice thickness at Sites S2 and S10 decreased by 50 mm and 40 mm from April to May, respectively, or by 1.7 and 1.6 mm/day on average. Although the average ice thickness at those two sites decreased, the ice thickness at Site S6 increased by about 100 mm, or about 3.6 mm/day. The ice thickness at each of the three sites in Anaktalak Run also increased from April to May, by a total of 120 to 200 mm, or 4.6 to 7.3 mm/day from April to May.
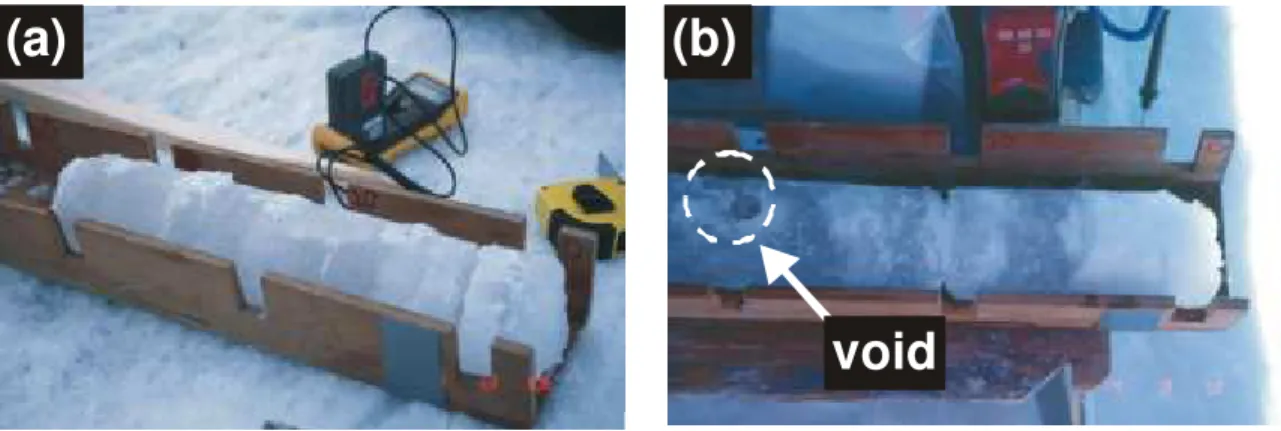
Figure 5 shows a comparison of the uppermost 0.50 m of ice from a core that was extracted in (a) February and (b) May. The darker appearance of the core in May is believed due to its water-saturated state. Not only were cores extracted in May water water-saturated, they had large voids permeating throughout them, revealing an advanced stage of ice decay. The voids were not necessarily restricted to the uppermost ice surface; some of the voids occurred mid-way through the full-thickness of ice, as illustrated by the large, rounded void that occurred at a depth of 0.40 m noted in Figure 5-b.
(a)
(b)
void
Figure 5 Uppermost 0.50 m of ice in Strathcona Run in (a) February and (b) May
5.5 Profiles of Ice Temperature
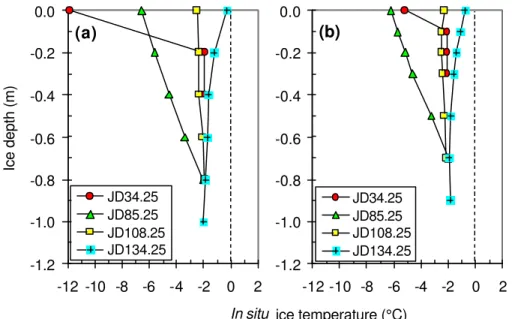
Figure 6 shows profiles of in situ ice temperatures at Site S7 and Site A1 using measurements from the temperature chains. Johnston and Timco (2005) provide a complete description of the two temperature chains, and measurements they provided. Temperature profiles in the figure were shown for the days on which ice sampling took place: 3 February (JD34), 25 March (JD85), 17 April (JD108) and 13 May (JD134). Although temperatures were measured at 30-minute intervals from February to May, Figure 6 shows the temperature at 06:00 hrs, a time that was considered to be more stable than later in the day. In situ measurements from the temperature chains were used in the figure, rather than temperatures measured on the extracted ice cores (Appendix A), because Johnston and Timco (2005) showed the former to be more accurate.
-1.2 -1.0 -0.8 -0.6 -0.4 -0.2 0.0 -12 -10 -8 -6 -4 -2 0 2 JD34.25 JD85.25 JD108.25 JD134.25 (b) -1.2 -1.0 -0.8 -0.6 -0.4 -0.2 0.0 -12 -10 -8 -6 -4 -2 0 2 JD34.25 JD85.25 JD108.25 JD134.25 (a) Ice depth (m)
In situ ice temperature (°C)
Figure 6 In situ ice temperatures at (a) Site S7 and (b) Site A1
JD34 - 3 February, JD85 - 25 March, JD108 - 17 April, JD134 - 13 May (depth of zero level of top ice surface when temperature chains were installed)
On JD34, when snow and ice thicknesses were respectively 50 mm and 0.50 m at Site S7, and 40 mm and 0.44 m at Site A1, the top ice at Site S7 was several degrees colder (-11.9°C) than at Site A1 (5.2°C). By March (JD85), the top ice temperature at both sites was similar (6.5°C and -6.3°C); the bulk ice at both sites had a similar temperature gradient. Snow thickness at the two sites was similar on JD85 (175 mm), however the ice at Site A1 was about 100 mm thicker than at Site S7. In April (JD108), the ice at both sites had warmed to a near-isothermal state, conditions that persisted until the temperature chains were removed on 13 May (JD134). By the end of the measurement season, the snow cover at Site S7 had completely melted, yet the ice at Site A1 had a 170 mm thick snow cover.
5.6 Profiles of Ice Salinity
5.6.1 February
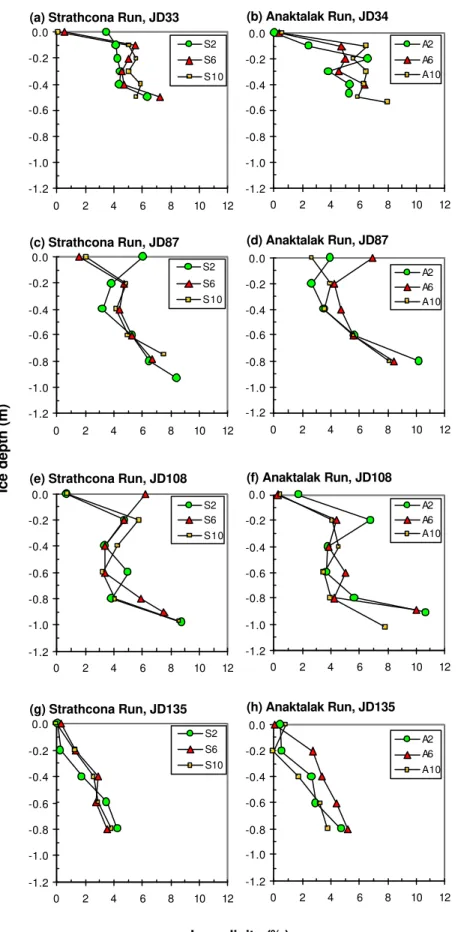
Figure 7 shows the ice salinity profiles for Sites S2, S6 and S10, and Sites A2, A6 and A10, from February to May. Figure 7-a/b shows that in early February, the uppermost ice surface at all sites had minimal salinity, with the exception of Site S2 (which had a salinity of 3.5‰ at its surface). The minimal amount of salt in the surface layer of ice is not surprising, considering that much of the ice was covered by water-saturated, slushy conditions at that time (Figure 3-a). Salinities in the intermediate layer of ice ranged from 4.0 to 6.6‰, whereas salinities as high as 7 to 8‰ were measured towards the bottom layer of ice. In general, the ice in Anaktalak Run had a slightly higher salinity than the ice in Strathcona Run. The salinity of the seawater just below the bottom ice surface at Sites S2, S6 and S10 was 25.4, 25.3 and 23.9‰ respectively. The salinity of the seawater at Sites A2, A6 and A10 was 26.4, 26.5 and 26.5‰ respectively.
5.6.2 March
Figure 7-c/d show that in late-March (JD87), Sites S2, A2 and A6 had the classic ‘C-shaped’ salinity profile, where salinities were higher in the top and bottom ice surfaces, and lower in the intermediate layers of ice. The ‘C’ shaped salinity profile typically characterizes first-year ice in the Arctic (Sinha and Nakawo, 1981). Those three sites had a ‘C-shaped’ profile, however the other three sites did not: Sites S6, S10 and A10 had profiles that were similar to the February profiles, where the top ice surface had a lower salinity than the ice interior. In general, the ice salinity in the intermediate layers ranged from 2.7 to 6.7‰, with slightly higher salinities towards the bottom ice surface. Seawater salinities at Sites S2 and S6, the only sites where it was measured, were 27.1 and 27.4‰, compared to seawater salinities of 27.5, 26.6 and 22.5‰ at Sites A2, A6 and A10.
5.6.3 April
The salinity profiles did not change considerably from April to May (Figure 7-e/f), with the exception of continued desalination in the top ice surface. Four of the six sites had salinities of less than 1‰ in the uppermost 0.20 m, compared to March, when the three lowest top ice salinities were from 1.6 to 2.7‰. Note that in April, the ice was characterized by a ‘C’-shaped salinity profile below the low salinity top ice. Salinities ranged from 3.2 to 6.8‰ in the intermediate layer of ice, and were from 8 to 10‰ towards the bottom ice. In April, the seawater salinity at Sites S2 and S6 was 24.8 and 25.8‰ respectively, whereas seawater at Sites A6 and A10 had a salinity of 26.3 and 26.2‰ respectively.
5.6.4 May
By mid-May, the ice had desalinated throughout its full-thickness (JD135, Figure 7-g/h), which resulted in profiles that were quite different than earlier in the season. The uppermost 0.20 m of ice at five of the six sites was virtually ‘fresh’ (minimal salinity), whereas below that depth, the ice salinity decreased linearly with increasing depth. In May, the salinity of the seawater at Sites S2, S6 and S10 was 0.3, 4.6 ad 1.6‰ respectively, whereas the salinity of the seawater at Sites A2, A6 and A10 was 5.4, 0.6 and 2.1‰. Clearly, the melting snow, the thinning ice, and the desalinating ice cover produced a significant reduction in the water salinity.
-1.2 -1.0 -0.8 -0.6 -0.4 -0.2 0.0 0 2 4 6 8 10 12 S2 S6 S10
(a) Strathcona Run, JD33
-1.2 -1.0 -0.8 -0.6 -0.4 -0.2 0.0 0 2 4 6 8 10 12 A2 A6 A10 (b) Anaktalak Run, JD34 -1.2 -1.0 -0.8 -0.6 -0.4 -0.2 0.0 0 2 4 6 8 10 12 S2 S6 S10 (c) Strathcona Run, JD87 -1.2 -1.0 -0.8 -0.6 -0.4 -0.2 0.0 0 2 4 6 8 10 12 A2 A6 A10 (d) Anaktalak Run, JD87 -1.2 -1.0 -0.8 -0.6 -0.4 -0.2 0.0 0 2 4 6 8 10 12 S2 S6 S10
(e) Strathcona Run, JD108
-1.2 -1.0 -0.8 -0.6 -0.4 -0.2 0.0 0 2 4 6 8 10 12 A2 A6 A10 (f) Anaktalak Run, JD108 -1.2 -1.0 -0.8 -0.6 -0.4 -0.2 0.0 0 2 4 6 8 10 12 S2 S6 S10 (g) Strathcona Run, JD135 -1.2 -1.0 -0.8 -0.6 -0.4 -0.2 0.0 0 2 4 6 8 10 12 A2 A6 A10 (h) Anaktalak Run, JD135 Ice salinity (‰) Ice depth (m)
Figure 7 Ice Salinity in Strathcona Run and Anaktalak Run, from February to May
5.7 Profiles of Ice Borehole Strength
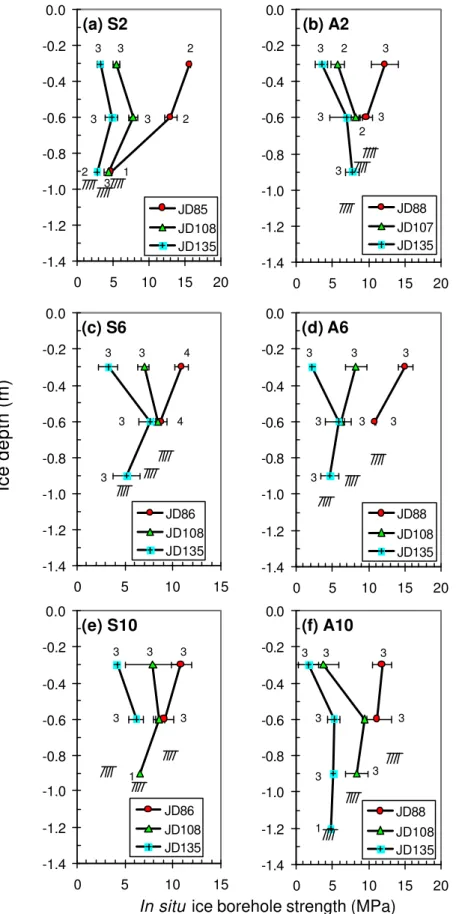
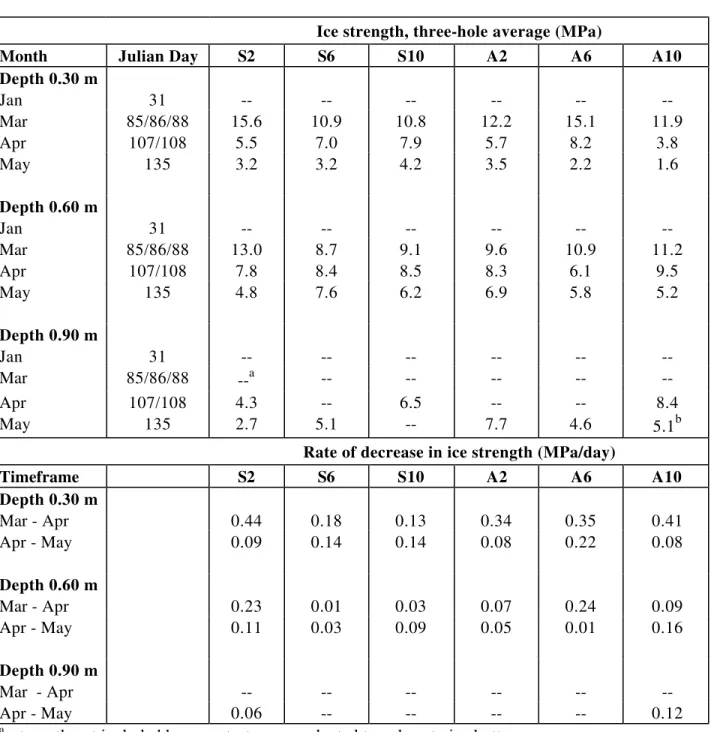
Figure 8 shows profiles of the average ice strength that was measured in up to three boreholes, at each site in March, April and May. The number next to the data marker refers to the number of boreholes that were tested at that particular depth. Horizontal bars were used to show the standard deviation, or range, of the measured strengths. The approximate ice thickness in each borehole was noted by cross-hatching. In all cases, the ice thickness determined the depth to which strength tests could be performed. To minimize the effect of free surface, tests were conducted to within 50 mm of the bottom ice surface. Table 3 lists the average ice strengths measured at each test depth, and the rate at which the ice strength decreased from (i) March to April and (ii) April to May. Results showed that the ice was strongest (at all test depths) in March, when it was coldest. The highest strengths were measured in the surface layer of ice at Site S2 and Site A6 (15.6 and 15.1 MPa, respectively). Similarly, strengths at the 0.60 m test depth were also highest at Site S2 and Site A6 (13.0 and 10.9 MPa, respectively, in March).
The first loss of strength occurred in the top ice surface (depth 0.30 m), which is where the ice was strongest, initially. The surface layer of ice at Site S2 showed the largest reduction in strength: from 15.5 MPa in March, to only 5.6 MPa in April. In general, the strength profiles show that the intermediate layer of ice (depth 0.60 m) retained its strength longer than either the top or bottom ice surfaces. At Sites S6, S10, A2 and A10, strength in the intermediate layer decreased by less than 2.0 MPa from March to April, compared to 5.2 and 4.8 MPa at Site S2 and Site A6, respectively.
5.7.1 Rate of Reduction in Strength
From March to April, the ice strength at the 0.30 m depth decreased by 0.34 to 0.44 MPa/day at four sites, yet by only 0.13 and 0.18 MPa/day at the other two sites. From April to May, the strength at that depth continued to decrease at five of the sites, at a rate of 0.08 to 0.14 MPa/day, and 0.22 MPa/day at the sixth site.
The strength at a depth of 0.60 m decreased more slowly than at a depth of 0.30 m, during the same test period. From March to May, the intermediate layer of ice lost strength at a rate of 0.01 to 0.16 MPa/day, at all but two sites, where the strength decreased by 0.23 and 0.24 MPa/day, on average. From April to May, the strength at that depth decreased from 0.01 to 0.16 MPa/day.
Although ice strength at a depth of 0.90 m was measured only at Sites S2 and A10, in April and May, it decreased at a rate that was comparable to the 0.30 m depth (0.06 and 0.12 MPa/day, from April to May).
In situ ice borehole strength (MPa) -1.4 -1.2 -1.0 -0.8 -0.6 -0.4 -0.2 0.0 0 5 10 15 20 JD88 JD108 JD135 (f) A10 3 3 3 3 3 3 1 3 -1.4 -1.2 -1.0 -0.8 -0.6 -0.4 -0.2 0.0 0 5 10 15 JD86 JD108 JD135 (e) S10 3 3 3 1 3 3 -1.4 -1.2 -1.0 -0.8 -0.6 -0.4 -0.2 0.0 0 5 10 15 20 JD88 JD108 JD135 (d) A6 3 3 3 3 3 3 3 -1.4 -1.2 -1.0 -0.8 -0.6 -0.4 -0.2 0.0 0 5 10 15 JD86 JD108 JD135 (c) S6 3 3 4 3 3 4 Ice depth (m) -1.4 -1.2 -1.0 -0.8 -0.6 -0.4 -0.2 0.0 0 5 10 15 20 JD88 JD107 JD135 (b) A2 3 3 3 2 2 3 3 -1.4 -1.2 -1.0 -0.8 -0.6 -0.4 -0.2 0.0 0 5 10 15 20 JD85 JD108 JD135 (a) S2 3 3 3 3 2 2 1 3 2
Figure 8 Profiles of ice borehole strength, three-hole average
Table 3 Ice Strength during Four Site Visits, and its Rate of Change
Ice strength, three-hole average (MPa)
Month Julian Day S2 S6 S10 A2 A6 A10
Depth 0.30 m Jan 31 -- -- -- -- -- -- Mar 85/86/88 15.6 10.9 10.8 12.2 15.1 11.9 Apr 107/108 5.5 7.0 7.9 5.7 8.2 3.8 May 135 3.2 3.2 4.2 3.5 2.2 1.6 Depth 0.60 m Jan 31 -- -- -- -- -- -- Mar 85/86/88 13.0 8.7 9.1 9.6 10.9 11.2 Apr 107/108 7.8 8.4 8.5 8.3 6.1 9.5 May 135 4.8 7.6 6.2 6.9 5.8 5.2 Depth 0.90 m Jan 31 -- -- -- -- -- -- Mar 85/86/88 --a -- -- -- -- -- Apr 107/108 4.3 -- 6.5 -- -- 8.4 May 135 2.7 5.1 -- 7.7 4.6 5.1b
Rate of decrease in ice strength (MPa/day)
Timeframe S2 S6 S10 A2 A6 A10 Depth 0.30 m Mar - Apr 0.44 0.18 0.13 0.34 0.35 0.41 Apr - May 0.09 0.14 0.14 0.08 0.22 0.08 Depth 0.60 m Mar - Apr 0.23 0.01 0.03 0.07 0.24 0.09 Apr - May 0.11 0.03 0.09 0.05 0.01 0.16 Depth 0.90 m Mar - Apr -- -- -- -- -- -- Apr - May 0.06 -- -- -- -- 0.12 a
strength not included because test was conducted too close to ice bottom
b
6.0
Location of Sampling Sites in Hummocked First-year Ice
One of the objectives of the Labrador field study was to locate sufficiently rough (or ridged ice) in which to install one of the temperature chains. Two people from Sikumiut Environmental Management, a local company, had already been contracted to assist with the fieldwork. They also provided information about where, and when, suitably ridged ice formed near Nain. In December 2003, CHC was informed that ridged ice had not yet formed near Nain, however ‘the ice conditions were likely to change’ before the first site visit was made in late-January. Ridged ice had still not formed when the first visit was made in late-January/early February. The temperature chain was installed in level ice at Site S7 instead.
During the second trip to Labrador, in late-March, Sikumiut mentioned that an area of rough ice had formed about 40 km east of Nain, between Whale Island and Skull Island (Figure 9). While it was unusual to have rough ice form so close to Nain, it was not exceptional (Sikumiut, personal communication). In late-March, the field party traveled to the edge of the rough ice, to investigate whether property measurements could be made in that area during the two remaining trips to Labrador (April and May). After traveling 1.5 hours by snowmobile, the field party reached their destination: the rough ice that had formed between Whale Island and Skull Island, at the edge of the level ice.
The photos in Figure 10 show the haphazard way in which ice blocks were piled in that area. Clearly the ice in that region needed a more apt descriptor than ‘rough’. According to the World Meteorological Organization’s (WMO) nomenclature, it classified as hummocked ice: ‘sea ice piled haphazardly, one piece over another, to form an uneven ice surface’. In this report, the ice between Whale Island and Skull Island will be referred to as hummocked ice.
10 km
Nain
Whale Island
Skull Island
1st sampling transect in level, landfast ice, Strathcona Run
2nd sampling transect in level, landfast ice, “Anaktalak Run” 4 sites sampled in hummocked ice H4 H3 H2 H1 H1 (6264309N, 0617321W), H2 (6264863N, 0618118W), H3 (6265467N, 0618888W), H4 (6266108N, 0619669W)
(a)
(b)
Figure 10 Rough ice between Whale Island and Skull Island
When the author returned to Ottawa on 29 March, CHC approached Transport Canada about their willingness to support field measurements in the hummocked ice. Transport Canada was very quick to respond. Since deformed ice has direct relevance to shipping, they provided the additional resources needed to sample the ice between Whale Island and Skull Island during the third and fourth visits to Labrador. Four sites were sampled in the hummocked ice in April, the location of which is shown in Figure 9 (sites are denoted by an ‘H’). Although it was hoped that the sites could also be visited during the fourth, and final, visit to Labrador in mid-May, that was not possible, as discussed subsequently.
7.0
Hummocked Ice: Its Development and Destruction
The Ice Charts that the Canadian Ice Service issues each week for the East Coast Region can be used to determine the extent of the landfast ice, information that is useful for determining the growth and recession of the ice edge. The Charts in Figure 11 show that the landfast ice near Nain changed dramatically during the winter of 2004. When the first visit to Labrador was made from 31 January to 3 February, the landfast ice consisted of thin first-year ice, young ice and grey-white ice. The edge of the landfast ice was several kilometres west of Whale Island (Figure 11-a) - ice had not yet formed between Whale Island and Skull Island.
By 01 March, the landfast ice extended beyond Whale Island and Skull Island (Figure 11-b). It is not known whether that ice was level or hummocked, however. Since the Ice Charts do not provide information about ice roughness, they could not be used to determine when the hummocked formed. Sikumiut suggested that, most likely, the rough ice in that area formed in mid-March, when the region experienced strong onshore winds (Sikumiut, personal communication).
When the second trip to Labrador was made in late-March, the Ice Charts showed that the ice edge was about 20 km east of Whale Island and Skull Island (Figure 11-c), as confirmed by the on-site reconnaissance that was conducted in late-March. During the reconnaissance, it was noted that the hummocked area of ice extended beyond Whale Island and Skull Island, as far as the eye could see.
Figure 11 Mapping the landfast ice edge with the CIS Ice Charts
(markers used to show two transects in level ice and the transect in hummocked ice)
(a) Feb 02 (b) Mar 01
(c) Mar 29 (d) Apr 19
(e) May 04 (f) May 10
The ice edge continued to extend eastward from 29 March to 19 April (Figure 11-c/d). On 19 April, four sites in the hummocked ice were sampled. Assuming that the hummocked ice formed in mid-March, as suggested by Sikumiut, the ice would have had about five weeks to consolidate before it was sampled in April.
Although the ice edge began to recede after 19 April, the ice between Whale Island and Skull Island remained intact (Figure 11-d/e). By 10 May, however, the ice edge had changed dramatically (Figure 11-f): the ice edge moved about 20 km west, which obliterated the four sampling sites. Sikumiut confirmed what the Ice Charts showed: the storm on the weekend of 9 May devastated the landfast ice edge, taking the four hummocked ice sites out to sea. It is interesting (indeed frustrating) to note that the fourth and final visit to Labrador on 11 May missed the hummocked ice sites by only a few days. That is why the landfast ice between Whale Island and Skull Island is described in this report as ‘quasi-stable’.
8.0
Properties of Hummocked Ice
The 1.5 hour transit to the hummocked ice went smoothly, however once in the rough ice, considerable attention was required to determine the best route around the haphazardly piled blocks of ice. The situation was exacerbated because the snowmobiles were pulling delicate field equipment (Figure 12-a). Due to the transit time, the limited amount of daylight, and the considerable effort that was required to conduct measurements in the hummocked ice only four sites were visited on the only day available for sampling: 19 April.
(a) Site H1 (0.99 - 1.17 m) (b) Site H2 (1.40 - 1.63 m)
(c) Site H3 (1.05 - 1.55 m) (d) Site H4 (1.14 - 2.20 m) 0.40 m high hummock
The photographs in Figure 12 show conditions at the four sampling sites. The first site, Site H1, was located in an area between the level ice and the beginning of the hummock field. The last sampling site, Site H4, was situated 4 km into the hummock field. As the hummocked ice was penetrated, the ice relief increased, as did the variability in snow and ice thickness. The ice at Site H1 was relatively smooth, had an ice thickness from 0.99 to 1.17 m, and snow depths from 40 to 150 mm (Figure 12-a). At Site H2, the ice was 1.40 to 1.63 m thick, and had a snow cover from 210 to 340 mm thick. The ice at Site H3 was 1.05 to 1.55 m thick, with snow depths from 260 to 480 mm. The fourth site, Site H4, provided the only opportunity to measure the properties of two, well-defined ice hummocks, as well as the surrounding 1.14 m thick apparently ‘level’ ice (Figure 12-d). The larger of the two hummocks was about 0.80 m high, had an ice thickness of 2.20 m, and a 460 mm thick snow cover. The smaller hummock was 0.40 m high, had an ice thickness of 2.00 m and had no snow cover.
8.1 Temperature Profiles of Ice in Hummock Field
As the sites were sampled, air temperatures steadily increased throughout the day. When Site H1 was sampled, the air temperature was -7.2°C (09:00 hrs), whereas the air temperature Site H4 was -2.1°C (17:00 hrs) as shown in Figure 13. -2.5 -2.0 -1.5 -1.0 -0.5 0.0 0.5 -8 -6 -4 -2 0 2 H4-h1 ('level') H4-h3 (sm. hummock) T_air (b) -2.5 -2.0 -1.5 -1.0 -0.5 0.0 0.5 -8 -6 -4 -2 0 2 H1 H2 H3 (a) T_air Ice depth (m)
Temperature of extracted core (°C)
Figure 13 Temperature of ice at (a) Sites H1, H2 and H3 and (b) Site H4 (depth zero indicates top ice surface, uppermost data marker shows air temperature)
Figure 13-a shows the ice temperature profiles measured from one of the cores extracted at Sites H1, H2 and H3. Temperatures were coldest in the uppermost surface of ice, to a depth of about 0.20 m. The ice was isothermal near its melting point below a depth of 0.40 m. Figure 13-b shows the ice temperature profile of two cores extracted from Site H4. At that site, temperature profiles were measured on two cores, to provide information about how the temperature of the ‘level’ compared to the hummocked ice. The ice temperature profile of the ‘level’ ice at Site H4 (H4-h1) was similar to the ice at Sites H1, H2 and H3: the uppermost 0.20 m of ice was colder than the ice below that depth. Temperatures in the 2.00 m thick hummock (H4-h3) were several degrees colder than the ‘level’ ice. The hummocked ice was isothermal below a depth of 1.20 m, compared to the 0.20 m depth in the ‘level’ ice.
8.2 Salinity Profiles of Ice in the Hummock Field
The ice salinity profiles for Sites H1, H2 and H3 were remarkably similar, except for the ice at Site H1 having a higher salinity in its bottom layer (Figure 14-a). Salinities ranged from 0‰ at the top ice surface, from 4 to 5‰ towards the interior of the ice, and up to 10.5‰ in the bottom layers of ice.
The ice salinity profiles for the two hummocks are shown in Figure 14-b. It should be noted that a full thickness core was not removed from either of the hummocks because the bottom of the core fell out of the core barrel, into the borehole, where it could not be retrieved. In general, the large hummock (H4-h2) had a profile similar to the ice sampled at Sites H1, H2 and H3. In comparison, the smaller hummock (H4-h3) had a much lower surface salinity, which is likely because its surface was exposed to the elements. A 460 mm layer of snow covered the larger hummock.
-2.5 -2.0 -1.5 -1.0 -0.5 0.0 0 4 8 12 H4-h2 (lrg. hummock) H4-h3 (sm. hummock) (b) -2.5 -2.0 -1.5 -1.0 -0.5 0.0 0 4 8 12 H1 H2 H3 (a) Ice salinity (‰) Ice depth (m)
8.3 Borehole Strength Profiles of Ice in Hummock Field
Figure 15 includes results from borehole strength tests in the hummocked ice, in terms of the average strengths measured in three boreholes, for a particular depth. Horizontal bars are used to show the standard deviation, or range, of strengths measured at the different depths. Adjacent to the data point is the number of tests conducted at that particular depth. The ice thickness in each of the three boreholes is denoted by cross-hatching.
In general, ice at the four sampling sites in the hummock field had strengths that were lower at the top and bottom surfaces than in the interior of the ice. Tests showed that the weakest ice occurred towards the bottom surface, where strengths were often 1.0 MPa, or less.
The strength profile for Site H4 was quite different than the strength profiles from the other three sites. That is because Site H4 included the only two- well-defined hummocks, whereas ice at the other three sampling sites consisted of relatively ‘level’ ice. Strengths at the 0.30 m test depth were lower in the two hummocks than they were in the more ‘level’ ice. Although results from
individual boreholes are not shown in Figure 15-d, the sails of the two hummocks were weaker than the ‘level’ ice at Site H4 (2.1 and 3.4 MPa vs. 7.6 MPa, respectively). The interior of the two hummocks at Site H4 was considerably stronger than the ‘level’ ice tested at all four sites. The ice interior at Site H4 had strengths from 9.8 to 11.6 MPa, whereas the highest strength in the ice interior at Sites H1, H2 and H3 was 8.9 MPa. Clearly, the bulk of the ice at Site H4 had greater integrity than ice at the three other sites in the hummock field.
-2.5 -2.0 -1.5 -1.0 -0.5 0.0 0 5 10 15 20 (d) H4 3 3 3 2 2 1 -2.5 -2.0 -1.5 -1.0 -0.5 0.0 0 5 10 15 20 (c) H3 3 3 3 2 1 -2.5 -2.0 -1.5 -1.0 -0.5 0.0 0 5 10 15 20 (b) H2 3 3 3 3 1 -2.5 -2.0 -1.5 -1.0 -0.5 0.0 0 5 10 15 20 (a) H1 3 3 3
In situ ice borehole strength (MPa)
Ice depth (m)
Figure 15 Strength of ice at four sites in hummock field
(number of boreholes tested indicated to right of standard deviation bar, cross hatches show ice thickness in three boreholes)
9.0
Strengths of Level and Sub-Arctic Ice, Compared to Arctic Ice
Figure 16 shows the strength of each of the three boreholes tested at the different sites, as a function of the time of year. In the figure, the strengths have been depth averaged, providing an indication of the bulk (full thickness) strength of the ice. The figure includes strengths measured at Sites S2, S6 and S10 in Strathcona Run, Sites A2, A6 and A10 in Anaktalak Run and Sites H1, H2, H3 and H4 in the hummocked ice.
0 5 10 15 20 50 100 150 200 250
Ice borehole strength, depth-averaged (MPa)
.
Julian Day
First-year ice in high Arctic (Johnston et al., 2000, 2001, 2002)
Feb-Mar April May June July Aug
S2, S6, S10
A2, A6, A10
H1 to H4
Figure 16 Seasonal decrease in borehole strengths for sub-Arctic ice and Arctic ice
Note that the depth-averaged strength of the ice in the hummock field was comparable to the strength of the level ice in Strathcona Run and Anaktalak Run, for the same time of year (April). That said, the range of strengths measured in hummocked ice (5.1 to 9.9 MPa) was larger than in level, landfast ice (5.8 to 8.6 MPa). The second point to note from the figure is that the borehole strength of the landfast ice in Strathcona Run and Anaktalak Run both decreased steadily from March to May.
Figure 16 also includes data obtained on first-year ice in the high Arctic (Johnston et al., 2001; 2002; 2003). Although not shown in the figure, Johnston and Timco (2003) note that the maximum strength of first-year ice in the Arctic is 29 MPa, and it occurs in mid-March, when the ice is coldest. In the sub-Arctic, the measurements showed that the highest strength of 14.7 MPa was measured in late-March, when the ice was coldest. Although the strength of sub-Arctic ice is considerably less than Arctic first-year ice (at the same time of year), the strength of the ice in both regions decreased in a similar manner. It is important to note that the trends were about two months out of phase: the strength Labrador first-year ice in late-March, was roughly equivalent to the strength that first-year ice in the Arctic in mid-May.
Figure 16 shows that the strength of Arctic first-year ice ranged from 1.7 to 4.5 MPa when the last strength tests were conducted in mid-August. In comparison, the strength of the Labrador ice ranged from 3.6 to 6.0 MPa when the last measurements were made in mid-May. From that it can be inferred that the Labrador ice could have been sampled until late-May, perhaps. However, it should be noted that locals could no longer travel on the ice in late-May 2004, and that by early June the ice in Strathcona Run had broken up (Sikumiut, personal communication).
Table 4 shows the three-hole average borehole strength from March to May, for the different sampling sites in level, landfast ice near Nain. By May, ice in Strathcona Run had decreased in strength by 48 to 75%, compared to the borehole strengths measured in March, and the strength of the ice in Anaktalak Run had decreased by 45 to 68%.
Table 4 Seasonal Decrease in Ice Borehole Strength
Mont h
Three-hole average of borehole strength, σ (MPa) Total reduction in strength a
March April May
S2 14.3 5.9 3.6 75% S6 9.8 7.7 5.1 48% S10 10.0 7.6 5.2 48% A2 10.9 7.0 6.0 45% A6 13.0 7.2 4.2 68% A10 11.6 7.2 4.0 66% a
= [(σMarch - σMay)/ σMarch] x 100
10.0 Conclusions
This report discussed the properties of level first-year sea ice near Nain. Property measurements were made from late-January to mid-May 2004. The ice thickness ranged from 0.41 to 0.65 m in February, and from 0.89 to 1.20 m in mid-May, when the last measurements were made. The ice thickness at four of the six sites increased by, on average, 2.0 to 9.9 mm/day from February to May. The ice thickness at the two remaining sites decreased from April to May, by 1.6 and 1.7 mm/day, on average.
The highest borehole strengths were measured in March, when the ice was coldest. The depth-averaged borehole strength at each site decreased by 45 to 75% from March to May. Results showed that, in general, ice strength decreased more rapidly towards the top and bottom surfaces than in the ice interior. Depending upon the site, and the particular test depth, the strength of the ice decreased by 0.01 to 0.44 MPa/day during the sampling period. The strength reduction was due to ice decay, clear evidence of which was provided by the deteriorated state of the extracted cores, the (near-melting) isothermal state of the ice and its reduced salinity.
In mid-April, four sites were sampled in quasi-stable area of hummocked ice, that was comprised of a matrix of relatively ‘level’ ice, interspersed with haphazardly piled blocks of ice. The ice surface relief increased as the hummock field was penetrated, as did the snow and ice thickness. Ice thickness at the first site ranged from 0.99 to 1.17 m, while ice at the fourth site was from 1.14 to 2.20 m thick.
Ice at the four sites was isothermal at near melting temperatures, with the exception of slightly colder temperatures (-2.5°C) in the top surface of one of the hummocks. Ice in the hummock field had minimal salinity at its top surface, salinities of 4 to 5‰ in the ice interior, and salinities upwards of 8‰ towards the bottom surface. The highest borehole strength was measured in the interior of the ice; the top and bottom ice surfaces had lower strengths. Although strengths at the first site in the hummock field were similar to the six level ice sites that were sampled closer to Nain, ice at the three sites in the hummock field was thicker, and had higher strengths, than the level landfast ice (for the same time of year).
The first-year ice near Nain experienced a seasonal decrease in strength similar to that observed in the high Arctic, however there were two main differences: (i) first-year ice in the Arctic attains a higher strength than ice in the sub-Arctic and (ii) strength of first-year ice in the sub-Arctic was about two months ‘ahead’ of the Arctic, in terms of the decrease in strength.
11.0 Acknowledgments
The success of the field program would not have been possible without the assistance of G. Dicker and R. Webb of Sikumiut Environmental Management. Appreciation is also extended to J. Rowell, formerly of the Labrador Inuit Association, for her interest in the project, for recommending personnel to assist with the measurements and especially for offering many first-class meals – much needed sustenance when working on the ice. Thanks also to C. Webb for allowing us to take over his garage as a work area, and to the Nain resident who loaned us his motor for our corer. Thanks to N. Sinha for use of the NRCC borehole indentor and to D. Boudreau for providing CHC with a first-rate coring device. Thanks are extended to Transport Canada, especially V. Santos-Pedro, for his interest and support in conducting field measurements of decaying ice. Due to his quick response, CHC was able to grasp the opportunity that Mother Nature provided for sampling hummocked ice. The financial assistance and support of R. DeAbreu, Canadian Ice Service, enabled temperature chains to be installed at two locations, and those data to be analyzed subsequently.
12.0 References
Blanchet, D., Abdelnour, R. and Comfort, G. (1997): Mechanical Properties of First-year Sea Ice at Tarsiut Island. J. of Cold Regions Engineering. Vol. 1. pp. 59-83.
Gauthier, M-F., De Abreu, R., Timco, G.W. and Johnston, M.E. (2002) Ice Strength Information in The Canadian Arctic: From Science To Operations. Proceedings of the 16th IAHR International Symposium on Ice, Dunedin, New Zealand, pp 203-210.
Langlois, D., DeAbreu, R., Gauthier, M.F., Timco, G.W. and Johnston, M. (2003): Early Results of the Canadian Ice Service Ice Strength Chart. Proc. 17th Int. Conf. on Port and Ocean Engineering under Arctic Conditions, Trondheim, Norway. Vol. 1, pp. 165 - 174.
Johnston, M., Frederking, R. and Timco, G. (2001) Decay-Induced Changes in the Physical and Mechanical Properties of First Year Ice. Proceedings 16th International Conference on Port and Ocean Engineering under Arctic Conditions, POAC’01, Ottawa, Canada, pp 1395-1404. Johnston, M., Frederking, R. and Timco, G. (2002) Properties of Decaying First Year Sea Ice:
Two Seasons of Field of Field Measurements. Proceedings 17th International on Okhotsk Sea and Sea Ice, Mombetsu, Hokkaido, Japan, pp 303-311.
Johnston, M., Frederking, R. and Timco, G.W. (2003) Properties of Decaying First-year Sea Ice at Five Sites in Parry Channel. Proceedings 17th International Conference on Port and Ocean Engineering under Arctic Conditions, POAC’03, Trondheim, Norway, Vol. 1, pp 131-140. Johnston, M. and Timco, G. (2003) Developing an Ice Strength Algorithm for Level, Landfast
First-year Sea Ice in the High Arctic. Technical report issued by the Canadian Hydraulics Centre, Ottawa, Ontario, Canada, CHC-TR-013, March, 2003, 21 pp.
Johnston, M. and Timco, G. (2004) Developing an Ice Strength Algorithm for Sub-Arctic Regions. Report CHC-TR-023 submitted to Canadian Ice Service, by Canadian Hydraulics Centre, March, 2004, 28 pp.
Johnston, M. and Timco, G. (2005) Validating the Ice Strength Algorithm for Sub-Arctic Ice with Field Measurements from Labrador. Technical report issued by Canadian Hydraulics Centre, Ottawa, Ontario, Canada, CHC-TR-032, March, 2005.
Rowell, J. and Metcalf, L. (2005) Sea Ice - Obstacle vs. Opportunity: Reconciling Two Views of Landfast Sea Ice. Proceedings of 18th International Conference on Port and Ocean Engineering under Arctic Conditions, POAC’05. Potsdam, New York, U.S.A. 20 - 26 June 2005, in print.
Sinha, N.K. and Nakawo, M. (1981) Growth of First-year Sea Ice in Eclipse Sound, Baffin Island, Canada. Canadian Geotechnical Journal. Vol. 18. No. 1. February, 1981. p. 17 - 23. Timco, G.W. and Johnston, M. (2003) Ice Decay Boundaries for the Ice Regime System:
Recommendations from a Scientific Analysis. NRC Report CHC-TR-009, TP14096E, Ottawa, Ont., Canada.
Sampling Methodology
Different property measurements were made at different sites, as listed in Table 1. The sampling methodology required using a motor driven, fibreglass corer to make three boreholes in the ice (0.15 m diameter), each at least 2.0 m apart. The ice thickness, freeboard and snow depths were measured at each borehole. The cores removed from the three boreholes were used to measure either the temperature profile of the ice, or the salinity profile of the ice.
Ice Temperature
Ice temperatures were measured with a calibrated Fluke 73 multimeter, with an attached 80T-150U temperature probe. The temperature probe was inserted into small holes that had been made in the core at intervals of 200 mm (100 mm for the thinner ice in February). It should be noted that, when the temperature of the ice approaches its melting point, the accuracy of the probe decreases to – 2°C.
The in situ temperature of the ice at Site S7 and Site A1 was measured by freezing temperature chains into the ice (Figure 2). Each temperature chain measured the temperature of the air, snow and ice at 30-minute intervals. A digital data logger recorded the measured temperatures from 1 February, when the chains were installed, until 14 May, when the chains were removed (Johnston and Timco, 2005). The temperature chain at Site S7 measured the temperature of the ice at depth intervals of 200 mm, to a depth of 1.4 m. The chain at Site A1 (which was initially intended for ridged ice) measured the ice temperature at 100 mm depth intervals to an ice depth of 0.30 m, and at 200 mm intervals below that depth.
Ice Salinity
The salinity of the ice was measured by cutting small pie-shaped discs, about 20 mm thick, from the core at 200 mm intervals (100 mm intervals in February). The sections were cut and bagged as quickly as possible to minimize brine drainage. After the bagged samples had melted, at room temperature, an Orion model 105A portable conductivity meter (accuracy 0.5%) was used to measure the salinity of the melt water.
The salinity of the underlying seawater was measured in each borehole using a small bottle, with an attached rod. The borehole was first cleared of any ice left floating in the hole. The small bottle was then plunged about 0.50 m below the water, to minimize the amount of ice debris that was collected from each hole. The salinity of the seawater was measured after the sample had reached room temperature.
Borehole Strength
Once a borehole had been made in the ice, and its core had been processed, the ice strength in the borehole was measured at depth intervals of 0.30 m, until the bottom of the ice was reached. The NRCC borehole indentor was used to measure the in situ confined compressive strength of the ice. The NRCC borehole indentor consists of a high-strength stainless steel hydraulic cylinder with a laterally acting piston and two indentor plates, both of which are curved to match the wall of the borehole (Sinha, 2005). A 10,000 psi electro-hydraulic pump, with an average flow rate of 20 in³/min, was used to activate the two pistons inside the body of the indentor and extend both indentor plates.
Throughout the tests, an external digital data acquisition system was used to record the displacement of each indentor plate and the oil pressure. While the pressure during a test was monitored using a dial gauge, a handheld keypad was used to provide output the indentor displacement. That ensured that the 10,000 psi capacity of the system and the 50 mm total diametrical displacement of the indentor plates were approached, but not exceeded. The indentor plates were fully retracted after each test, the borehole indentor was rotated 90° and the test unit was lowered to the next depth.
The ice borehole strengths in this report used a conversion factor of 0.56 to convert the measured oil pressure to an ice pressure. The conversion factor was determined from the ratio of the area on which the hydraulic fluid acts (3768 mm²) to the surface area of the indentor plate (6692 mm²). All ice borehole strengths are given for an indentor penetration of 3 mm (Johnston et al., 2001) and are compensated for the stress-rate effect using the procedure outlined in Johnston et al. (2003). Studies have shown that the ice borehole strength is almost twice that of the confined compressive strength of the ice measured in the laboratory (Sinha, 1986) and three to four times greater than the ice strength measured in unconfined tests (Masterson, 1996; Sinha, 1986).
References
Johnston, M., Frederking, R. and Timco, G. (2001) Decay-Induced Changes in the Physical and Mechanical Properties of First Year Ice. Proceedings 16th International Conference on Port and Ocean Engineering under Arctic Conditions, POAC’01, Ottawa, Canada, pp 1395-1404. Johnston, M., Frederking, R. and Timco, G.W. (2003) Properties of Decaying First-year Sea Ice at
Five Sites in Parry Channel. Proceedings 17th International Conference on Port and Ocean Engineering under Arctic Conditions, POAC’03, Trondheim, Norway, Vol. 1, pp 131-140. Johnston, M. and Timco, G. (2005) Validating the Strength Algorithm for Sub-Arctic Ice with
Field Measurements from Labrador. Report CHC-TR-032, submitted to Canadian Ice Service, Ottawa, Ontario. March 2005, 46 p.
Masterson, D. (1996): Interpretation of In Situ Borehole Ice Strength Measurement Tests. Can. J. Civ. Eng. Vol. 23. pp. 165- 179.
Sinha, N.K. (1986) “The Borehole Jack: Is it a Useful Tool?” Proc. of 5th Int. Offshore Mechanics and Arctic Engineering Symp. (OMAE). Tokyo, Japan. 13 – 17 April 1986. Vol. IV. pp. 328 – 335.
Sinha, N.K. (2005): NRCC Borehole Indentor: Measuring Ice Strength. Proceedings of 18th International Conference on Port and Ocean Engineering under Arctic Conditions, POAC’05. Potsdam, New York, U.S.A. 20 - 26 June 2005, in print.
1 . T ra nsport Ca na da Public a t ion N o. N de la public a t ion de T ra nsport s Ca na dao
2 . Proje c t N o. - N de l'é t udeo
3 . Re c ipie nt s Ca t a logue N o. N de c a t a logue du de st ina t a ireo
4 .T it le a nd Subt it le - T it re e t sous-t it re 5 . Public a t ion Da t e - Da t e de la public a t ion
6 . Pe rform ing Orga niza t ion Doc um e nt N o. N du doc um e nt de l'orga nism eo
7 .Aut hor(s) - Aut e ur(s) 8 . T ra nsport Ca na da File N o.
N de dossie r de T ra nsport s Ca na dao
9 .Pe rform ing Orga niza t ion N a m e a nd Addre ss - N om e t a dre sse de l'orga nism e e x é c ut a nt 1 0 . DSS File N o. - N de dossie r - ASCo
1 1 . DSS or T ra nsport Ca na da Cont ra c t N o.
1 2 .Sponsoring Age nc y N a m e a nd Addre ss - N om e t a dre sse de l'orga nism e pa rra in 1 3 . T ype of Public a t ion a nd Pe riod Cove re d Ge nre de public a t ion e t pé riode visé e
1 4 . Sponsoring Age nc y Code -Code de l'roga nism e pa rra in
1 5 . Supple m e nt a ry N ot e s - Re m a rque s a ddit ione lle s 1 6 . Proje c t Offic e r - Age nt de proje t
1 7 .Abst ra c t Ré sum é TP 14387 E March 2005 CHC-TR-031 M. Johnston Technical report Properties of Level Landfast Ice and Hummocked Ice near Nain, Labrador
Propriétés de la glace plane et hummockée provenant de la banquise côtière près de Nain, au Labrador
Canadian Hydraulics Centre National Research Council Ottawa, Ont., K1A 0R6 Canada
Transport Canada 330 Sparks St. Ottawa, Ont. K1A 0N8
V.M. Santos-Pedro
This report discusses property measurements that were made on level first-year sea ice near Nain, from early February to mid May 2004. Ice thickness ranged from 0.41 to 0.65 m in February, and 0.89 to 1.20 m in mid-May. The highest borehole strengths were measured in March, when the ice was coldest. Results showed that, in general, ice strength decreased more rapidly towards the top and bottom surfaces than in the ice interior. The strength reduction was due to ice decay, clear evidence of which was provided by the deteriorated state of the extracted cores, and changes in the temperature and salinity of the ice.
Measurements are also given for hummocked ice sites that were sampled in a quasi-stable area of landfast ice, in April. The ice surface relief increased, as did the ice and snow thickness, as the hummock field was penetrated. Ice thickness at the first site ranged from 0.99 to 1.17 m, whereas ice at the fourth site ranged from 1.14 to 2.20 m thick. The hummocked ice was isothermal at near melting temperatures throughout its full thickness. The ice salinity was minimal in the top ice, ranged from 4 to 5‰ in the ice interior, and was upwards of 8‰ towards the bottom ice. The highest borehole strength was measured in the interior of the ice. On average, the hummocked was thicker and stronger than the level landfast ice (for the same time of year).
Dans ce rapport on analyse des données de terrain, recueillies près de Nain à partir du début de février jusqu'à la mi-mai 2004, sur les propriétés de la glace de mer plane de première année. L'épaisseur de cette glace variait de 0,41 à 0,65 m en février, et de 0,89 à 1,20 m à la mi-mai. La résistance de la glace, mesurée dans des trous de sondes, était la plus élevée en mars alors que sa température était la plus basse. Les résultats indiquent en général une réduction plus rapide de la résistance près des surfaces supérieure et inférieure qu'au centre. Cette réduction de la résistance est attribuée à la décomposition de la glace, mise en évidence par des signes de détérioration dans les carottes, et à des changements de la température et de la salinité de la glace.
On présente également des données provenant de sites de glace hummockée qui ont été échantillonnés en avril dans une zone presque stable de la banquise côtière. Le relief à la surface de cette glace s'accentuait au fur et à mesure que l'on pénétrait dans le champ de hummocks, alors qu'on observait aussi une augmentation de l'épaisseur de la glace et de sa couverture de neige. L'é paisseur de la glace sur le premier site variait de 0,99 à 1,17 m; sur le quatrième site, elle variait de 1,14 à 2,20 m. La température de la glace hummockée se situait près du point de fusion sur toute son épaisseur. La salinité était minime dans la partie supérieure, variait de 4 à 5 ‰ au centre et excédait 8 ‰ près de la surface inférieure. La résistance la plus élevée a été mesurée dans la partie centrale du couvert de glace. En moyenne, la glace hummockée était plus épaisse et plus résistante que celle de la banquise côtière (durant la même période de l'année).
PUBLICATION DATA FORM - FORMULE DE DONNÉES SUR LA PUBLICATION
1 8 .K e yw ords - M ot s-c lé s 1 9 . Dist ribut ion St a t e m e nt - Diffusion
2 0 . Se c urit y Cla ssific a t ion (of t his public a t ion) Classification de sécurité
(de c e t t e public a t ion)
2 1 . Se c urit y Cla ssific a t ion (of t his pa ge ) Cla ssific a t ion de sé c urit é (de c e t t e pa ge )
2 2 . De c la ssific a t ion (da t e ) Dé c la ssific a t ion (da t e )
2 3 . N o. of Pa ge s N om bre de pa ge s
2 4 . Pric e Prix