LIBRARY OF THE MASSACHUSETTSINSTITUTE
^
WORKING
PAPER
ALFRED
P.SLOAN SCHOOL
OF
MANAGEMENT
Research Program on the Management of Science andTechnology
CHARACTERISTICS AND IMPLICATIONS OF FORECASTING ERRORS IN THE SELECTION OF R&D PROJECTS
Dennis L. Meadows March. 1968 Donald Go Marquis #313-68
MASSACHUSETTS
INSTITUTE
OF
TECHNOLOGY
50MEMORIAL
DRIVE
Research Programon the Management of Science andTechnology
CHARACTERISTICS AND IMPLICATIONS OF FORECASTING ERRORS IN THE SELECTION OF R&D PROJECTS
Dennis L. Meadows DonaldG. Marquis
March, 1968 #313-68
Paper delivered by DennisMeadows at
The Second Annual Technology andManagement Conference
March 21, 1968, Washington, D. C.
The research was supported in part by a grant from the National Aeronautics and Space Administration.
qi<arapterls<;iys a«d taplicatl^wg of Forecasting Errors in the
Selection of R&D Projects
by
Dennis L. Meadows* and DonaldG. Marquis*
Abstract
Tounderstand the forecasting errors whichmust be accommodated by formal project selection models, this study investigates the relation between initial forecasts and actual outcomes in industrial product devel-opnent programs. The following conclusions are based on data from 144 pro-jects In five commercial laboratories and from computer simulations with one model of a typical devdnryment project effort.
1. The most accurate initial forecasts of project cost explain only 25 percent of the variance in actual costs. Initial estimates of proba°> bility of technical or commercial success do not usefully distinguish among projects which have different degrees of success
,
2. Unsuccessful projects cost more and incur greater cost overruns on the average than do projects resulting in commercially successful products
3. The average magnitude of cost overruns and the rate of conmercial success depend in part on the functional source of the project.
4. Errors in the forecasts currently employed to select projects lead CO Che expendicure of more than 50 percent of the firm's development budget on technically or commerciallyunsuccessful projects.
* Instructor, Sloan School of Management, M.I.T.
^
Professor of Management, Sloan School of Management, M.I.T,INTRODUCTION
Management's typical reaction to any proposal for a formal
techno-logical forecasting system is that the accuracy of the forecasts does
not justify the cost of the system. Forecasts are inaccurate. There
is little quantitative research into forecasting errors, but the few studies whichhave been conducted, together witha great deal of
mana-gerial experience, suggest that errors are often large. Occasionally
they are catastrophic. Proponents of integrated long range
technologi-cal forecasting systems cannot deny this. They can only suggest that
systematic consideration of alternatives, automated handling of the vast
quantities of relevant data, and comprehensive consideration of important interrelationships together offeran improvement over management's more
intuitive and ad hocapproach to forecasting and planning. Such
reason-ing has obvious merit, but it will lack real imperative until it is
accompanied bya more systematic investigation of the errors actually
inherent in forecasts and of their implications for the forecasting
techniques currently proposed.
The infrequent use of quantitative procedures for forecasting the
value of alternative development projects illustrates this point. Formal
project selection models were the first technological forecasting
pro-cedures to receive wide attention in the management science literature.
A 1964 survey of project selection techniques discovered over eighty
different proposed forecasting methods (Baker &Pound, 1964), The
re-search revealed, however, that there was little implementation of any
created the problem of forecast accuracy. Other evidence supports this
conclusion (Kiefer, 1965).
More recent proposals for project selection formulas and for other
technological forecasting techniques still have not considered the
effects of the errors in the forecasts upon which they are based. A
few studies have explicitly treated the problem of forecasting accuracy
(Marshall & Mecklin, 1962; Peck & Scherer, 1962). They have, however,
compiled only post-mortems by calculating differences between initial
estimates and final outcomes. Implicit in such "before -after" research
is the assumption that forecasts and outcomes do not interact in the
process of technological development and transfer. The following is a
more realistic representation.
DECISION RESOURCE
sions based on the forecasts lead to the allocation of the laboratory's
resources among alternative projects. After delays inherent in the
de-velopment process, this expenditure results in technical achievements.
Management attempts to monitor this progress, but there are delays, noise
and often deliberate bias in both the formal and the informal
communica-tion channels of the laboratory. These factors together with initial
errors in the forecasts lead to differences between management's
obser-vations and its expectations. Those differences typically lead to
re-vised forecasts and new decisions designed to decrease the difference
between perceived and forecast or desired results. Most research
man-agers have personally witnessed this interaction between forecast and
error in some project where the expected and actual cost leapfrogged
each other upwards while the project's technical solution appeared always
just around the corner. Obviouslyabefore-after analysis of
forecast-ing error does not fullycharacterize the errors insuch a system as
that illustrated above.
The continuous sequence of
forecast-decision-results-errors-fore-cast constitutes a feedback loop, a fundamental structure Inherent in
thecontrol of all physical and social systems. It is through a plexus
of feedback loop structures like that inFigure 1 that forecasting tech
niques and their associated errors affect the performance of the firm.
If we are to understand the implications of errors, they must be viewed
in the context of this feedback loop structure.
Several members of the M.I.T. ResearchProgram on the Management
of Science andTechnology have begun to study the characteristics and
-4-among alternative development projects. I will present two aspects of
that work: data on the errors which actually occur in
industrial-development -or ieated forecasts and results from computer simulations
whichtrace the effects of such forecasting errors as they are
propa-gated through the decision loop networks of the laboratory.
The specific characteristics of laboratory decision loops will
vary from one firm to another, but the decision feedback loop structure
underlying industrial development activity is quite general. Individual
laboratory differences can easily be accommodated by statistical and
simulation techniqueso It is thus already possible to generalize some
results of the research, and I will point out several significant
con-clusions. I must emphasize, however, that the real importance lies with
this approachto forecasting. Thus Iwill stress the procedures as much
as the conclusion* whichhave so far resulted from the work. Before the
potential of technological forecasting systems can be fully realized,
each firm must study the process by which it plans and allocates its
own resources in the development of new technology.
ACTUALERROR CHARACTERISTICS
The before-after approach to estimate error does not completely
assess the characteristics of errors ina firm's forecasting procedures.
It does, however, indicate the magnitude of the errors which
forecast-ing proceduresmust accomnodate. If there are sufficient data it may
also reveal statistical relations between error magnitude and
-5-useful inputs Coany dynaraic model of error and project performance.
Thus wc have Included this approach as the initial phase in our study.
We have studied four firms indetail. Their forecasting per/ rmance
will be analyzed here. Data from a fifth firm, studied by Mansfield
and Brandenburg (1966) will be included to check the generality oii ur
findings
.
Data Sources
Three of the laboratories are in chemical companies engaged
pri-marily in the development, production and sale of industrial intermedin
ates. Two of the chemical firms, A and B, have between $100 and $300
million annual sales. The third is one of the largest firms in the
nation. The fourth laboratory, called here the Electronics Laboratory,
Is maintained by an Instrumentationcompany to engage in work of
inter-est toNASA and the Department of Defense. The fifth set of project
data comes from theMansfieldstudy of the central research unit Ina
prominent equipment manufacturer,
Data from each of the five laboratories were obtained from three
sources. The initial estimates of project cost, probability of
techni-cal success, and probability of commercial success, when available,
were obtained from project evaluation forms completed at the time each
project was first approved for funding. Accounting records supplied
the actual costs, and the leader of each project Indicated whether the
project had eventually been technically and/or commerciallysuccessful.
Datawere obtained on 144 completed projects, whichwere divided
Miscellaneous failure: The project was closed out because of manpower shortages, changes In the market objectives of the firm, or other non-technical reasons. The project did not result in a product.
Technical failure: The project was closed out when unforeseen technical difficulties prevented the development program from producing the desired product.
Commercial failure: The project did produce the product Ini-tially desired but the product was not sold.
Commercial success: The project was technically successful, and the product did produce sales income for the firm.
With the exception ofChemical Laboratory B, no attempt was made to rank projects on the basis of their technical or commercial perfor-mance- The definitions above do not apply to the projects in Chemical Laboratory C where only the estimated and actual costs for one year's
development on eachproject were available.
The data from each laboratorywere analyzed to determine the
mag-nitude of the forecasting errors associated with each project and to
discover significant relations between those errors and other attributes
of the laboratory. The conclusions from this workare listed below and
then followed by a detailed presentation of the data and the analyses
which lead to them.
Conclusions
(1) There is a very low correlation between the values of actual and estimated cost, probability of technical success and probability of
commercial success employed in selecting development projects.
(2) There Is a pronounced tendency for technically and commer-ciallyunsuccessful projects as a group to incur greater cost overruns
-7-than cnmmercially successful projects.
(3) The average magnitude of cost overruns and the rate of com* merclal success may differ dependiagupon the sources of the project
idea.
(4) Technicallyand commercially unsuccessful projects cost more on the average than commercially successful projects.
(5) Forecasting error typically leads management to expend more than 50 percent of a firm's development resources on projectswhichdo
not produce commercially successful products.
(6) Forecasting errors are influenced by the laboratory's organ-izational form.
Discussion
(1) There is a very low correlation between the values of actual and estimated cost, probability of technical success and probability
of commercial success employed in selecting development projects.
Cost Estimates
In Chemistry Laboratories A and B, the cost of successfully
meet-ing the technical requirements of a project is predicted before deciding
whether it should be funded. The actual costs of projects which were
technically successful can thus be compared with the initial estimates
to obtain one measure of the error in those estimates. Figures 2 and 3
compare initial estimates with actual costs for each of the two
100 70 50
40
30 20 10 8 6 5
-10-from those initially forecast. Where there are deviations of this type,
it has been suggested that a linear formula:
Actual cost = a + (b) (estimated cost)
be employed to modify the initial estimates, correcting for the errors
inherent in them (Fisher 1963). It is easy to determine statistically
the "best" linear formula for any given set of historical data, but
many factors not explicitly considered can limit the predictive ability
of such an equation by causing some deviation of the actual costs from
the modified estimates. The correlation coefficient (r) measures this
2
deviation. The quantityr indicates the percent of the variance in
actual costs which is explained by the modified estimates. If r
(con-sequentlyr ) is low, the estimates will be of little use in predicting
actual costs. The correlation coefficient for each set of projects is
given on the corresponding figure. The most accurate estimates, those
inChemical LaboratoryA, explain only 25 percent of the variance in
the actual project costs evenwhen these estimates are modified with
the best linear correction formula for that particular set of data.
In Chemistry LaboratoryC project costs are predicted for only
one year at a time. The uncertainty in annual cost estimates should be
substantially less than that in the initial estimates of total project
costs. The estimates were found, however, to account for no more than
57 to 74 percent of the variance in actual costs
.
Historical data on cost forecasting accuracymayalso be expressed
in the form of cumulative frequency distributions. Figures 4 and 5
pre-sent the cumulative frequency curves of cost overruns among the projects
- 11
12
-13-as indicated by dotted line "1", 38 percent of the projects were
com-pleted without incurring cost overruns. For those projects the ratio,
actual cost/estimated cost, was less than or equal to 1.0. Similarly,
75 percent of the same projects were completed at less than or equal to
2.4 times the initially forecast development cost (dotted line 2). This
representation of historical errors has particular value inevaluating
the utility of forecasting models. Its use in this role willbe discussed
later
.
Probability Estimates
The staffs of Chemical LaboratoryA and the Equipment Laboratory
estimate the probability of technical success and the probability of
connercial success of eachdevelopment project before deciding whether
or not it should be funded. The estimated values are employed by
manage-ment as if they characterized a binomial process. For example, of all
the projects which receive the initial estimate PTS = 0.80, 80 percent
are expected to be technically successful.
Probability estimate errors are more difficult to measure than
cost estimate errors. Anumerical overrun ratio can be employed to
indicate the error in an estimated cost figure. There is no equivalent
measure of probability estimate error. Whena coin lands with one side
up on eight of ten toses, it does not necessarily disprove the initial
estimate that the probability of that side landing up is 0.50.
Simi-larly, a deviation between the fraction of projects whichactually succeed and the probability of technical success initially assigned a
-14-been in error. A deviation of the fraction actually successful from
that expected on the basis of the initial forecast is particularly
likely to occurwhen there are only a few projects in the group. Thus
only statistical measures of probability estimate error are useful.
To measure the accuracy of the probability of technical success
estimates inChemistryLaboratory A, all projects were divided into
classes according to the probability of technical success values
ini-tially assigned (horizontal axis of Figure 6). The fraction of each
group which actually succeeded was determined from the data, and these
fractions are indicated by the vertical white bars. Finally, that
fractionactually technically successful was usedto calculate limiting
values of the true probability of success which the staff attempted
initially to forecasts From the fraction actually successful in each
set of projects, an interval was fouadwhich has a 50 percent probability
of including the true but unknown, probability of technical success.
These 50 percent confidence Intervals are shown in Figure 6 as shaded
bands. Although the procedure Is complicated, it is not difficult to
Interpret the results. If the estimates are accurate, about half of
the shaded bands should cross the line indicating the expected fraction
successful.
The measurement of probability of commercial success differs from
the above in only one respect. Each estimate of probability of
commer-cial success was based on the assumption that the project would be
tech-nically successful; i.e., that it would result ina marketable product.
Thus only the 23 technically successful projects are included in the
16-
-17-accuracy to be measured for only 20 projects. It is apparent that
neither the forecast probability of technical success nor probability
of commercial success distinguish usefully between the more and the
less successful projects. The results also tend toconfirm laboratory
managers' belief that market estimates are less reliable than technical
estimates (Seiler, 1965, p. 177).
Mansfield and Brandenburg (1966) assigned a different meaning to
the Equipment Laboratory probability of technical success estimates.
Thus their analysis of estimate error differs from that described above.
Nevertheless, they too conclude that "although there is a direct
rela-tionship between the estimated probability of success and the outcome
of a project, it is too weak to permit very accurate predictions" (1966,
p. 462).
(2) There is a pronounced tendency for technically and commercially unsuccessful projects as a group to incur greater cost overruns
thancommercially successful projects.
Whenprojects are grouped according to their outcomes, the ratio
of totalactual to total estimated costs for the unsuccessful projects
of each laboratory is found to be greater than for the corresponding
group of successful projects. This finding applies to the three
lab-oratories inwhich the necessary data were available, and it appears
to be independent of the average size of the projects undertaken by
the laboratories. It will be explained later in terms of the decision
structure underlying the allocation of resources to development
pro-jects. Table 1 shows the average cost overrun for each category of
-18-TABLE 1
Average Cost Overrun by ProjectOutcome
•19-TABLE 2
Average Cost Overrun by Project Source
Chemical Laboratory B Source of Project Idea Laboratory Marketing department A Actual Cost Average Estimated Cost 2.20 2.02 la27
The different overruns inTable 2 probably correspond to the
magnitude of technological advance attempted in each group of projects.
Customers would tend to request only product modifications, while
lab-oratory personnel are inclined to suggest more difficult technical
problems. The marketingstaff would presumably fall between the two
extremes. This interpretation is supported by a study of military
de-velopment projects conducted by Marshall and Mecklin. Twenty-six
pro-grams were divided into three categories according to the magnitude of
the technological advance each attempted. The cost overrun factors
were 1.4 for small, 1.7 for medium, and 3.4 for large technological
advances (Marshall &Mecklin, 1962, p.472)
.
Rate of Success
Projects in Chemistry Laboratory Bwhich were initiated at the
suggestion of customers have amuch greater probability of commercial
-20-or the laboratory. Table 3 gives the percent of each project class
which resulted in no sales, small, medium, or large sales. The
expendi-ture on projects from each source is also included in the table. Taken
together. Tables 2 and 3 suggest that the magnitude of uncertainty
asso-ciatedwith a development project maybe related to the project source.
TABLE 3
Coomercial Outcome by Project Source
Chemical Laboratory B
Incremental Sales
.21-TABLE 4
Average Project Cost by Project Outcome
Project Outcome Miscell. failure Technical failure Conmercial failure Commercial success
-22-TABLE 5
LaboratoryInvestnent In Unauccessful Projects
Project Outcome Miscell. failure Technical failure Commercial failure Commercial success
-23-deve lopment work is actually carried out, but it is supported by the
research results available on forecasting errors.
Chemical Laboratory C underwent a thorough reorganization during
the course o£ our study. Initially the laboratory was organized along
scientific disciplines. All workwas channeled through a steering
committee composed of top laboratory and corporate personnel. The
re-organization placed control of most development decisions with
product-oriented business teams composed of technical, production and marketing
representatives. Data are available on the forecasting accuracy of
the laboratorystaff two years before and two years after the
reorgan-ization. Althoughthe data represent cost forecasts by the same
labor-atory personnel for roughly comparable projects, there is a slgalficaat
improvement in the accuracy of forecasts after the reorganization.
Research by Rubin (1967) on government sponsored development
pro-jects also indicates the relation between forecasting accuracy and
laboratory organization. The cost and schedule overruns in 37
develop-ment projects averaging four million dollars in totalcost were measured.
Work on 20 of the projects was controlled withPERT procedures; 17
lab-oratories used some other procedure. Seventy-one percent of the
lab-oratories not using PERT incurred overruns, only 40 percent of the
laboratories using PERT incurred similar overruns.
Generality of the Errors
We are accumulating data from other laboratories, but those
in-cluded in the sample above are considered technical leaders by their
dis-
-24-miss the seemingly poor esclmatlng performance as the result of inept
technical staff or poor management. Neither can the errors be attributed
to the relatively poor predictability of the particular parameters
studied. Probability of technical success and project cost are the
two parameters which laboratory managers feel they can forecast most
accurately (Seller, 1965, p.177). Thus it is expected that similar
errors will be found to characterize most of industry's short term
tech-nological forecasts. The data above are taken from four different
in-dnrtries and they represent projects whichdiffer greatly both in size
and in the amount of technological advance attempted. It appears likely
therefore that most firms are confronted with similar errors in the
technological forecasts uponwhich their development decisions must
be based.
IMPLICATIONS OF FORECASTINGERRORS
Information on the characteristics of errors inshort run
fore-casts is useful only to the extent that its effect on the performance
of the firm and, indirectly, on the technological forecasting procedures
can be determined. The implications of any errors will dependupon the
way inwhich the forecasts are employed. The project cost and product
sales forecasts typically are used in two ways; (1) to select among
alternative projects on the basis of their forecast profit, and (2)
to schedule the effort of the laboratory personnel, i„e. to determine
how many projects may be undertakenand to assign the available
25-when forecasts are used in the first role. Tomeasure the impacu of
inaccuracy on scheduling decisions, however, we must return to the
notion of the decision feedback loop structure underlying laboratory
management
.
Forecasts for Selecting Projects
In forecasting profitability, the effects of errors are quite
straightforward. Simple arithmetic will reveal for those projects
undertaken the decrease in profits which stems from development cost
overruns, over-optimistic sales forecasts, or projects terminated
before they produce a marketable product. Elimination of the errors
in predicting technical and commercial success would permit the firm
tocut its development expenditures by 50 percent or more without any
decrease in the generation of new products
.
It is important to distinguish insuch analyses between contract
and market -oriented development. In fixed price or incentive contract
researchwith noproduction follow ons, sales forecasts are not
rele-vant. Cost estljnate errors will, however, bean important determinant
of the firm's profit. Cost forecasts in error byas muchas 400 percent
have been found; these would have tremendous impact on the
contract-oriented laboratory.
In commercial development programs, the situation is reversed.
Costing errors are relatively unimportant. Development costs are
typi-callya small percentage of the profits froma successful product, and
cost overruns of even 100 or 200 percent will not generally be Important
in comparison to the profit. However, even small errors in the sales
-26-When aslnga fonnnia or other quancltatlve procedure to forecast
theprofit of a proposed project It is important to know the confidence
which may be placed in the forecast. Error research similar to that
presentedabove, when carried out bya firm on the records of
develop-mentprojects it has recently completed, will permit management to
cal-culate approximate confidence intervals for the forecasts it currently
is employing. The information required for these calculations can most
usefully be supplied in the form of the cumulative frequency curves
.
Figures 4 and 5 give the cumulative frequency distributions of
different cost forecasting errors among the projects already completed
inChemical Laboratory A and B. Similar curves could be constructed for
sales estimates or any other quantitative forecasts forwhich the actual
outcomes can be presently measured. To the extent that projects under
consideration ar6 similar to those completed by the firm, the historical
cunailative frequency curves maybe taken as good indications of the
errors likely to be found in current forecasts. Under these circumstances
it would become possible to construct history-based confidence
inter-vals about the current forecasts.
One simple examplemay illustrate the use of cumulative frequency
data in this way. Suppose the director of Chemical Laboratory Bhas
been given an estimate of $10,000 for the development cost of a project
currently under consideration for funding. If it were undertaken, the
projectwould be conducted by the same personnel who were involved in
the completed projects represented in Figure 5. The new product
con-cept is also based on the same general fund of technical expertise as
the completed projects. Thus the manager expects the forecast cost
-27-Figure 5 shous chat 23 percent of the completed projects in
Chem-ical Laboratory Bexceeded their initially estimated cost by 240
per-cent (dotted line 2). The manager could thus assign a probability of
.25 to the chance that the new project would ultimately cost more than
$24,000. Similarly, he would assign avalue of 0.38 to the probability
that the new project would cost less than the $10,000 forecast (docced
line 1), and a value of 0.25 to the probability that itwould cost less
than $8,000 (dotted line 3). The chances of other errors i-jsy similarly
be determined from the cumulative overrun curve.
This technique may be extended to formulas which incorporate more
than one potentially inaccurate forecast. For example, the commonly
used Expected Profitability Ratio:
Expected profit ratio = (FTS)(PCS)(»et profit) /(dev. cost)
PCS=Probability of commercial success PTS=Probability of technical success
maybe treated in the same manner. It is only necessary that
cumula-tive error frequency curves have been determined for each of the
fore-casts used in the calculation, and that the forecast and project be
similar to those forwhich past data are available. The utility of
the procedure can be determined in each laboratory only by trial. In
general, however, the calculation of history-based confidence intervals
will provide useful information on the implications of errors in the
-28-Porecaats for SchedulingPersonnel
It is not as easy to determine the implications of errors
in-herent in the forecasts whichare used to schedule the laboratory's
re-sources, for there the feedback loop structure of decision naking
be-comes especially important. The simple decision loop in Figure 1may
be elaborated to represent the information feedback structure
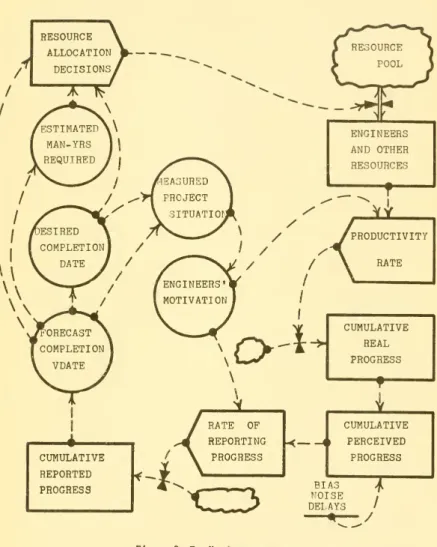
underly-ing the schedulunderly-ing of resources in development projects. Figure 9 reprfr
sents a development program inwhichman-hours are the principal input
and cost.
Bersonnel are initiallyallocated to the project on the basis of
the desiredcompletion dateand the estimated total man-hour
require-ments of the technical task. Because the desiredand the forecast
completion date are laitially the same, the engineers' motivation and
hence their productivityare somewhat less than that obtainable under
conditions of extreme schedule pressure. There will typically be more
tine wasted or spent on unnecessaryengineering refinements than ina
crash program.
The number of engineers assigned to the project, their technical
competence, and their level ofmotivation together determine the rate
of progress toward the technical objectives of the project. Technical
progress is generally difficult to quantify, however, and social
com-municationsystems all have inherent delays and errors. Additional
errors and bias are Introduced by the attitudes and the motivations of
the engineers and their immediate supervisors. The technical personnel
know the current schedule and the rewards and penalties associatedwith
-29-CUMULATIVE
REPORTED
PROGRESS
Figure 9 Feedback Loop Structure of Project Management Declaloaa (modified from an
-30-with their perception of the actual progress will influence the problems
asd the achieveaents which they report to the laboratory management
.
Whether cumulative progress is monitor informally or through some
pro-cedure like PERT, management will generally be forced'at some point
doriAg the project to revise the forecast completion date. Faced with
a project slip, managementmay revise the desired completion date,
assignmoremen to the project, or exertmore pressure on the current
engineering staff. Whatevermanagement's course, the effects of its
decisions will be propagated through the system of loops to result
eventually innew inputs for further decisions.
In this context simple calculations oraemsitivity analyses are
no longer adequate for understanding the implications of forecasting
errors. Inaccuracies may lead tomanydifferent kinds of costs
depend-ingupon the nature of the decision structure in the laboratory.
Tech-nicalmanpower resources are relatively fixed in the short rtsn. Men
precipitously added to one project effort must be taken from
another-The program with lower prioritywill itself experience schedule
over-runs, or often be dropped altogether- Such projects appeared above in
the category of Miscellaneous Failures, ,T«ble 5 indicates that the
money wasted on this type of projectamounted to 27 and 10 percent
re-spectively of the total development budgets in the Equipment and th«
Electronics Laboratories.
Another cost stems from the time inevitably lost whenever memare
transferred from one project to another. The project effort is
dis-rupted while the new personnel become familiarwith the workand are
assimilated into theworking groups. Also, there may be penalties
-31-The magnitude of all these costs will dependupon the size and
direction of the initial error, the speed at which it is detected, the
efficiencywith which resources are transferredbetween projects, and
the implications of schedule overruns. The specific values of these
and other parameters in the laboratory's underlying decision structure
may change from one laboratory to another, but the structure itself is
a general representation of all project -organized development programs.
It is actually possible to fit the parameters of such a model to
a particular laboratory. Management science and organization psychology,
the experience of corporate and laboratory administrators, and empirical
research similar to that discussed above all can provide information on
the elements and the relationships which comprise the important
feed-back loops in any particular laboratory. In practice, of course, the
description will bemuchmore detailed than that in Figure 9. We have
found that laboratory simulation models must contain about thirty
ele-ments before they begin to exhibit the behavior modes characteristic
of real organizations. Some of the models which have been used to explore
laboratory performance are an order of magnitude more complex than that.
While it is possible formanagers to describe accurately the
de-cision feedback structurewhich determines the performance of their
laboratories, the complexity of any useful model makes it impossible
to intuitively predict the costswhich will result from different
fore-casting errors. Thus the laboratory description must be converted into
a set of equations whichcan be employed in computer simulation
experi-ments. Industrial Dynamics is a technique to identify the information
econo-
-32-aic systemand then convert it Into a computer simulation model. Several
references (Forrester, 1961; Roberts, 1964; Spencer, 1966) give specific
instructions in themethodology ofIndustrial Dynamics and describe its
applicationto industrial development programs.
An unpublishedstudy by Roberts and Scambos illustrates the use
of Industrial Dynamics in studying the implications of forecasting
errors. Their study focused on the schedule slippages whichresult
from errors in the initial forecast of effort required^ i.e. development
cost. Their simulationmodel elaborated on the basic feedback structure
inFigure 9 by incorporating several important features
c
1) The magnitude of the error, its directions, and the rate at which it became apparent to management were varied in the simulations.
2) Twoengineering groups were involved in the conduct of the project. Their activities were interdependent. Whenever one group
slipped too far behind the other, the second group was held up in its
work as technical information and hardware necessaryfor its work were
not available from the laggard group. The productivity of each group
was influenced by its perceptions of the other's progress. Although
management is usually contentmerely to meet minimumstandardsj,
engi-neers generally prefer to refine the product technically. Thus each
group in the simulationmodel paces itself to finish just behind the
other. That goal prevents it from delaying the projects, yet it
pro-vides the most time for technical refinements,
3) Technical competence was held constant during the course of the project. More detailed models have included the dependence of
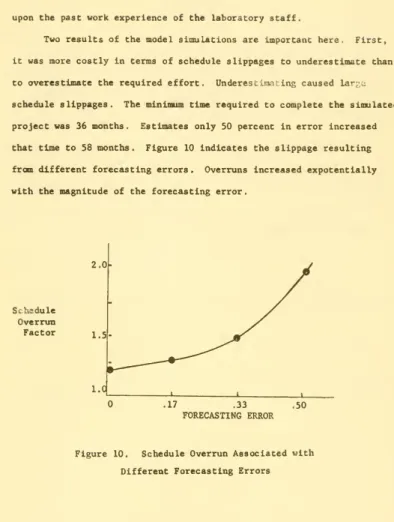
-33-upon the past work experience of the laboratory staff.
Two results of the model simulations are important here. First,
it was more costly in terms of schedule slippages to underestimate than
to overestimate the required effort. Underesliimr.ring caused lar-;u
schedule slippages. The minimum time required to complete the simulated
project was 36 months. Estimates only 50 percent in error increased
that time to 58months. Figure 10 indicates the slippage resulting
from different forecasting errors, Overruns increased expotentially
with the magnitude of the forecasting error
. Schedule Overrtm Factor 2.0-17 .33 FORECASTING ERROR
Figure 10. ScheduleOverrun Associated with Different Forecasting Errors
-34-CONCLUSION
Errors in Che forecasts used to select development projects are
large and costly in terms ofwasted resources and schedule overruns.
In-accuracy can not be much improved through simple correction equations.
Instead management must quantify the error and its implications through
research. Only thenwill it be possible todesign optimal forecasting
and project selection procedures. While the results of present research
must be
confimed
and extended, there is no longer any doubt that bothsimulation and historical analysis can provide useful insights into the
References
Baker, N,R., and W, H. Found, "Rand D Project Selection: Where we
Stand',' IEEETrans. Engng. Mgmt. Em-11, No. 4, 1964, Pp. 123-34. Fisher, G. H. "The Problem ofUncertainty" In Large, J.P. (Ed.),
Concepts and Procedures of Cost Analysis. The RAND Corporation,
RM-3589-PR, Santa Monica, Calif., June 1963.
Forrester, J.W., Industrial Dynamics. JohnWiley&Sons, Inc., New York,
1961.
Kiefer, D. M., "Winds ofChange in Industrial Chemical Research" Chemical and Engng. News 42:88-109, March 23, 1965.
Mansfield, E., and Brandenburg, R., "The Allocation, Characteristics, and Outcome of the Firm's Rand D Portfolio: ACase Study," J. Business.
Vol. 39, 1966, Pp. 447-464.
Peck, M. J., andF. MScherer, The Weapons Acquisition Process. An Economic Analysis, Harvard University Press, 1962, Boston, Mass.
Roberts, Edward B. The Dynamics of Research and Development, Harper &
Row, New York, 1964.
Rubin, Irwin, "Factors in the Performance of R and D Projects" in
Proceedings of the TwentiethNational Conference on theAdministration ofResearch, Denver ResearchInstitute, University of Denver,
Colorado, 1967, Pp. 67-71.
Seller, R. E., Improving the Effectiveness of Research and Development,
McGraw-Hill, New York, 1965.
Spencer, R.S., "Modelling Strategies forCorporate Growth" presented at theSociety for General Systems Research session of the conference of the American Association for theAdvancement of Science; Wash-ington, D.C.; December 26, 1966.
Hay
AF^^j^
Date
Due
3 TDfiD
DD3 7DE OEl
3T06D D03 b71 044
3 TDflO003 702
HE
/>....307-
fc^ 3TOaO 0D3
7DEDTb
liilllllillliliillllllllllllll3.^^^
3 TOflO003 b70
fl30 3 =1060003 b70 655
3 TOfiD
DD3 b71
IIT
^\o~h%
3,„.
Illllih/'^^
3 TOfiODD3 b71 0T3
3
T060 003 b71 ObT
3/3'^'? 3 TOflQ