https://doi.org/10.1021/la026052e
READ THESE TERMS AND CONDITIONS CAREFULLY BEFORE USING THIS WEBSITE. https://nrc-publications.canada.ca/eng/copyright
Vous avez des questions? Nous pouvons vous aider. Pour communiquer directement avec un auteur, consultez la première page de la revue dans laquelle son article a été publié afin de trouver ses coordonnées. Si vous n’arrivez pas à les repérer, communiquez avec nous à [email protected].
Questions? Contact the NRC Publications Archive team at
[email protected]. If you wish to email the authors directly, please see the first page of the publication for their contact information.
NRC Publications Archive
Archives des publications du CNRC
This publication could be one of several versions: author’s original, accepted manuscript or the publisher’s version. / La version de cette publication peut être l’une des suivantes : la version prépublication de l’auteur, la version acceptée du manuscrit ou la version de l’éditeur.
For the publisher’s version, please access the DOI link below./ Pour consulter la version de l’éditeur, utilisez le lien DOI ci-dessous.
Access and use of this website and the material on it are subject to the Terms and Conditions set forth at
Structure and interactions in the anomalous swelling regime of
phospholipid bilayers
Pabst, Georg; Katsaras, John; Raghunathan, Velayudhan A.; Rappolt,
Michael
https://publications-cnrc.canada.ca/fra/droits
L’accès à ce site Web et l’utilisation de son contenu sont assujettis aux conditions présentées dans le site LISEZ CES CONDITIONS ATTENTIVEMENT AVANT D’UTILISER CE SITE WEB.
NRC Publications Record / Notice d'Archives des publications de CNRC:
https://nrc-publications.canada.ca/eng/view/object/?id=f250b478-5ff0-4b72-8aa4-47a3c768b495
https://publications-cnrc.canada.ca/fra/voir/objet/?id=f250b478-5ff0-4b72-8aa4-47a3c768b495
Structure and Interactions in the Anomalous Swelling
Regime of Phospholipid Bilayers
†Georg Pabst,
‡,§John Katsaras,*
,‡Velayudhan A. Raghunathan,
|and
Michael Rappolt
§National Research Council, Steacie Institute for Molecular Sciences, Bldg. 459, Stn. 18, Chalk River, Ontario, K0J 1J0, Canada, Institute of Biophysics and X-Ray Structure Research, Austrian Academy of Sciences, Schmiedlstrasse 6, 8042 Graz, Austria, and
Raman Research Institute, Bangalore 560 080, India Received June 10, 2002. In Final Form: October 16, 2002
We have carried out X-ray and neutron diffraction experiments, as a function of temperature, on fully hydrated samples of dimyristoyl phosphatidylcholine bilayers. The data show the following: (a) In the vicinity of the LRto Pβ′transition, we find an anomalous expansion of the water layer of ∼1.7 Å. (b) The
lipid bilayer thickness increases quasi-linearly and is similar to the increase in the lamellar repeat spacing dfound in dimyristoyl ethanolamine bilayers in the temperature range of TMto TM+ 13 °C. (c) In contrast to an earlier study, we find no significant changes to the steric size of the phosphatidylcholine headgroup. The anomalous increase in d is thus dominated by an expansion of the water layer. This expansion is caused by a distinct increase in bilayer fluctuations as revealed by an analysis of the Caille´ parameter. Additional osmotic pressure experiments not only support this notion but have allowed us to further estimate the temperature dependence of both the bilayer bending rigidity, Kc, and the interbilayer
compressional parameter, B. Both Kcand B experience an abrupt decrease on approaching TMfrom above,
indicative of a “softening” of the bilayers. 1. Introduction
Among the many supramolecular structures displayed by phospholipid/water systems,1the liquid-crystalline, L
R,
phase is considered to be biologically relevant. As a result, many efforts have been undertaken in order to better understand both the structural and mechanical properties of this phase.2Another major focus in the area of model
membranes involves phase transition phenomena, espe-cially in the vicinity of the LRphase, as it is believed that
certain physiologically processes may be dependent on membrane gelation.3For example, it has been suggested
recently that the proximity of membranes to the gel state is of principal importance for certain processes occurring in the brain, the physiology of thermoregulation, and mechanisms of general anesthesia.4
In the case of multibilayer stacks of dimyristoyl phos-phatidylcholine (DMPC), one particularly intriguing phase transition involves the structural changes close to the main transition (LRfPβ′) temperature, TM. With decreasing
temperature, fluidlike, LR DMPC bilayers exhibit a
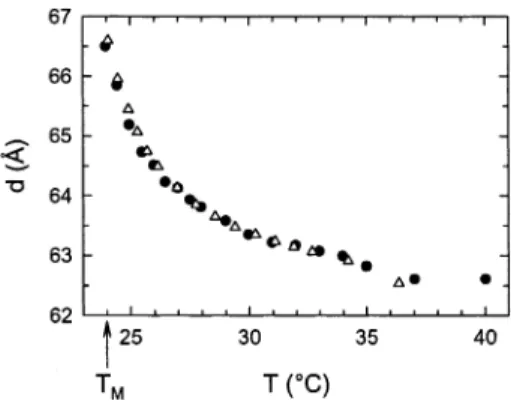
nonlinear increase in their lamellar repeat spacing, d (Figure 1), which has previously been reported by various groups for DMPC and other lipid/water systems.5-14
Presently, the accepted view is that this anomalous swelling is a pretransitional effect. This may be the result of either a critical transition being intercepted by a first-order main transition15or the fact that the main transition
is weakly first order due to some intrinsic properties of the bilayer.16Furthermore, there are a number of other
* To whom correspondence should be addressed. Tel: 613-584-8811 ext 3984. Fax: 613-584-4040. E-mail: [email protected].
†Part of the Langmuir special issue entitled The Biomolecular
Interface.
‡Steacie Institute for Molecular Sciences. §Austrian Academy of Sciences.
|Raman Research Institute.
(1) See, for example: Seddon, J. M.; Templer, R. H. In Structure and
Dynamics of Membranes; Lipowsky, R., Sackmann, E., Eds.; North-Holland: Amsterdam, 1995; p 97.
(2) Nagle, J. F.; Tristram-Nagle, S. Biochim. Biophys. Acta 2000,
1469, 159.
(3) Melchior, D. L.; Steim, J. M. Annu. Rev. Biophys. Bioeng. 1976,
5, 205. Hazel, J. R. Annu. Rev. Physiol. 1995, 57, 19.
(4) Kharakoz, D. Biophysics 2000, 45, 554.
(5) Kirchner, S.; Cevc, G. Europhys. Lett. 1993, 23, 229.
(6) Hønger, T.; Mortensen, K.; Ipsen, J. H.; Lemmich, J.; Bauer, R.; Mouritsen, O. G. Phys. Rev. Lett. 1994, 72, 3911.
(7) Zhang, R.; Sun, W.; Tristram-Nagle, S.; Headrick, R. L.; Suter, R. M.; Nagle, J. F. Phys. Rev. Lett. 1995, 74, 2832.
(8) Lemmich, J.; Mortensen, K.; Ipsen, J. H.; Hønger, T.; Bauer, R.; Mouritsen, O. G. Phys. Rev. Lett. 1995, 75, 3958.
(9) Chen, F. Y.; Hung, W. C.; Huang, H. W. Phys. Rev. Lett. 1997,
79, 4026.
(10) Nagle, J. F.; Petrache, H. I.; Gouliev, N.; Tristram-Nagle, S.; Liu, Y.; Suter, R. M.; Gawrisch, K. Phys. Rev. E 1998, 58, 7769.
(11) Richter, F.; Finegold, L.; Rapp, G. Phys. Rev. E 1999, 59, 3483. (12) Korreman, S. S.; Posselt, D. Eur. Phys. J. 2000, 1, 87. (13) Mason, P. C.; Nagle, J. F.; Epand, R. M.; Katsaras, J. Phys. Rev.
E 2001, 63, 030902-1.
(14) Korreman, S. S.; Posselt, D. Eur. Biophys. J. 2001, 30, 121. (15) Nagle, J. F. Proc. Natl. Acad. Sci. U.S.A. 1973, 70, 3443. Figure 1. Anomalous swelling of LRDMPC bilayer stacks as
a function of decreasing temperature (TM) 24.0 °C). The b’s correspond to X-ray diffraction data of liposomal preparations, while the 4’s are the result of neutron diffraction studies on aligned systems.
10.1021/la026052e CCC: $25.00 © 2003 American Chemical Society Published on Web 12/20/2002
quantities (e.g., passive bilayer permeability, heat capac-ity, fluorescence lifetime of trans-parinaric acid in bilayers, NMR order parameter, and ultrasound velocity) which exhibit anomalous behavior near TM.17Nevertheless, the
fact that similar transition enthalpies, including the dependence on the hydrocarbon chain length, have been observed in lipid systems which exhibit no pretransitional swelling18 suggests that parts of the theory need to be
revised.
Despite many efforts, a complete picture of the struc-tural changes in the anomalous swelling regime is presently still lacking. Commonly reported structural parameters are lipid bilayer thickness, dB, and the
thickness of the water layer dW. The sum of these
parameters gives rise to the lamellar periodicity, d. dB
can be further subdivided as 2dH+ 2dCwhere dHis the
steric size of the polar phosphorylcholine headgroup and dC is the effective length of the hydrophobic fatty acid
chains. Over the years, various and sometimes conflicting views on which of these structural components accounts for most or all of the observed anomalous swelling have been reported in the literature.6-10
In the mid-1990s, the Danish group of Mouritsen6,8
attributed the anomalous swelling to the thickening of the hydrophilic layer, which they defined as the sum of dWand 2dH. Moreover, they mentioned that this increase
was due to increased bilayer fluctuations. This notion was supported by an earlier study which found a decrease in the membrane bending rigidity using shape analysis on giant unilamellar vesicles.19However, Nagle et al.10noted
that the decrease in the membrane bending rigidity may have been the result of Fernandez-Puente et al. assuming a constant vesicular volume in their data analysis. Later on, Huang and co-workers performed experiments on partially hydrated aligned systems of dilauroyl phos-phatidylcholine (DLPC) bilayers,9 which lent further
support to the conclusions espoused by Mouritsen and co-workers.6,8 However, their extrapolation to fully
hy-drated conditions yielded a d which was ∼5 Å less than what is commonly measured in fully hydrated DLPC bilayers.20
In response to the first paper by Mouritsen and co-workers,6Nagle’s group, at Carnegie Mellon, performed
line-shape analysis on high-resolution X-ray data using the modified Caille´ theory (MCT)21 and suggested that
the anomalous change in d near TMcould almost entirely
be attributed to an increase in the thickness of the hydrophobic part, 2dC, of the bilayer.7In 1998, Nagle et
al. extended their model by stating that 2dCdoes indeed
swell10 but scaling of this contribution to d left an
anomalous component of ∼2 Å, unexplained. This notion of the unexplained 2 Å of anomalous swelling was further confirmed by Mason et al.,22 using a DMPC sample of
large unilamellar vesicles (LUVs). Assuming that the unaccounted 2 Å is due to an expansion of the water layer,
Nagle et al. performed Monte Carlo simulations.10 For
this scenario, the simulations predicted a 35% increase in the Caille´ parameter, which is a measure of the thermal undulations of the bilayers, in the vicinity of TM. However,
analysis of the experimental data did not show an increase in bilayer fluctuations and was consistent with additional osmotic pressure experiments.
In the aftermath of the above-mentioned studies, additional models were advanced. One such model specu-lates that the water spacing could expand because of changes in either the repulsive hydration force or the attractive van der Waals force in the vicinity of TM.10
However, quantitative support for this scenario has yet to be found. Another model proposes that the headgroup region can swell anomalously, thus accounting for the elusive 2 Å.10However, NMR data suggested a maximum
headgroup contribution of 0.6 Å.10
In this paper, we report X-ray and neutron diffraction studies, as a function of temperature, on fully hydrated liposomal preparations and highly aligned multibilayers of DMPC. The powder data were analyzed using the recently developed full q refinement method.23 In the
vicinity of the LRfPβ′transition, we find that the water layer, dW, experiences a sudden expansion of about 1.7 Å.
On the other hand, the hydrophobic bilayer thickness also increases but does not contribute to an anomalous increase in d, since its trend for d is similar to that observed in dimyristoyl ethanolamine (DMPE) whose main transition is not considered as being “anomalous”.13We further find
no significant contribution to anomalous swelling of the hydrophilic phosphatidylcholine headgroup. An analysis of the undulation parameter revealed increased bilayer fluctuations on approaching TM, consistent with the
expansion of the water layer. The increased bilayer fluctuations can be explained by a reduced bilayer bending rigidity, Kc, and a decrease in the interbilayer
compress-ibility, B. Osmotic pressure experiments on the aligned samples support our results of the fluctuation analysis. Moreover, we were able to estimate the temperature dependence of both Kcand B. Our estimates indicate that
Kcreduces by 20% near TM, while the reduction in B is
∼12%. These observations account for all of the outstand-ing issues concernoutstand-ing structure and interactions in the anomalous swelling regime of DMPC bilayers and possibly of all lipid bilayers exhibiting similar behavior.
2. Materials and Experimental Methods
2.1. Sample Preparation. DMPC was purchased from Avanti
Polar Lipids (Birmingham, AL) and used without further purification. Poly(n-vinylpyrrolidone) (PVP) of average molecular weight 40 000 was purchased from Sigma Chemical Co. (Mil-waukee, WI), and D2O of 99.92 wt % purity from Atomic Energy of Canada Ltd. (Chalk River, ON).
Multilamellar liposomes were prepared in the following manner: DMPC was dissolved in a solvent of CHCl3/CH3OH (2:1, v/v). The solution was then dried under a stream of N2gas and subsequently placed under vacuum for a period of 12 h. The desiccated lipid was then hydrated using double-distilled/ deionized water yielding samples containing 25 wt % lipid. To ensure complete hydration, the lipid dispersions were incubated for 30 min at 60 °C (36 °C above the main transition). The liposomal preparations were further annealed in the following manner: (a) 2 min of vigorous vortexing, (b) 5 min of equilibration at 10 °C, and (c) a further 5 min of equilibration at 60 °C. Steps a-c were repeated a total of five times. When this method of liposomal preparation is used, the samples display a narrow, cooperative melting transition. Thin-layer chromatography was carried out on all samples before and after experimentation.
(16) Kharakoz, D. P.; Shlyapnikova, E. A. J. Phys. Chem. B 2000,
104, 10368.
(17) Nagle, J. F.; Scott, H. L. Biochim. Biophys. Acta 1978, 513, 236. Hatta, I.; Suzuki, K.; Imaizumi, S. J. Phys. Soc. Jpn. 1983, 52, 2790. Rugerio, A.; Hudson, B. Biophys. J. 1989, 55, 1111. Morrow, M. R.; Whitehead, J. P.; Lu, D. Biophys. J. 1992, 63, 18. Kharakoz, D. P.; Colloto, A.; Lohner, K.; Laggner, P. J. Phys. Chem. 1993, 97, 9844.
(18) Koyova, R.; Caffrey, M. Chem. Phys. Lipids 1994, 69, 1. Koyova, R.; Caffrey, M. Biochim. Biophys. Acta 1998, 1376, 91.
(19) Fernandez-Puente, L.; Bivas, I.; Mitov, M. D.; Me´le´ard, P.
Europhys. Lett. 1994, 28, 181.
(20) Hatta, I.; Matuoka, S.; Singer, M. A.; Finegold, L. Chem. Phys.
Lipids 1994, 69, 129.
(21) Zhang, R.; Suter, R. M.; Nagle, J. F. Phys. Rev. E 1994, 50, 5047. (22) Mason, P. C.; Gaulin, B. D.; Epand, R. M.; Katsaras, J. Phys.
Rev. E 2000, 61, 5634.
(23) Pabst, G.; Rappolt, M.; Amenitsch, H.; Laggner, P. Phys. Rev.
E 2000, 62, 4000.
The oriented samples were prepared by first spreading a lipid solution, typically 20 mg of lipid in methanol, on a clean substrate of silicon (48 mm × 18 mm × 0.3 mm). After evaporation of the solvent, the samples were kept in a vacuum for between 12 and 24 h to remove any traces of methanol. The lipid films were subsequently annealed for 12-24 h at 70 °C in a D2O-saturated environment.
2.2. X-ray Measurements. X-ray diffraction patterns were
recorded at the Austrian SAXS (small-angle X-ray scattering) beamline24,25 (Sincrotrone Trieste, Italy). A one-dimensional position sensitive detector26was used covering a q-range (q ) 4π sin(θ)/λ) of between 0.03 and 0.6 Å-1at a photon energy of 8 keV. The angular calibration of the detector was performed with silver-behenate [CH3(CH2)20-COOAg] whose d corresponds to 58.38 Å.27The instrumental resolution, which was accounted for in the data analysis, was determined to have a full width at half-maximum of δq ) 2.2 × 10⁻³Å-1.
X-ray measurements of the lipid dispersions were carried out with the samples placed in thin-walled, 1 mm diameter quartz capillary tubes. The capillary tubes were placed in a sample holder block of brass whose entry and exit windows were covered with a thin polymer film in order to avoid any convection induced by the surrounding environment. The temperature of the sample holder was controlled with a circulating water bath to within (0.1 °C. The temperature was measured in the vicinity of the capillary with a Pt-100 resistance temperature detector. Prior to exposure, the sample was equilibrated for a period of 10 min for a given temperature. To prevent radiation damage, the capillaries were translated vertically by 1 mm to an unexposed portion of the sample after every second measurement. Exposure times were typically between 2 and 3 min.
2.3. Neutron Measurements. For the neutron scattering
experiments, the substrate was mounted in an aluminum cell, described in refs 28 and 29, containing various concentrations of PVP in D2O. The PVP polymer weight concentration was converted into pressure according to McIntosh and Simon.30 Osmotic pressure data were obtained at values of P ) 0, 0.4, 2.2, 7, and 16 atm while the entire aligned sample was covered by a 6.5 mm layer of solution. The experiments were carried out at the NRU reactor, Chalk River Laboratories, using the N5 triple-axis spectrometer. Neutrons of wavelength 2.37 Å were selected using the (002) reflection of a pyrolytic-graphite monochromator. All samples were equilibrated for about 10 h before starting the measurements.
2.4. Data Analysis. Powder data were corrected for detector
efficiency and background noise from the water and sample cell. The scattered intensity of the corrected static diffraction patterns was analyzed in terms of
using a MCT structure factor21,23given by
Herein, N is the mean number of bilayers per scattering domain, γ is Euler’s constant, and η1is the fluctuation or Caille´ parameter. η1is related to the bilayer bending rigidity Kcand the bulk
modulus of compression B by31
where Kc) Kd, with K corresponding to the bending modulus. The bulk modulus is a phenomenological constant in a harmonic approximation for the interaction energy between two bilayers in its discrete description.32,33It is related by B ) B3/d to the bulk modulus of the continuum description of the elasticity of smectic A liquid crystals.34The form factor
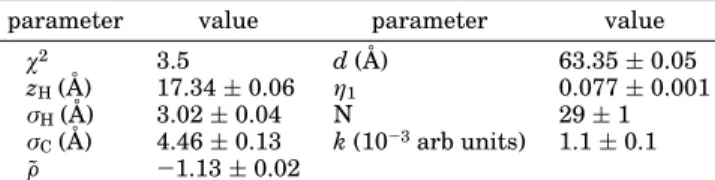
is given by the Fourier transform of the electron density profile model.23The model consists of three Gaussians representing the polar headgroups at (zHand the terminal methyl groups at the center of the bilayer. The corresponding widths of the Gaussians are given by σHand σC, respectively, whereas F˜ is the fraction of the headgroup amplitude to the negative methyl terminus amplitude (FHis set equal to 1). Figure 2 shows a typical fit to our data; the fit results are summarized in Table 1, while the corresponding electron density profile is presented in Figure 3. The decomposition of the lamellar spacing, d, into dWand dB is not trivial, the reason being that the electron density profiles which can be reconstructed from the diffraction patterns are of low resolution (Figure 3). In some sense, we can exploit this in our favor because we can use the simple Gaussian model described above to represent the electron density to a good approximation. Nevertheless, how does one distinguish between dWand dB? A
(24) Amenitsch, H.; Bernstorff, S.; Rappolt, M.; Kriechbaum, M.; Mio, H.; Laggner, P. J. Synchrotron Rad. 1998, 5, 506.
(25) Bernstorff, S.; Amenitsch, H.; Laggner, P. J. Synchrotron Radiat.
1998, 5, 1215.
(26) Petrascu, A.-M.; Koch, M. H. J.; Gabriel, A. J. Macromol. Sci.,
Phys. 1998, 37, 463.
(27) Huang, T. C.; Toraya, H.; Blanton, T. N.; Wu, Y. J. Appl.
Crystallogr. 1993, 26, 180.
(28) Katsaras, J. Biophys. J. 1998, 75, 2157.
(29) Pabst, G.; Katsaras, J.; Raghunathan, V. A. Phys. Rev. Lett.
2002, 88, 128101.
(30) McIntosh, T. J.; Simon, S. A. Biochemistry 1986, 25, 4058.
(31) Caille´, A. C. R. Seances Acad. Sci., Ser. B 1972, 274, 891. (32) Hołyst, R. Phys. Rev. A 1991, 44, 3692. Lei, N.; Safinya, C. R.; Bruinsma, R. F. J. Phys. II 1995, 5, 1155.
(33) Petrache, H. I.; Gouliaev, N.; Tristram-Nagle, S.; Zhang, R.; Suter, R. M.; Nagle, J. F. Phys. Rev. E 1998, 57, 7014.
(34) DeGennes, P. G. J. Phys. (Paris), Colloq. 1969, 30, C4-65. Figure 2. Diffraction pattern of fully hydrated DMPC mul-tilamellar vesicles at 30 °C. In addition to the diffuse scattering, the pattern exhibits two sharp reflections corresponding to the first- and second-order quasi-Bragg peaks. The modulation of the diffuse scattering, which is best visible at higher q values, is essentially due to the bilayer form factor (see eq 1). The scattered intensity has been plotted on a logarithmic scale in order to simultaneously show both the sharp Bragg peaks and diffuse scattering. The solid line shows the best fit to the data.
Table 1. Fit Results Applying the Full q Refinement Model to the Diffraction Data of DMPC at 30°Ca
parameter value parameter value
χ2 3.5 d(Å) 63.35 ( 0.05
zH(Å) 17.34 ( 0.06 η1 0.077 ( 0.001
σH(Å) 3.02 ( 0.04 N 29 ( 1
σC(Å) 4.46 ( 0.13 k(10-3arb units) 1.1 ( 0.1
F˜ -1.13 ( 0.02
akis the global scaling factor of the model to the scattered
intensity. η1) πkBT 2
x
BKcd2 (3) F(q) ) x2π[2σHexp(-σH2q2/2) cos(qzH) + σCF˜ exp(-σC2q2/2)] (4) I(q) )S(q)|F(q)| 2 q2 (1) S(q) ) N + 2∑
k)1 N-1 (N - k) cos(kqd)e-(d/2π)2q2η1γ(πk)-(d/2π)2q2η1 (2)recent review by Nagle and Tristram-Nagle2deals with this difficulty. In this paper, we are more interested in the temperature dependence of dWand dB; as such, it is not of outmost importance to know the absolute values of these two parameters. Thus, we obtain the bilayer thickness from the electron density profiles in the following manner:
This is a definition that has previously been used for Lβ′bilayers.35 The use of eq 5 is further motivated by Figure 2 of ref 2. Since X-rays are most sensitive to the electron-rich phosphate (PO4) fragment of the headgroup and are practically insensitive to the choline group, the headgroup Gaussian represents, mainly, the PO4component. Figure 2 of ref 2 shows the electron density profile of fully hydrated dipalmitoyl phosphatidylcholine (DPPC) together with probability distributions for different component groups from simulations. According to this figure, zH+ 2σHcuts the probability distribution of the choline group near its half value and may therefore be seen as a Gibbs dividing surface for the bilayer.36
The lateral area, A, per lipid is calculated according to2
where VL is the lipid volume and VH is the volume of the headgroup. VLis obtained from volumetric measurements; for the present data, we have used the results for DMPC reported by Laggner and Stabinger.37For phosphorylcholine headgroups,
VHis equal to 319 Å.32The effective hydrocarbon chain length
is obtained by constraining dCto give the best overall agreement to the dCobtained from NMR measurements10(see section III). A different approach, referred to as the “bootstrap method”, derives dCfrom
where dH1is the distance from the PO4group to the boundary between the polar and the lipophilic region of the bilayer.2Nagle and co-workers usually use a dH1of 4.1 Å;2however, Balgavy´ et al.38have found, from small-angle scattering experiments on LUVs, that this value varies with the hydrocarbon chain length. Further, different definitions of the electron density model may
lead to slightly different zHvalues. This results in an additional variation of dH1, which in total is assumed to be between 4.1 and 5.5 Å.38Though these are details important in determining the absolute parameter values, they are not a severe restriction to the present study as we are more interested in their relative changes as a function of temperature. Nevertheless, we note that using a dH1of 4.1 Å gives good agreement between our dC and the corresponding values obtained from NMR10and X-ray diffraction studies2(see below).
The above method further obtains the membrane thickness from eqs 7 and 8 by adding a steric headgroup size of 9 Å (ref 2) or 10 Å (ref 40). This is different from our definition of dB(eq 5). However, the headgroup was implicated in taking part in anomalous swelling.10 Therefore, we need to have dH freely adjustable and not fixed to a predetermined value. This is the primary reason we chose eq 5 to calculate dBand require that the dCvalues be in good agreement with the NMR data. Compared to the bootstrap method (eq 7), the differences in the dCvalues are minor. However, as will become clear in the following section, with the present method we get a more robust estimate for dH.
3. Results and Discussion
3.1. Structural Parameters. The structural results of the full q refinement method are summarized in Figure 4. Table 2 presents a comparison between the present results and those of Nagle and co-workers10 at 30 °C.
Starting at 55 °C and on decreasing temperature, we observe that dWfirst decreases and then begins to level
off at ∼40 °C (Figure 4a). At high temperatures, the (35) Wiener, M. C.; Suter, R. M.; Nagle, J. F. Biophys. J. 1989, 55,
315.
(36) Parsegian, V. A.; Rand, P. In Structure and Dynamics of
Membranes; Lipowsky, R., Sackmann, E., Eds.; North-Holland:
Am-sterdam, 1995; p 643.
(37) Laggner, P.; Stabinger, H. In Colloid and Interface Science; Kerker, M., Ed.; Academic Press: New York, 1976; Vol. 5, p 91.
(38) Balgavy´, P.; Dubnicˇkova´, M.; Kucˇerka, N.; Kiselev, M. A.; Yaradaikin, S. P.; Uhrı´kova´, D. Biochim. Biophys. Acta 2001, 1512, 40.
(39) Pabst, G.; Rappolt, M.; Amenitsch, H.; Bernstorff, S.; Laggner, P. Langmuir 2000, 16, 8994.
(40) McIntosh, T. J.; Simon, S. A. Biochemistry 1986, 25, 4948. Figure 3. Electron density profile model, represented by the
summation of three Gaussians. The Gaussians centered at (zH
characterize the headgroup, and their 2σHwidth toward the
water layer defines the boundary of the bilayer. The boundary of the hydrocarbon region, 2dC, is calculated using parameters
from the gel phase.
dB) 2(zH+ 2σH) (5)
A ) (VL- VH)/dC (6)
dC) dB/2 - dH (7)
dC) zH- dH1 (8)
Figure 4. Temperature dependence of the water layer thick-ness dW, bilayer thickness dB, and effective hydrocarbon chain
length dCin fully hydrated DMPC. The ]’s in panel B correspond
to the d values in DMPE (ref 13) scaled in temperature by subtracting 25 °C and in d by subtracting 2.8 Å. The 4’s in the
dC(T) plot correspond to NMR measurements on DMPC-d54
(ref 10) and are shifted in temperature by 4 °C.
Table 2. Comparison of Structural Parameters from Present Data to Those by Nagle and Co-workers
(Reference 2) for DMPC Bilayers at 30°Ca
parameter present ref 2 parameter present ref 2
d(Å) 63.4 62.7 dC(Å) 13.2 13.1
dB(Å) 46.8 44.2 A(Å2) 59.4 59.1
dW(Å) 16.6 18.5
aThe definition of dBdiffers in the two studies (see data analysis).
increase of dWis the result of increased fluctuations (see
also Figure 6) and has been described in detail else-where.10,29,39 Here, we concentrate on the structural
changes close to TM, where the water layer starts, at
around 27 °C, to expand abruptly. Just before TM, the
nonlinear expansion of dWamounts to about 1.7 Å (Figure
4a). The bilayer, on the other hand, shows a continuous increase in thickness as the temperature is lowered (Figure 4b). This is consistent with the picture of “freezing out” the conformational disorder of the hydrocarbon chains on approaching the main transition. The hydrocarbon chain length (Figure 4c) has been obtained, as described in the previous section, and resulted in a dHvalue of 10.2 Å. For
comparison, Figure 4c also contains the data from NMR measurements10used to obtain our dC. TMfor DMPC-d54
is ∼20.0 °C. Assuming this to be the only difference between the two systems, we shifted the NMR data upward by 4 °C. Both data show a good overall agreement using a single fixed dH. It is gratifying to note that our estimate
for dHis similar to that reported in the literature.40,41
We have further calculated dC according to eq 8 and
derived dH using eq 7. This method yields values of dH
between 10.0 and 10.2 Å. Such variations are smaller than the error in determining dH, and this further justifies our
decision to keep dHat the single fixed value mentioned
previously. Consequently, we infer that dH does not
contribute to anomalous swelling. Recently, Fragneto et al. reported neutron reflectivity studies on a novel system consisting of only two bilayers, one of which is adsorbed on a solid support.42 Such a system of distearoyl
phos-phatidylcholine (DSPC) exhibited a large water layer thickness of about 60 Å close to TM, which decreased to
∼20 Å at higher temperatures. This result by Fragneto et al. is in good agreement with our observations for dW.
More importantly, they found no significant changes to dH.42
A clear definition of what constitutes anomalous swell-ing has been elusive. Most of the earlier reports defined the nonlinear behavior of d as anomalous swelling.7,9-14
However, d also shows a strong temperature dependence at higher temperatures.29 Here, we take the observed
increase of d in DMPE on approaching TMas the “normal”
trend and any amount of swelling over and above this trend as being anomalous.13Further, the increase in d for
DMPE13is strikingly similar to the increase of d
B(Figure
4b). Both show an almost linear increase of 1.5-2.0 Å in the temperature range of TM to TM + 13 °C. Thus, the
anomalous increase in d for DMPC multibilayer stacks is essentially due to an expansion of the water layer.
Why then does the water layer expand anomalously? As discussed by Nagle et al.,10one possibility is that there
is a change in the hydration force due to a decrease in lateral area per lipid. This would mean that the bilayer surface becomes “gel-like” close to TM. Measurements by
McIntosh and Simon indicate that the hydration force is increased in the gel phase.43However, as noted by Nagle
et al. the hydration force is not dominant in the case of fully hydrated bilayers.10 Long-range interactions are
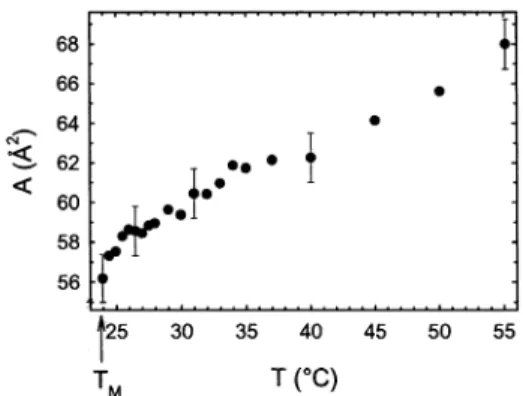
governed by attractive van der Waals and repulsive steric interactions arising from undulations. Here we show the temperature dependence of the lateral area per lipid molecule (Figure 5). The area decreases linearly from 66.8 Å2at 55 °C to 58.0 Å2at 25.5 °C and then experiences a
sudden drop, to 56.2 Å2, in the vicinity of T
M. The total
fractional decrease of A, within the temperature range of TMto TM+ 10 °C,44is about 8%. However, A in gel-phase bilayers is about 0.24 times smaller than in the LRphase.2
Thus, the observed decrease in A is insufficient to explain a gel-phase-like hydration force interaction.
Another possibility then, is that the van der Waals attraction force between bilayers is altered, though this has also been excluded by Nagle et al.,10since the observed
increase in dB results in an increase of this attraction.
This would then favor decreasing, rather than increasing, dW. They further remarked that effects on the Hamaker
constant can be neglected.
3.2. Fluctuation Analysis. In this last section, we come to the conclusion that the anomalous expansion of dW
cannot be attributed to changes in either the hydration or the van der Waals force. On the other hand, bilayer fluctuations, inherent to the LRphase, lead to an effective
long-range repulsive interaction of entropic origin.45
Moreover, fluctuations are known to affect the shape of the lamellar scattering peaks;31in particular, the long
power law tails seen in Bragg peaks are governed by the Caille´ parameter η1
where h gives the diffraction order and ηh≈ η1h2.31The
MCT structure factor (eq 2) accounts for these changes in the line shape of the diffraction orders, opening an experimental window on fluctuations. Figure 6 shows our results for the temperature dependence of η1.
(41) Bu¨ldt, G.; Gally, H. U.; Seelig, J.; Zaccai, G. J. Mol. Biol. 1979,
134, 673. Zaccai, G.; Bu¨ldt, G.; Seelig, A.; Seelig, J. J. Mol. Biol. 1979, 134, 693.
(42) Fragneto, G.; Charitat, T.; Graner, F.; Mecke, K.; Perino-Gallice, L.; Bellet-Amalric, E. Europhys. Lett. 2001, 53, 100.
(43) McIntosh, T. J.; Simon, S. A. Biochemistry 1993, 32, 8374.
(44) TM+ 10 °C is outside the anomalous regime (Figure 1), where no effects of an increased bilayer density are observed.
(45) Helfrich, W. Z. Naturforsch., A 1978, 33a, 305.
Figure 5. The lateral area per lipid as a function of temperature of fully hydrated DMPC bilayers.
Figure 6. The Caille´ or fluctuation parameter η1as a function
of temperature for fully hydrated DMPC bilayers. η1 was
obtained by a global fit of the X-ray diffraction pattern.
Starting at TM, η1rapidly decreases by about 10% and
then remains constant up to a temperature of about 30 °C. At higher temperatures, η1 again experiences an
increase of ∼60%. This increase at high temperatures, which has been observed by various groups10,46and for
lipids other than DMPC,10,46,47 is consistent with an
expected softening of the bilayers and a decrease in the interbilayer compressibility.29,46However, in disagreement
with earlier studies,7,10we also find a distinct increase in
η1on approaching TM. The relatively small increase in η1
may be the reason it was not previously observed by line-shape analysis.7,10 By definition, line-shape analysis
accounts for Bragg peak scattering occurring over a narrow q-range. Therefore, the small changes in η1are obscured
by the considered limited q-range. In contrast, the present analysis23accounts for the full q-range including diffuse
scattering, thus resulting in better statistics of the Caille´ parameter. However, we note that the increase in η1
appears to be much closer to TMthan the increase in dW
(Figure 4a). As there are some limitations to our analysis, changes in η1are only detected when they are pronounced,
as in the vicinity of TM. Nevertheless, our results are
consistent with the presence of increased fluctuations close to TM. η1is inversely proportional to d2(eq 3). Since d is
increasing in the vicinity of TM, this means that the
increase of η1has to come from a decrease in B and/or Kc.
At this stage, we are not able to differentiate between the two as η1contains the product of these two parameters.
However, if the high-temperature regime is any indication we would expect a decrease in both B and Kc.
Nagle et al.10using a Monte Carlo simulation technique
predicted a relative increase in η1, on approaching TM, of
35%, if fluctuations would account for the increase in dW.
This is much larger than the 10% increase observed by us. However, while softening of the bilayer was taken into account (decrease in Kc) the same consideration was
not given to B. Nevertheless, the behavior of η1implies
increased bilayer undulations which consequently enhance the steric repulsion of adjacent bilayers,45leading to an
expansion of dW(Figure 4a).
3.3. Osmotic Pressure Experiments. To test our contentions from the previous section, we have performed neutron diffraction experiments on oriented multibilayers of DMPC as a function of temperature and osmotic pressure. Osmotic pressure suppresses undulations by bringing bilayers closer together. In other words, if anomalous swelling is due to increased fluctuations, osmotic stress should consequently reduce the amount of swelling. In our case, osmotic pressure, P, was applied by keeping the sample in direct contact with a solution of PVP. For the temperature range of interest, P experiences a decrease of between 6% and 8%.48Thus, we expect only
minor effects from the changes in P especially in the vicinity of TM. Osmotic pressure also increases the main
transition temperature, and we observe a maximum of a +1 °C shift in TM at P ) 16 atm. Results are therefore
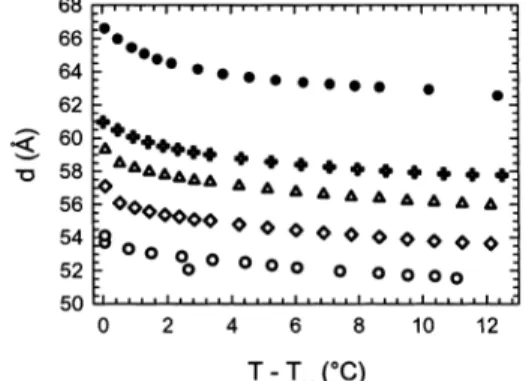
plotted as a function of T - TM(Figure 7).
Figure 7 clearly shows a decrease of the anomalous component of d with increasing osmotic pressure. On the other hand, Nagle et al.10performed similar experiments
on multilamellar vesicles of DMPC and DLPC and did not observe any influence of osmotic pressure on the amount of anomalous swelling. This supported their conclusion that fluctuations are not the cause for the expansion of
the water layer. In contrast, our findings are consistent with fluctuations being the driving force for bilayer repulsion close to TMand agree well with the results from
the fluctuation parameter analysis (Figure 6). At 16 atm, we find practically no anomalous swelling in d, which means that the fluctuations have almost entirely been suppressed. Moreover, reduction in swelling upon the application of osmotic pressure is a clear signature of reduced bilayer interactions in the vicinity of TM. If this
were not the case, the temperature dependence for different osmotic pressures would be similar and would simply be shifted by a constant offset in d. This point is clearly demonstrated in the temperature range of T - TM
> 3 °C (Figure 7). Thus, the data presented in Figure 7 imply that the B modulus is reduced and its behavior is analogous to the behavior of B previously observed in the high-temperature regime of LRmultibilayers.29,46
Why then this decrease in B? Following the analysis given above, the only remaining plausible cause is increased steric bilayer repulsion as a result of increased bilayer fluctuations. As shown by Helfrich,45the mean
square amplitude of the bilayer undulations is inversely proportional to the bending modulus, Kc, and hence the
increase of bilayer undulations has to be attributed to a reduction in Kc. Using the results from Figures 6 and 7,
we thus conclude that in the vicinity of TMthe bilayers
soften, causing them to repel each other and leading to a reduction in B.
We may visualize this result first, by estimating B from
for P f 0 using the dependence of d(T) on osmotic pressure (Figure 7). Strictly speaking, this definition gives the thermodynamic B, which is different from the B as it appears in eq 3.33Quantitative values for B and K
cmay
be obtained from a technique developed in Nagle’s lab where the global X-ray diffraction analysis is applied to highly aligned multibilayers.49However, we do not expect
any changes to the overall trend reported here for B and Kc. Their tendency to decrease in the vicinity of TM is
clearly inferred from Figures 6 and 7. Further, as will become clear later on, the resulting estimates for B and Kccompare well with values given in the literature.
The repeat spacings, d, at a certain temperature and osmotic pressure have been obtained by a smooth spline interpolation of the data presented in Figure 7. Figure 8 (46) Vogel, M.; Mu¨nster, C.; Fenzl, W.; Salditt, T. Phys. Rev. Lett.
2000, 84, 390.
(47) Petrache, H. I.; Tristram-Nagle, S.; Nagle, J. F. Chem. Phys.
Lipids 1998, 95, 83.
(48) Vink, H. Eur. Polym. J. 1973, 7, 1411. J. F. Phys. Rev. E. 2001, 63, 011907.(49) Lyatskaya, Y.; Liu, Y.; Tristram-Nagle, S.; Katsaras, J.; Nagle, Figure 7. Lamellar repeat distance as a function of temper-ature and osmotic pressures of 0 atm (b), 0.4 atm (+), 2.2 atm (4), 7 atm (]), and 16 atm (O). The experiments presented here were repeated a minimum of three times for each condition.
B ≈ -
(
∂P∂d
)
T (10)shows a typical plot of osmotic pressure versus d. As expected, B increases rapidly as the bilayers become more and more compressed. The tangent of the P(d) plots for P f0 is given in good approximation by the slope of a straight line connecting the data points at 0 and 0.4 atm (Figure 8). The resulting estimates for B are plotted in Figure 9a. We can then use the estimated B values and our results of η1(Figure 6) to calculate the temperature
dependence of the bending rigidity by applying eq 3. The results are shown in Figure 9b.
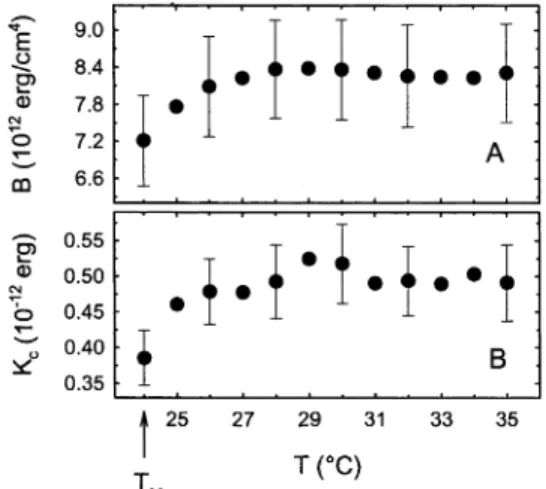
As previously stated, both B and Kcexperience a distinct
drop in the vicinity of TM. In the case of B, we find a
constant value of about 8.3 × 10¹²erg/cm4at temperatures
above TM+ 4 °C (Figure 9a), which is reduced by 12% as
TMis approached. B has previously not been obtained for
fully hydrated DMPC, but our estimate outside the anomalous regime may be compared to a value of (6.0 ( 0.7) × 1012erg/cm4for dioleoyl phosphatidylcholine.49The
bending rigidity, on the other hand, drops from about 0.48 ×10⁻¹²erg at higher temperatures by about 20% in the
vicinity of TM(Figure 9b). Evans and co-workers report
Kc) (0.56 ( 0.06) × 10-12erg for DMPC at 29 °C50from
micropipet pressurization experiments. The same Kchas
also been reported from X-ray interaction measurements.47
Both experimental results agree well with our estimate for Kc. Nagle et al.10arrived at a Kcvalue of 0.4 × 10⁻¹²
erg close to TMfrom simulations, which also compares
well with our estimate (Figure 9b). Fernandez-Puente et al., however, have reported a Kcabout 2 times higher for
DMPC.19Though, as noted in ref 10, their results may
have been biased by constraining the vesicle to have a constant volume.
4. Conclusions
Using a recently developed full q refinement method,23
we have analyzed X-ray diffraction data on fully hydrated liposomal dispersions of DMPC in the temperature regime of TMto TM+ 31 °C. In terms of structure, we find that
anomalous swelling is essentially the result of an expan-sion of the water layer. The increase in the bilayer thickness is comparable to the increase of d in DMPE and thus gives no contribution to the observed anomaly. Also, the phosphatidylcholine headgroup does not contribute significantly to the swelling.
A fluctuation parameter analysis revealed that the expansion of dW is due to a steric repulsion of bilayers
caused by increased fluctuations. Osmotic pressure ex-periments on highly aligned DMPC multilayers, using neutron diffraction, lend further support to increased fluctuations resulting in an increased dW. Moreover, a
combination of osmotic pressure studies and fluctuation analysis data led us to the conclusion that the bilayers soften in the vicinity of TM, experiencing increased levels
of repulsion. To better visualize these results, we have estimated the temperature dependence of B and Kc.
Results show a 20% drop in Kc and 12% in B as TMis
approached.
Our results are in closest agreement with the work of Mouritsen and co-workers.6,8However, their bilayer model
only differentiated between a hydrophilic layer, including the headgroup and water layer, and a hydrophobic layer. It was therefore not clear whether there was a contribution from the headgroup. Further, they did not perform a fluctuation analysis but justified their conclusions on the basis of the elasticity measurements by Fernandez-Puente et al.,19 which, however, have been subjected to some
scrutiny in the literature.10In contrast, we have been able
to arrive at a consistent picture of the structural changes and interactions associated with anomalous swelling through a joint use of X-ray and neutron diffraction data. Finally, we note that it is very likely that the mechanisms described for DMPC bilayers apply also to other systems exhibiting anomalous swelling (e.g., DSPC, DPPC, and DLPC).
Acknowledgment. We thank Dmitri P. Kharakoz and Peter Laggner for helpful discussions. G.P. is the recipient of an Erwin Schro¨dinger Fellowship of the Austrian Science Fund (Grant No. J2004-GEN).
LA026052E
(50) Evans, E.; Rawicz, W. Phys. Rev. Lett. 1990, 64, 2094. Rawicz, W.; Olbrich, K. C.; McIntosh, T.; Needham, D.; Evans, E. Biophys. J.
2000, 79, 328.
Figure 8. Osmotic pressure as a function of lamellar repeat spacing at 25 °C. B can be estimated from a tangent to the P(d) curve at each point.
Figure 9. Temperature dependence of the compression parameter B and the bilayer rigidity Kcin fully hydrated DMPC