HAL Id: hal-01806745
https://hal.archives-ouvertes.fr/hal-01806745
Submitted on 16 Sep 2020
HAL is a multi-disciplinary open access
archive for the deposit and dissemination of
sci-entific research documents, whether they are
pub-lished or not. The documents may come from
teaching and research institutions in France or
abroad, or from public or private research centers.
L’archive ouverte pluridisciplinaire HAL, est
destinée au dépôt et à la diffusion de documents
scientifiques de niveau recherche, publiés ou non,
émanant des établissements d’enseignement et de
recherche français ou étrangers, des laboratoires
publics ou privés.
low-porosity crusts at the WAIS Divide site, West
Antarctica
John Fegyveresi, Richard Alley, Atsuhiro Muto, Anaïs Orsi, Matthew Spencer
To cite this version:
John Fegyveresi, Richard Alley, Atsuhiro Muto, Anaïs Orsi, Matthew Spencer. Surface formation,
preservation, and history of low-porosity crusts at the WAIS Divide site, West Antarctica. The
Cryosphere, Copernicus 2018, 12 (1), pp.325 - 341. �10.5194/tc-12-325-2018�. �hal-01806745�
https://doi.org/10.5194/tc-12-325-2018
© Author(s) 2018. This work is distributed under the Creative Commons Attribution 3.0 License.
Surface formation, preservation, and history of low-porosity crusts
at the WAIS Divide site, West Antarctica
John M. Fegyveresi1,2, Richard B. Alley2, Atsuhiro Muto3, Anaïs J. Orsi4, and Matthew K. Spencer5
1Terrestrial and Cryospheric Sciences Branch, US Cold Regions Research and Engineering
Laboratory (CRREL), Hanover, NH 03755, USA
2Dept. of Geosciences, and Earth and Environmental Systems Institute, Pennsylvania State
University, University Park, PA 16802, USA
3Dept. of Earth and Environmental Science, College of Science and Technology, Temple
University, Philadelphia, PA 19122, USA
4Laboratoire des Sciences du Climat et de l’Environnement, LSCE/IPSL, CEA-CNRS-UVSQ,
Université Paris-Saclay, 91191, Gif-sur-Yvette, France
5School of Physical Sciences, Lake Superior State University, Sault Sainte Marie,
MI 49783, USA
Correspondence: John M. Fegyveresi (fegy.john@gmail.com) Received: 21 June 2016 – Discussion started: 29 June 2016
Revised: 11 November 2017 – Accepted: 28 November 2017 – Published: 26 January 2018
Abstract. Observations at the West Antarctic Ice Sheet (WAIS) Divide site show that near-surface snow is strongly altered by weather-related processes such as strong winds and temperature fluctuations, producing features that are rec-ognizable in the deep ice core. Prominent “glazed” surface crusts develop frequently at the site during summer seasons. Surface, snow pit, and ice core observations made in this study during summer field seasons from 2008–2009 to 2012– 2013, supplemented by automated weather station (AWS) data with short- and longwave radiation sensors, revealed that such crusts formed during relatively wind, low-humidity, clear-sky periods with intense daytime sunshine. After formation, such glazed surfaces typically developed cracks in a polygonal pattern likely from thermal contrac-tion at night. Cracking was commonest when several clear days occurred in succession and was generally followed by surface hoar growth; vapor escaping through the cracks dur-ing sunny days may have contributed to the high humid-ity that favored nighttime formation of surface hoar. Tem-perature and radiation observations show that daytime solar heating often warmed the near-surface snow above the air temperature, contributing to upward mass transfer, favoring crust formation from below, and then surface hoar formation. A simple surface energy calculation supports this
observa-tion. Subsequent examination of the WDC06A deep ice core revealed that crusts are preserved through the bubbly ice, and some occur in snow accumulated during winters, although not as commonly as in summertime deposits. Although no one has been on site to observe crust formation during win-ter, it may be favored by greater wintertime wind packing from stronger peak winds, high temperatures and steep tem-perature gradients from rapid midwinter warmings reaching as high as −15◦C, and perhaps longer intervals of surface stability. Time variations in crust occurrence in the core may provide paleoclimatic information, although additional stud-ies are required. Discontinuity and cracking of crusts likely explain why crusts do not produce significant anomalies in other paleoclimatic records.
1 Introduction
Visual and thin-section examination of the West Antarctic Ice Sheet (WAIS) Divide deep ice core revealed not only an an-nual signal linked to bubble and grain characteristics (Fitz-patrick et al., 2014) but also numerous crusts. These crusts are bubble-free or nearly so, typically 1 mm or less and one grain in thickness, and are readily identified visually in
bub-bly ice (Fig. 1). Their presence in greater abundance than seen in most cores (e.g., Alley, 1988) motivated studies to understand their formation, possible influence on other pale-oclimatic data, and potential for recording palepale-oclimatic con-ditions themselves.
Work by Orsi et al. (2015) and Mitchell et al. (2015) showed that no significant artifacts are introduced to pale-oclimatic records by the WAIS Divide crusts. Here, we re-port additional studies showing that summertime crusts form under specific conditions linked to persistent high-pressure systems, so the time series of crusts likely contains paleocli-matic information; however, many additional issues must be addressed before useful climate histories can be constructed confidently.
Bubble-free layers much thicker than the bubble-free crusts discussed here are sometimes observed in ice cores from warm sites and provide evidence of refrozen meltwa-ter (e.g., Das and Alley, 2005). These are of inmeltwa-terest as pa-leoclimatic records but have the potential to anomalously distort records of trapped gases or other components of ice cores. Refrozen meltwater can be identified by an excess of trapped heavy noble gases, so Orsi et al. (2015) analyzed WAIS Divide samples containing bubble-free crusts, find-ing that not enough meltwater was involved to significantly perturb records of other trace gases. Additionally, crusts might greatly modify gas trapping in the firn, but measured nitrogen-isotopic ratios at WAIS Divide show that gravita-tional fractionation occurs down to the normal trapping depth where normal amounts of air are trapped, demonstrating that the crusts are not both impermeable and laterally extensive at shallow depth (Mitchell et al., 2015; Battle et al., 2011).
Here, we report coordinated observations of crust forma-tion over five summers (2008–2009 to 2012–2013) at the WAIS Divide site, involving daily observations of surface evolution, shallow-snow-pit studies with a 2 m pit at least once per year, insolation measurements, and near-surface temperature profiling, supplemented with data from an on-site automated weather station (AWS). We find that crusts form most commonly in the summer (45 % greater occur-rence) but do also form in winter. In summer, crust forma-tion primarily results from the effects of strong diurnal tem-perature cycling under clear-sky, low-wind, relatively warm conditions. Wintertime observations are not available, but the physical understanding gained from our summertime data suggests hypotheses for formation. Time trends in the occur-rence of summertime crusts in the core may reveal changes in the frequency of the persistent high-pressure conditions that generate crusts, although additional work will be required to quantify this.
2 Methods
The main methods used are described here. Additional de-tails are provided in Fegyveresi (2015). The surface was
ob-10 mm
Sample ID: WDC05A - 77.260 m
Figure 1. A thick-section image of a sample prepared from a depth of ∼ 77.260 m showing two preserved crusts. Both layers are ∼1 mm thick and appear mostly bubble-free. All bubbles here ap-pear white, with the surrounding ice black. The general elongated shape of the bubbles is due the proximity of this sample to the bub-ble close-off depth at WAIS Divide of ∼ 75 m. This sample is from the secondary WDC05A core at the WAIS Divide site. Image mod-ified from Orsi et al. (2015).
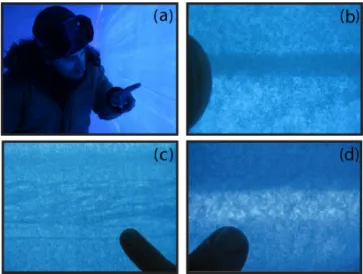
Figure 2. The lead author in a 2 m snow pit prepared at WAIS Di-vide (pit 2009-10-A). Multi-grain crusts (a, b), preserved sastrugi with cross-bedding (c), and hoar layers (d) are all easily identifi-able.
served continually by one of us (John M. Fegyveresi) during the five field seasons extending from 2008–2009 to 2012– 2013 (Table 1). During each austral summer, a backlit snow pit was also prepared and studied (five total pits). All pits were sited within 1 km radius of the primary ice core drilling facility but avoided regions disturbed by camp operations or the “drift tail” of enhanced accumulation downwind of the camp. Following prior practice (e.g., Benson, 1962; Ko-erner, 1971; Alley, 1988), each sampling site involved exca-vating a pair of ∼ 2 m cubic pits separated by a wall ∼ 0.5 m
Table 1. Field observation table (see also Figs. 5–8).
Field Season Observation Window Observation AWS Other Instrumentation Pit
duration
2008–2009a 12 Dec 2008 : 10 Jan 2009 ∼29 days – – ×
2009–2010a 27 Dec 2009 : 25 Jan 2010 ∼29 days W, H , T – ×
2010–2011 20 Dec 2010 : 9 Jan 2011 ∼20 days W, H , T – ×
2011–2012a 25 Dec 2011 : 4 Jan 2012 ∼12 days W, H , T , I Dual LI-COR LI200 sensors × 2012–2013a 18 Dec 2012 : 30 Dec 2012 ∼12 days W, H , T , I Kipp & Zonen CNR2 sensor ×
Shallow PRD stringsb
W, H, T , I– Wind, Humidity, Temperature, Insolation.aFegyveresi (2015),bMuto et al. (2011)
thick, with one pit left open to supply backlight and the other a roofed observation pit. Features such as crusts and hoar layers were easily identifiable from the observation pit on the backlit wall (Fig. 2). Pit walls were observed, mapped, sampled, and photographed (tripod-mounted, > 1/4 s expo-sures). Each pit was oriented so the prevailing wind direc-tion, approximately north–south, ran from right to left along the backlit wall.
An AWS on site at WAIS Divide (named Kominko-Slade in the University of Wisconsin AWS system; Lazzara et al., 2012), collected data on temperature, air pressure, wind, and humidity starting in the 2009–2010 season (all dates and times are GMT). Beginning in 2011–2012, upward-facing and downward-upward-facing shortwave LI-COR LI200 pyra-nometers were added initially 1 m above the surface to measure incoming and outgoing shortwave radiation (0.4– 1.1 µm spectral response). Both sensors were newly cali-brated and mounted in a cosine-corrected head (for solar an-gles up to 80◦), with typical operational errors in daylight of ±3 % (max ±5 %). A Kipp & Zonen CNR2 net radiome-ter with upward- and downward-facing pyranomeradiome-ters and pyrgeometers was added on an AWS mounting arm during the 2012–2013 season, in order to measure both net short-and longwave radiation. This instrumentation replaced the previous LI-COR instrumentation. The pyranometers opated with a spectral response of 0.3–2.8 µm, operational er-rors of ±3.5 %, and sensitivity of 15.21 µV W−1m−2, while
the pyrgeometers operated with a spectral response of 4.5– 45 µm, operational errors of ±5.6 %, and a sensitivity of 12.52 µV W−1m−2; typical impedances were ∼ 7 ohms. All AWS relative humidity values reported here are expressed in terms of saturation vapor pressure over ice and corrected for low-temperature offsets (see Anderson, 1994).
Also during the 2012–2013 season, we calibrated and in-stalled five PRD (platinum resistance detector) strings in the upper 5 m of snow in a 2 km survey line extending approxi-mately upwind (grid west, true north) starting ∼ 50 m from the on-site AWS. The strings were designed by one of us (At-suhiro Muto) following the procedures in Muto et al. (2011). Each sensor string was 5 m long and consisted of 16 individ-ual PRDs (HEL-700 series; ±0.03◦C accuracy, ±0.18◦C
to-tal combined error, including data-logger error) with denser sampling in the shallower snow to capture the greater vari-ability there (see also Supplement Table S2). Sensor cali-bration took place over a 60 min period using a constantly stirred ice-bath method, and then the newly calibrated sen-sors were deployed incrementally over a 10-day period start-ing 15 December. Deployment boreholes were drilled usstart-ing a 4 cm diameter hand auger and then back-filled once strings were installed. Campbell logging equipment (CR1000 data logger and AM/16/32 Multiplexer) and 12 V sealed lead-acid batteries were housed in a foam-insulated wooden box be-side each borehole and just below the surface. The first string was placed 50 m from the AWS, and the other strings were placed upwind of it by 10, 100, 1000, and 2000 m (Table S3). Measurements were taken every minute over the survey inter-val. Each 12 V battery was swapped out weekly with newly charged replacements to ensure that the sensor strings were continually recording. During each site visit, we took pho-tographs and noted local meteorological and surface condi-tions. Each sensor string took approximately 24 h to equili-brate with the surrounding snow following installation due to the backfilling of the open boreholes with surface snow.
We studied crusts in the ice core as well as near the sur-face. As described in Fitzpatrick et al. (2014), the entire deep core and various associated shallower cores were in-spected visually during core processing lines at the US Na-tional Ice Core Laboratory, primarily by one of us (Matthew K. Spencer), but with some intercomparisons from other ob-servers. The core was observed on a light table in a dark-ened booth, and key features were noted on meter-length log books. The crusts were easily visible as thin, glassy, bubble-free or nearly bubble-bubble-free layers (e.g., Fig. 1).
Annual cycles are visible in the bubbly part of the core, arising from the tendency for near-surface processes to gen-erate coarse-grained, low-density layers including depth hoar in summer (Fitzpatrick et al., 2014; Fegyveresi, 2015). How-ever, annual-layer dating of the ice core using electrical con-ductivity (ECM, which is primarily controlled by ice chem-istry) and soluble-ion chemistry proved more accurate than dating with visible strata (Buizert et al., 2015; Sigl et al., 2016; WAIS Divide Project Members, 2013). Here, we
es-(a)
(b)
Figure 3. Surface “glaze” (a) that formed on a calm, sunny day (23 December 2012) at WAIS Divide, and the subsequent surface hoar layer (b) that formed on its surface after several calm days.
timate the season in which each crust occurs by assigning each summertime peak in the WD2014 timescale to 1 Jan-uary of its year and then linearly interpolating; accumulation at the site is relatively evenly distributed through the year, justifying this approximation (Banta et al., 2008; Fegyveresi, 2015; Fegyveresi et al., 2016).
3 Observations
3.1 Near-surface observations
We summarize key observations on crust formation here. Additional information, and complete narrative descriptions of particular crust-forming episodes, are provided in Fe-gyveresi (2015).
Glazed crusts were repeatedly observed to form on the snow surface (Figs. 3 and 4), primarily during late Decem-ber and January, with an interval between formation events of roughly 1 and 2 weeks (see Figs. 5–8). Crust formation often followed a storm or wind event and occurred during a time of higher atmospheric pressure, light winds, clear sky, strong insolation, large diurnal temperature cycling, and low relative humidity.
As shown in Fig. 9, the crusts were often internally com-plex. The upper few millimeters of the surface snow were anomalously high-density (> 400 kg m−3) and fine-grained, and might be termed a multi-grain crust. Within this, and es-pecially at the top, were one or more lower-porosity single-grain crusts. To an observer, light reflected off these crusts gave the appearance of a glaze on the snow surface (e.g., Fig. 4) (see also Orsi et al., 2015, their Fig. 5).
Typically, a glazed crust started as isolated sub-meter to few-meter patches on unshaded regions of the snow surface or sastrugi, which were most consistently exposed to sun-light, and spaced tens of meters to more than 100 m apart. The spatial size and extent of glazed crust patches varied con-siderably and were not measured directly; however, no single observed crust patch was greater than 100 m in length in any
(a)
(b)
30 cm 5 cm
(c)
Figure 4. Surface “glaze” seen at the WAIS Divide site (a). A zoomed-in view shows the polygonal cracking that initiates at the surface from thermal contraction, following several sunny, clear-sky days (b). Closer inspection reveals greater detail and scale of a crack triple junction (c).
dimension. Over the first days of formation, glazed crusts ex-panded to form a laterally extensive interconnected surface broken by isolated sub-meter to few-meter unglazed patches on shaded faces of sastrugi. Glazed crusts were most con-tinuous where the surface was smoothest. Reconnaissance surveys extending a few kilometers from camp showed that glazed-crust formation was consistent at least that far.
Within 2–3 days of formation, glazed features developed prominent polygonal cracks with few-meter spacing (e.g., Fig. 4). It is likely that these cracks formed by thermal con-traction during nighttime cooling, which was driven by the large diurnal temperature swings observed at the time (see below). We excavated some cracks, which could be traced downward from the surface typically ∼ 20–30 cm.
A pronounced hoar began forming within 24 h of the onset of cracking of the glazed crust in each case observed (e.g., Fig. 3). Measured relative humidity was notably higher dur-ing hoar formation (see Figs. 5–8) than before, and some-times (e.g., 7 January 2010) a fog developed early during hoar formation, providing a source of vapor to the surface
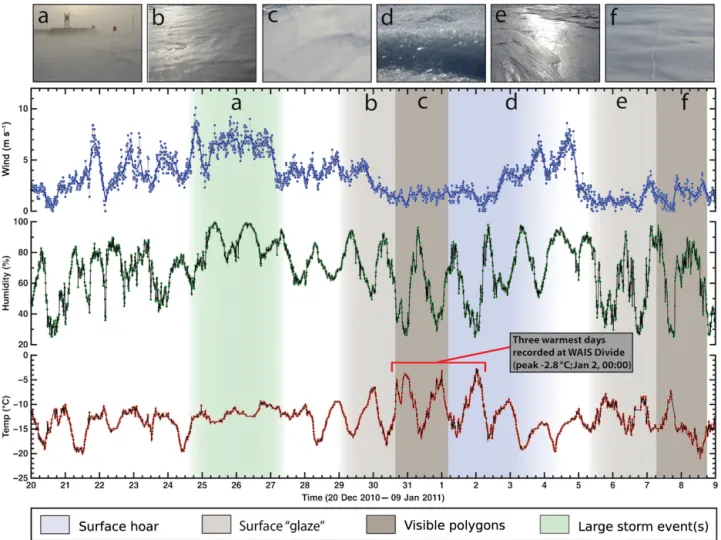
Figure 5. Surface evolution over 29 days in the 2009–2010 season, and AWS data. Shading shows episodes of surface hoar, glazes, and polygonal cracking; storm events are also shown. Letters near the top refer to photographs above of specific features or events. All dates and times are GMT (WAIS local time −12 h). The errors for all AWS instruments are listed in Table S1.
hoar from above. Surface glazing was not required for for-mation of such hoar layers, as one formed quickly on 30 De-cember 2009 during a very warm (> −10◦) fog episode with elevated measured relative humidity, but without prior for-mation of surface glaze.
Hoar layers that we observed during the field seasons were subsequently buried, destroyed by wind, or gradually subli-mated away over 2–3 additional days. We observed strong winds remove hoar layers, with a threshold of ∼ 7 m s−1 (∼ 13 knots). In one case, hoar removal required somewhat lower speed when wind was directed orthogonal to the pre-vailing direction and thus sastrugi orientation, similar to ob-servations by Champollion et al. (2013) at Dome C, East Antarctica.
No above-freezing temperatures were observed by the AWS, but on 2 January 2011 the temperature reached a high of −2.8◦C (see Fig. 6; Supplement Fig. S1). While no di-rect surface melt was observed, some melt was noted along exposed, vertically cut wall faces near the ice core drilling facility (Fig. S2). A prominent multi-grain crust was
ob-served the next year in snow pits, likely dates from that time, and shows features that are consistent with some melting– refreezing having occurred (Fig. S3).
The PRD strings document strong variations in subsurface temperature, following the air temperatures as expected. Dur-ing the coolDur-ing phases of diurnal cycles, air temperatures (AWS) and near-surface snow temperatures (S0) dropped well below temperatures deeper in the snow, including the shallowest in-snow sensor (S1) at ∼ 20 cm (Figs. 10 and 11), with the surface as much as 3◦C colder than snow at 40 cm (S2) depth (e.g., Fig. S4). This would have driven upward mass flux from the deeper snow towards the surface. Such conditions often developed when surface hoar was forming from fog, and thus likely with a downward as well as an up-ward vapor source to the near-surface layer.
3.2 Snow pit observations
Each of the five snow pits showed a clear annual cycle in the visual stratigraphy, but with notable “noise”. Depth hoars
Figure 6. Surface evolution over 20 days in the 2010–2011 season, and AWS data. Shading shows episodes of surface hoar, glazes, and polygonal cracking; storm events are also shown. Letters near the top refer to photographs above of specific features or events. All dates and times are GMT (WAIS local time −12 h). The errors for all AWS instruments are listed in Table S1.
occurred primarily in summertime layers and into autumn, but with occasional hoar layers in winter and spring layers. Crusts were also most common in summertime and into au-tumn, but not restricted to those times. Similar to the obser-vations made by Alley (1988) at other sites in Antarctica, sequences of strata at WAIS Divide typically showed lat-eral continuity over 2 m scales, although with some varia-tion. Many graded beds were also present, likely indicative of changes during a specific storm event or primarily before the next storm. This was later confirmed on site with accu-mulation stakes and measurements following specific large storm events (see also Koffman et al., 2014; Criscitiello et al., 2014).
The snow pits from the 2008–2009, 2009–2010, and 2010–2011 seasons at WAIS Divide were mapped here in greatest detail, and meter-wide sub-swaths of their complete pit wall maps are shown in Fig. 12. Complex stratigraphy and variations are clearly discernable and illustrate the variabil-ity within 1 km of each other at WAIS Divide in contiguous years. This is likely indicative of the influence of complex
processes of deposition and metamorphism, with frequent occurrences of depositional and erosional features (sastrugi, whalebacks, wind scoops, hollows, etc.). We chose annual layers in the pit maps based upon visual inspection in the field, subsequent examination of photographs of the pits, and overall trends in measured densities (see, e.g., Fig. 13).
We measured pit bulk densities using 100 cm3 stainless-steel, box-type cutters (e.g., Conger and McClung, 2009) and a digital scale accurate to 0.1 g. Density samples were taken in all five concurrent seasons’ pits in duplicate, at ∼ 5 cm intervals, from the pit side wall (so as not to disturb the back-lit wall). These duplicates were then averaged together for final values. Samples measured in the 2008–2009 pit were taken with regards to marked strata, and therefore at a slightly higher frequency. Density measurements from pits of all five seasons yielded an average density of 386.6 ± 3.2 kg m−3for the upper 2 m of snow (Fig. 14), all with a nearly identical linear trend-line slope of ∼ 0.4 kg m−3cm−1with depth.
Seasonal interpretations of all five pits indicated an av-erage of ∼ 3.75 years of accumulation recorded over the
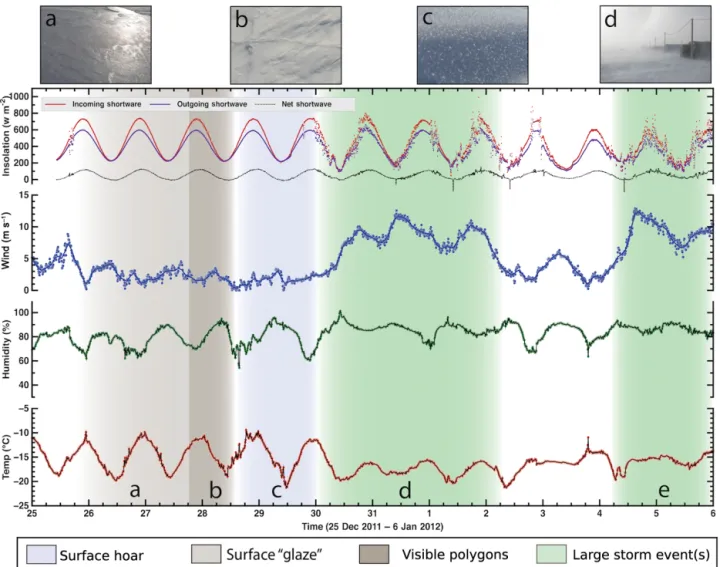
Figure 7. Surface evolution over 12 days in the 2011–2012 season, and AWS data. Shading shows episodes of surface hoar, glazes, and polygonal cracking; storm events are also shown. Letters near the top refer to photographs above of specific features or events. All dates and times are GMT (WAIS local time −12 h). The errors for all AWS instruments are listed in Table S1.
2 m depths, which yields an average of ∼ 0.53 m a−1 of accumulation at the average pit snow density. When con-verted to water equivalent, this becomes ∼ 0.20 m a−1w.e. (or ∼0.22 m a−1ice). These values agree closely with recently pub-lished values (WAIS Divide Project Members, 2013; Banta et al., 2008; Burgener et al., 2013).
We documented obvious crusts and hoar layers for each snow pit. Most commonly, crusts occurred just above depth hoars, but crusts were observed without hoar, and hoar with-out crust. Both single-grain-thick (∼ 1 mm) and multi-grain (≥ 4 mm) crusts were observed, with the common associa-tion of single-grain crusts in and usually at the top of multi-grain crusts as noted above. All crusts had densities esti-mated over 400 kg m−3. When a multi-grain crust containing a single-grain crust is counted as one feature, the five 2 m snow pits revealed an average of ∼ 18.8 ± 2.5 (±1σ ) total crusts, or approximately 5 crusts year−1.
3.3 Ice core data
In the bubbly ice included in our crust logging (120–577 m depth) in the WAIS Divide core, 10 268 crusts were identi-fied (Fig. 15). A few were discontinuous across the core, or displayed at least a few pores extending through; others ap-peared largely or completely continuous and impermeable at the scale of the core. Experience with independent observers showed little or no error in crust identification. We cannot rule out the possibility that bubble migration contributed to loss of some crusts in the deepest bubbly ice considered, but the crusts continued to be clear and readily identifiable, so we do not believe that the trend to fewer crusts in the deep-est ice is an artifact. We cannot fully exclude the possibility that there is an observational bias related to the drop in crust prevalence over the most recent ∼ 250 years, as the crusts are more difficult to discern in the shallow firn and snow.
Figure 8. Surface evolution over 12 days in the 2012–2013 season, and AWS data. Shading shows episodes of surface hoar, glazes, and polygonal cracking; storm events are also shown. Letters near the top refer to photographs above of specific features or events. All dates and times are GMT (WAIS local time −12 h). The errors for all AWS instruments are listed in Table S1.
1 mm
Surface crust
Low-density hoar layer
Figure 9. A surface snow sample excavated from a glazed area at WAIS Divide before the onset of polygonal cracking, show-ing a couplet of an evolved ∼ 3 mm high-density (> 400 kg m−3), multi-grain surface crust containing single-grain crusts and overly-ing a lower-density (< 300 kg m−3) hoar layer.
The seasonal distribution of the crusts is shown in Fig. 16. Crusts occur year-round but are ∼ 45 % more frequent in summertime accumulation than in wintertime. Certainly, the natural variability in seasonal distribution of snow accumu-lation and in the timing of peak impurity input means that details of the shape of the seasonal distribution of crust oc-currence are notably uncertain. However, given the high reli-ability of the annual-layer dating, and the multiple indicators that agree well (Buizert et al., 2015; Sigl et al., 2016; WAIS Divide Project Members, 2013), “summer” vs. “winter” or “nonsummer” is well-constrained.
Time trends of seasonal crust occurrence are also shown in Fig. S5, separating the largely sunless winter (May–August) from the sunny spring, summer, and fall (September–April, with at least 8 h of sunlight per day). Both first increase and then decrease slightly over the 2400-year record, but with a larger relative change in the sunlight season.
Figure 10. Temperature measurements (1 min interval) in snow from the 2012–2013 season, from the uppermost three PRDs (surface down to 40 cm). Data are from the four sensor stations closest to the station. The shaded area corresponds to an episode of glaze and hoar growth (see Fig. 8). Distinct near-surface temperature inversions occurred each night during this 3-day period (see Fig. 11). Sensor #4 was not installed until 22 December and therefore did not equilibrate until early on the 23 December as indicated. Air temperature is also shown as recorded by the AWS (errors listed in Table S1). The AWS temperature sensor is located ∼ 1 m above the snow surface. All dates and times are GMT (WAIS local time −12 h).
Figure 11. Snapshot temperature readings for PRD-string stations #1–4, taken on 24 December 2012 at ∼ 12:30 GMT, showing the temper-ature inversion with colder air (AWS data) and upper surface over warmer near-surface snow.
Figure 12. Complete wall maps of backlit snow pits prepared during 2008–2009, 2009–2010, and 2010–2011 WAIS Divide field seasons. Layering and density contrast are noted by degree of shading. Fine- to medium-grained, higher-density snow layers are shown with darker grey coloring, whereas coarse-grained and low-density layers (e.g., depth hoar) are shown in white. Crusts are indicated with solid lines, while dotted lines are used to represent cross-bedding at depth. Years were identified based on approximate depths of peak summers and the average measured densities. The pit wall surfaces trend in parallel with the prevailing wind direction at WAIS Divide (approximately north–south, with north to the right).
4 Synopsis and discussion
Our observations confirm and extend prior work on this topic (see, e.g., Anderson and Benson, 1963). Depositional pro-cesses and metamorphism primarily in the upper few cen-timeters of near-surface snow produce prominent layering. Wintertime accumulation, while notably variable, is more homogeneous than summertime deposits, with wind-packed layers prominent in winter and more-variable layers includ-ing crusts and hoar more common in summer (e.g., Sorge, 1935; Benson, 1962; Gow, 1965, 1969; Weller, 1969; Col-beck, 1982, 1983; Alley, 1988; Alley et al., 1997). These fea-tures are altered during subsequent burial and conversion to bubbly ice but still produce recognizable features in the ice core that allow identification of annual layers and crusts (e.g., Alley et al., 1997; Fitzpatrick et al., 2014).
Our observations at WAIS Divide show repeating events that generate the main features of the summertime accu-mulation. In a typical event, a storm with strong winds brings snow accumulation, followed by a high-pressure sys-tem bringing clear skies, greatly reduced winds, initially low humidity, and strong diurnal variations in sunshine, air tem-perature, and net surface energy balance.
Early in this clear-sky interval, the wind-packed upper surface develops a millimeter-thick glazed crust or possibly crusts in a few-millimeters-thick multi-grain crust. Strength-ening of crusts over one to a few days is followed by polyg-onal cracking from contraction caused by nighttime cool-ing. Vapor released through the cracks contributes to rising relative humidity and surface hoar deposition in subsequent nights. At WAIS Divide, evolution of the crust-hoar complex typically is truncated by arrival of another storm, which may
Figure 13. A detailed view of data for snow pit 2008-09-A, includ-ing wall map, density profile, annual layer picks, and crust occur-rences. Density, layering, and feature preservation are again noted as in Fig. 12. Individual crusts are identified with a labeled “c” along the vertical axis. Seasonal accumulation layers were “picked” visu-ally in the pit (shown with red and blue arrows). These observations indicate a somewhat regular pattern of equally distributed yearly accumulation at WAIS Divide with clear annual signals.
remove or bury the hoar, and typically buries the crusts be-low the level of fastest metamorphism, albe-lowing them to be preserved.
Not every aspect of a typical event is observed in each case. Crusts form and can be buried by additional snowfall without growth of a surface hoar on top of them. Crusts are somewhat discontinuous, and surface hoar can grow where a crust is absent. And, perhaps most importantly here, a crust that remains near the surface (in the upper few centimeters) for too long may slowly lose mass and cease to be a crust.
Our data provide strong constraints on models of many of the observed processes. Surface hoar grew especially at night when relative humidity was high, sometimes with fog,
and with deposition occurring on tent ropes or other surfaces as well as on the snow surface (e.g., Fig. S6), clearly demon-strating a source of vapor from above. Surface hoar typically formed however, when the upper snow surface was colder than layers beneath, indicating a vapor source from below. Hence, our surface hoars included elements of both depo-sitional and sublimation hoar crystals as defined by Gallet et al. (2014) based on observations at Dome C, East Antarc-tica (with sublimation growth being the dominant process).
The high density of both single-grain and multi-grain crusts, approaching the density of ice for the glassy single-grained crusts, requires that the density of the crusts in-creased over time, as wind packing has not been observed to approach these high densities. Crusts form during days when atmospheric humidity is low, however, and thus when mass is not being added from above. We have not observed bulk melting at the site (with the one possible exception noted above), nor do the gas measurements of Orsi et al. (2015) in-dicate bulk melting, so the density increase must arise from some combination of vapor diffusion from below and surface or volume mass transfer likely involving pseudo-liquid layers (Dash et al., 2006), as discussed next.
The data here show that frequently the upper surface is colder than snow beneath, which will lead to upward mass flux. We lack sub-centimetric resolution in thermometry, but physical understanding indicates that very strong gradients likely develop on the centimeter scale just below the upper surface during rapid nighttime cooling. Physical understand-ing, the data here, and data from previously published studies indicate that intense sunshine generates a temperature max-imum in the snow just below the surface (order of 1 cm) es-pecially in low-density, low-thermal-conductivity depth hoar (e.g., Alley et al., 1990; Brandt and Warren, 1993), also con-tributing to upward vapor transport. Hence, the upper surface is expected to gain mass from below during the crust- and hoar-forming events (Alley et al., 1990). Windy conditions would drive undersaturated air into and out of pore spaces, removing mass, but crusts form during relatively still times. The temperature gradients (and noted inversions) measured here at WAIS Divide (see also Figs. 10 and 11, and Fig. S4) are similar to those observed at GISP2 by Alley et al. (1990) and more than sufficient to move the necessary vapor for crust development.
We hypothesize here that these surface conditions cause mass fluxes that fill in open pores in wind-packed layers at the surface to form glazed crusts. A physical model might be based on the following considerations. The thermal con-ductivity of ice greatly exceeds that of air, so heat transport in near-surface snow is primarily conductive. Ordinarily, the grain curvature adjacent to pores tends to cause diffusive mass loss, enlarging pores by filling necks between grains or other regions of lower vapor pressure. However, because heat flow is primarily through the grain structure, pores in a surface crust will tend to be colder than interconnected grains when the upper surface is colder than the snow
be-Figure 14. Density profiles measured in snow pits from five concurrent seasons at WAIS Divide (2008–2012). Each pit showed a high degree of sample-to-sample variability as measured densities were widely spaced within the upper 2 m of snow; estimated annual signals were still identifiable, however. Measurements yielded an overall average density of 386.6 ± 3.2 kg m−3for the upper 2 m of snow across all five pits, with nearly identical linear trend-line slopes of ∼ 0.4 kg m−3cm−1with depth.
Figure 15. History of crust occurrence (crusts year−1) in the bubbly-ice zone of the WDC06A core that we studied in detail (∼ 120–577 m depth); ages (CE) are from the WD2014 depth–age scale. A total of 10 268 unique crusts were documented in the core, for an average rate of 4.3 ± 2 per year (dashed blue line). Data are shown as 20-year moving averages for ease of view, with an added 1st-order LOESS smoothing trend curve (200-year bin width). The sharp decline in crust prevalence after ∼ 1750 CE may be due to observational biasing in the shallow firn and snow.
Figure 16. Crust distribution by month (1: January; 2: February; . . . ; 12: December) based on the assumption that each summer pick in the WD2014 depth–age scale is 1 January, and then interpolating linearly. Crusts occur year-round but more commonly in summer accumulation. The smoothed curve is a 1st-order LOESS trend curve (width = 2). Data shown for 2400-year record. Inset shows average crusts per month (±1σ ).
Air (cold)
Pore
(temperature decreases along arrow)Firn (warm)
Mass flow Heat flowFigure 17. Schematic illustrating possible mass and heat trans-ports during formation of a single-grain glazed crust, when the near-subsurface is warmer than the surface. Heat flow is primar-ily through the grain structure (blue), so pores (white) in the surface layer will be colder than interconnected grains, favoring mass trans-port from the grains to those pores, increasing density of the surface layer.
neath, favoring mass transport to the pore surfaces, as shown in Fig. 17 (e.g., Sommerfeld, 1983; Fukuzawa and Akitaya, 1993). Transport may occur by vapor, surface, or volume dif-fusion; following Alley and Fitzpatrick (1999), vapor diffu-sion and surface transport in premelted films are likely to dominate. Also, mass loss from relatively warm grain bonds just beneath a growing surface crust by diffusion to the colder crust will tend to lower the crust, increasing the likelihood
that a pore in the crust will move downward to intersect a pre-existing grain beneath, increasing the crust density.
Due to the inherent limitations with the available sensor equipment, and with the sparsity of usable data for our spe-cific periods of interest, a complete and detailed analysis of radiative forcings was not completed here. However, to fur-ther test our hypothesis and to assess the accuracy of our measurements, we did execute a simple surface energy bud-get (SEB) calculation in order to solve for the ground heat flux term QG and ultimately determine if the AWS sensor
data yield flux rates capable of the hypothesized vertical va-por transva-port in the near-surface snow. Because data from the AWS-mounted net radiometer and PRD strings were only available for the 2012–2013 field season, only that specific time window was used for this simple SEB calculation (see also Figs. 8 and 10).
The surface energy budget represents a balance of turbu-lent, radiative, and ground heat fluxes, which are all coupled through various processes (see, e.g., Hulth et al., 2010; Miller et al., 2017). Because there is no known or observed melting at the WAIS Divide site, and therefore no solid-liquid latent heat in the near-surface snow, a change in any of the SEB terms is thus balanced by changes in other terms. For sim-plicity, we represent this relationship here as
QN+QS+QL+QG=0, (1)
QN=SNET+LNET=S ↓ +S ↑ +L ↓ +L ↑, (2)
where QN is the total net radiation (SNETand LNETare the
the sensible and latent turbulent heat fluxes, respectively; and QG is the ground heat flux. The net radiation term QN was
determined by combining the short- and longwave radiation data obtained directly from the radiometer (see Fig. 8). Due to limitations with the Kipp & Zonen CNR2 sensor, only the radiative NET terms were available, not the individual in-coming (↓) and outgoing (↑) terms.
Based upon the Monin–Obukhov similarity theory, the sensible and latent heat flux terms can be expressed as QS=ρcpu∗T∗ and QL=ρLSu∗q∗, (3)
where ρ denotes air density, cp is the specific heat of dry
air at constant pressure (1005 J K−1kg−1), and LS=2.83 ×
106J kg−1 is the latent heat of sublimation. We use bulk-method approximations for the turbulent scales of wind speed (u∗), temperature (T∗), and humidity (q∗), and their
related stability correction functions (Van As et al., 2005; Andreas, 2002; Fairall et al., 1996; Holtslag and DeBruin, 1988). We also employed an optimal velocity roughness length (∼ 0.03 mm) and calculated the related roughness terms using published equations (Miller et al., 2017; Van As et al., 2005; Andreas, 1987). As previously noted, rel-ative humidity values reported here are expressed in terms of saturation vapor pressure over ice and corrected for low-temperature offsets (see Anderson, 1994). Specific humidity is calculated from relative humidity using published equa-tions (Van As et al., 2005).
Results of this SEB calculation are shown in Fig. S7, and values for ground heat flux were determined by solv-ing Eq. (1) for QG. Over the ∼ 24 h low-wind period shown
highlighted in Fig. 8 that features a surface glaze (labeled “b”), the net ground heat flux QGdoes corroborate a
condi-tion favorable for upward (negative) energy flux, particularly during the morning hours of 24 December 2012.
We calculated thermal conductivity of the uppermost snow layers as K = 0.35 ± 0.05 W m−1K−1, from our measured snow pit density data (see Fig. 14), combined with published relations between density and K (Miller et al., 2017; Jordan, 1991). Then, we used K, QG, and the equation for
conduc-tive heat flux, QG= −K
1T
1z, (4)
to calculate vertical temperature difference (1T ), over the top 20 cm (1z) (Van As et al., 2005).
Our results yield an average vertical temperature differ-ence of ∼ 3.6 ± 0.7◦C over the ∼ 24 h low-wind glaze
pe-riod highlighted in Fig. 8, or a gradient of ∼ 18◦C m−1. This
result is consistent with the PRD string data (see Figs. 10 and 11), which indicate a temperature difference between the near-surface air sensor (AWS) and the shallowest in-snow sensor (S1, 20 cm depth) of ∼ 3.0◦C during the peak of the inversion and glazing episode on 24 December 2012; the near-surface air sensor was ∼ 1 m above the surface, and we infer that, as a result, it somewhat underestimated peak 1T .
Our energy-balance calculation, although simple, retains the key physics and follows earlier work. We thus trust the basic result, with agreement between model and measured temperatures, that the energy balance generates sufficient heat fluxes to drive the vapor mass transport needed for glazed-crust development (Pinzer et al., 2012). We are confi-dent that a more comprehensive study extending this work would be instructive, with additional sampling and mod-eling addressing the overall radiative and SEB responses, boundary-layer stability responses, cloud forcings, and vapor mass flux rates.
Although summertime crusts dominate in the ice core, many wintertime crusts were identified, raising additional questions. We lack direct observations in winter and so can only speculate on mechanisms active then. However, the ba-sic picture drawn above for summertime crusts may also ap-ply in winter. The lower temperatures, and lack of intense solar heating, make crust formation less likely. However, stronger wintertime winds would allow greater wind pack-ing of the upper surface, producpack-ing fewer and smaller pores to be filled to make a thin crust and thus making crust for-mation easier. Although accumulation is more or less evenly distributed through the year, long periods of limited vari-ability observed in AWS data suggest that there may be ex-tended intervals up to weeks in length during the winter when the surface is relatively stable, partially or completely offset-ting the slower mass transport from colder temperatures. Fur-thermore, the AWS data show that mid-winter temperatures have risen as high as −15◦C during strong warming events accompanied by high winds (> 10 m s−1), likely linked to transport of air masses from the coast. Such warm air masses paired with these high winds would produce relatively high vapor pressures, contribute to greater surface packing, and promote temperature inversions and upward near-surface va-por flux during the subsequent cooling.
The great abundance of crusts at WAIS Divide compared to other ice cores we have studied may be because condi-tions are “just right” at WAIS Divide. We have observed loss of a wind-packed crust at WAIS Divide, and also at GISP2 in central Greenland; the strong mass loss from the upper ∼1 cm of the snowpack is not conducive to long-term sur-vival of any crust there (e.g., Alley et al., 1990). Low but nonzero summertime accumulation thus may lead to loss of crusts, whereas higher accumulation after formation buries them below that zone of mass loss and so allows their preser-vation. The large wintertime variability and high wintertime temperatures at WAIS Divide may be important in generating sufficiently high mass fluxes to produce wintertime crusts.
At least in summertime, crusts do seem to record a partic-ular meteorological pattern of storms alternating with still conditions. The time series of frequency of occurrence of crusts thus would be affected by a change in the frequency of occurrence of these conditions. Turning this into a pale-oclimatic indicator would require additional steps, however, as the frequency of preserved crusts could decrease because
fewer were formed or because more were destroyed, with dif-ferent causes. Information on changing frequency of meteo-rological events might be useful (e.g., Hammer, 1985; Alley, 1988). We believe that the clear association of crust forma-tion with particular events and the clear trends in crust oc-currence in the core motivate additional research on topics including crust formation in nonsummer seasons, but we do not know whether this ultimately could yield a valuable pa-leoclimatic indicator.
5 Conclusions
Summertime observations at the WAIS Divide site show that prominent visible strata form at or very near the surface dur-ing summer, by processes that typically are repeated a few times during each summer. A storm produces a wind-packed layer. The following high-pressure system brings light winds, warm days and cool nights, strong sunshine, and low relative humidity. High-density, single-grain-thick glazed crusts pref-erentially form at the surface during these high-pressure in-tervals, in as little as a single day, and then strengthen and evolve. Crusts are extensive, although typically broken by sub-meter or few-meter uncrusted regions spaced tens of me-ters to more than 100 m apart. Daytime solar heating drives upward mass transport to crusts from developing depth hoar beneath, strengthening the crusts. A simple surface energy budget calculation shows that sufficient vertical heat fluxes exist to explain both the observed near-surface temperature inversions and the vapor mass flux necessary for the associ-ated glazed-crust formation. After formation, crusts are bro-ken by polygonal cracks extending typically 20–30 cm deep, likely from contraction during nighttime cooling. Relative humidity then rises in the air above, contributing to growth of surface hoar during nighttime cooling. Subsequent storms typically bury the crust-hoar complexes, although crusts can be lost during evolving surface conditions if not buried below the top 1 cm to a few centimeters.
Study of the WAIS Divide deep core shows that crusts are preserved through the bubbly ice. Crusts are most common in layers deposited during summertime but also occur in winter accumulation. Study of AWS data suggests that the intrusion of warm coastal air during winter may generate strong tem-perature gradients, which may contribute to wintertime crust formation in wind-packed layers.
The frequency of occurrence of crusts in the core varies with time, suggesting the possibility that crusts could be used as a paleoclimatic indicator. However, additional work would be required, including addressing whether crust frequency varies because of changes in formation or changes in destruc-tion of crusts previously formed. The crusts do not produce significant anomalies in other ice core paleoclimatic records, likely at least in part because they are discontinuous and bro-ken by contraction cracks.
Data availability. Data policy: all data presented here are available via download from USAP-DC (https://doi.org/10.15784/601079, Fegyveresi and Alley, 2018) or from the WAIS Divide data portal (http://waisdivide.unh.edu).
The Supplement related to this article is available online at https://doi.org/10.5194/tc-12-325-2018-supplement.
Author contributions. AJO assisted with field observations and ex-periments. AM designed the near-surface PRD sensor strings and developed the associated logging code. MS documented all ice core crust observations during the WAIS Divide core processing at the National Ice Core Laboratory. JMF and RBA prepared the manuscript with contributions from all co-authors.
Competing interests. The authors declare that they have no conflict of interest.
Special issue statement. This article is part of the special issue “In-ternational Partnerships in Ice Core Sciences (IPICS) Second Open Science Conference (CP/TC inter-journal SI)”. It is a result of the IPICS 2nd Open Science Conference, Hobart, Australia, 7–11 March 2016.
Acknowledgements. We acknowledge the following funding sources for support of this work: US National Science Foundation Division of Polar Programs grants 0539578, 1043528, 1142085, and 1619793. We also acknowledge Donald E. Voigt, Joan J. Fitzpatrick, Eric D. Cravens, and the staff of the US National Ice Core Laboratory in Denver, Colorado, as well as the WAIS Divide Science Coordination Office at the University of New Hampshire and the Ice Drilling Design and Operations group at the University of Wisconsin. We thank numerous colleagues involved with the WAIS Divide project, especially Kendrick Taylor, Mark Twickler, and Joseph Souney. We thank Bess Koffman, Gifford Wong, Dominic Winski, Aron Buffen, and Logan Mitchell for assistance with snow pit preparation. We thank Jonathan Thom and the University of Wisconsin-Madison Automatic Weather Station Program for assistance with weather station sensor installation. Lastly, we thank our reviewers, whose thoughtful suggestions and questions served to clarify and improve the manuscript. Any use of trade, firm, or product names is for descriptive purposes only and does not imply endorsement.
Edited by: Catherine Ritz
Alley, R. B.: Concerning the deposition and diagene-sis of strata in polar firn, J. Glaciol., 34, 283–290, https://doi.org/10.3189/S0022143000007024, 1988.
Alley, R. B. and Fitzpatrick, J. J.: Conditions for bubble elongation in cold ice-sheet ice, J. Glaciol., 45, 147–153, https://doi.org/10.3189/S0022143000003129, 1999.
Alley, R. B., Saltzman, E. S., Cuffey, K. M., and Fitz-patrick, J. J.: Summertime formation of depth hoar in central Greenland, Geophys. Res. Lett., 17, 2393–2396, https://doi.org/10.1029/GL017i013p02393, 1990.
Alley, R. B., Shuman, C. A., Meese, D. A., Gow, A. J., Tay-lor, K. C., Cuffey, K. M., Fitzpatrick, J. J., Grootes, P. M., Zielinski, G. A., Ram, M., and Spinelli, G.: Visual-stratigraphic dating of the GISP2 ice core: basis, reproducibility, and application, J. Geophys. Res.-Oceans, 102, 26367–26381, https://doi.org/10.1029/96JC03837, 1997.
Anderson, P. S.: A method for rescaling humidity sensors at temperatures well below freezing, J. Atmos. Ocean. Technol., 11, 1388–1391, https://doi.org/10.1175/1520-0426(1994)011<1388:AMFRHS>2.0.CO;2, 1994.
Anderson, D. L. and Benson, C. S.: The densification and diagen-esis of snow, in Ice and Snow: Properties, Processes and Appli-cations, edited by: Kingery, W. D., MIT Press, Cambridge, MA, 391–411, 1963.
Andreas, E. L.: A theory for the scalar roughness and the scalar transfer coefficients over snow and sea ice, Bound.-Lay. Meteo-rol., 38, 159–184, https://doi.org/10.1007/BF00121562, 1987.
Andreas, E. L.: Parameterizing scalar transfer
over snow and ice: a review, J.
Hydromete-orol., 3, 417–432, https://doi.org/10.1175/1525-7541(2002)003<0417:PSTOSA>2.0.CO;2, 2002.
Banta, J. R., McConnell, J. R., Frey, M. M., Bales, R. C., and Taylor, K.: Spatial and temporal variability in snow accumulation at the West Antarctic Ice Sheet Divide over recent centuries, J. Geophys. Res.-Atmos., 113, D23102, https://doi.org/10.1029/2008JD010235, 2008.
Battle, M. O., Severinghaus, J. P., Sofen, E. D., Plotkin, D., Orsi, A. J., Aydin, M., Montzka, S. A., Sowers, T., and Tans, P. P.: Con-trols on the movement and composition of firn air at the West Antarctic Ice Sheet Divide, Atmos. Chem. Phys., 11, 11007– 11021, https://doi.org/10.5194/acp-11-11007-2011, 2011. Benson, C. S.: Stratigraphic studies on Greenland ice sheet and
a quantitative classification of glaciers, B. Am. Meteorol. Soc., 43, p. 141, Boston, MA, 1962.
Brandt, R. E. and Warren, S. G.: Solar-heating rates and tempera-ture profiles in Antarctic snow and ice, J. Glaciol., 39, 99–110, https://doi.org/10.3189/S0022143000015756, 1993.
Buizert, C., Cuffey, K. M., Severinghaus, J. P., Baggenstos, D., Fudge, T. J., Steig, E. J., Markle, B. R., Winstrup, M., Rhodes, R. H., Brook, E. J., Sowers, T. A., Clow, G. D., Cheng, H., Edwards, R. L., Sigl, M., McConnell, J. R., and Taylor, K. C.: The WAIS Divide deep ice core WD2014 chronology – Part 1: Methane synchronization (68–31 ka BP) and the gas age–ice age difference, Clim. Past, 11, 153–173, https://doi.org/10.5194/cp-11-153-2015, 2015.
Burgener, L., Rupper, S., Koenig, L., Forster, R., Christensen, W. F., Williams, J., Koutnik, M., Miege, C., Steig, E. J., Tingey, D., Keeler, D., and Riley, L.: An observed negative trend in
Antarc-tic accumulation rates from 1975 to 2010: evidence from new observed and simulated records, J. Geophys. Res.-Atmos., 118, 4205–4216, https://doi.org/10.1002/jgrd.50362, 2013.
Champollion, N., Picard, G., Arnaud, L., Lefebvre, E., and Fily, M.: Hoar crystal development and disappearance at Dome C, Antarctica: observation by near-infrared photography and passive microwave satellite, The Cryosphere, 7, 1247–1262, https://doi.org/10.5194/tc-7-1247-2013, 2013.
Colbeck, S. C.: An overview of seasonal snow
metamorphism, Rev. Geophys., 20, 45–61,
https://doi.org/10.1029/RG020i001p00045, 1982.
Colbeck, S. C.: Theory of metamorphism of dry
snow, J. Geophys. Res.-Oceans, 88, 5475–5482, https://doi.org/10.1029/JC088iC09p05475, 1983.
Conger, S. M. and McClung, D. M.: Comparison of density cut-ters for snow profile observations, J. Glaciol., 55, 163–169, https://doi.org/10.3189/002214309788609038, 2009.
Criscitiello, A. S., Das, S. B., Karnauskas, K. B., Evans, M. J., Frey, K. E., Joughin, I., Steig, E. J., McConnell, J. R., and Med-ley, B.: Tropical Pacific influence on the source and transport of marine aerosols to West Antarctica, J. Climate, 27, 1343–1363, https://doi.org/10.1175/JCLI-D-13-00148.1, 2014.
Das, S. B. and Alley, R. B.: Characterization and forma-tion of melt layers in polar snow: observaforma-tions and ex-periments from West Antarctica, J. Glaciol., 51, 307–312, https://doi.org/10.3189/172756505781829395, 2005.
Dash, J. G., Rempel, A. W., and Wettlaufer, J. S.: The physics of premelted ice and its geophysi-cal consequences, Rev. Mod. Phys., 78, 695–741, https://doi.org/10.1103/RevModPhys.78.695, 2006.
Fairall, C. W., Bradley, E. F., Rogers, D. P., Edson, J. B., and Young, G. S.: Bulk parameterization of air–sea fluxes for trop-ical ocean-global atmosphere coupled-ocean atmosphere re-sponse experiment, J. Geophys. Res.-Oceans, 101, 3747–3764, https://doi.org/10.1029/95JC03205, 1996.
Fegyveresi, J. M.: Physical Properties of the West Antarctic Ice Sheet (WAIS) Divide Deep Core: Development, Evolution, and Interpretation, PhD Thesis, The Pennsylvania State University, State College, PA, 2015.
Fegyveresi, J. M. and Alley, R. B.: WAIS Divide Surface and Snow-pit Data, 2009–2013, U.S. Antarctic Program (USAP) Data Cen-ter, Dataset, available at: https://doi.org/10.15784/601079, last access: 16 January 2018.
Fegyveresi, J. M., Alley, R. B., Fitzpatrick, J. J., Cuf-fey, K. M., McConnell, J. R., Voigt, D. E., Spencer, M. K., and Stevens, N. T.: Five millennia of surface temperatures and ice core bubble characteristics from the WAIS Divide deep core, West Antarctica, Paleoceanography, 31, 416–433, https://doi.org/10.1002/2015PA002851, 2016.
Fitzpatrick, J. J., Voigt, D. E., Fegyveresi, J. M., Stevens, N. T., Spencer, M. K., Cole-Dai, J., Alley, R. B., Jardine, G. E., Cravens, E. D., Wilen, L. A., and Fudge, T. J.: Physical prop-erties of the WAIS Divide ice core, J. Glaciol., 60, 1181–1198, https://doi.org/10.3189/2014JoG14J100, 2014.
Fukuzawa, T. and Akitaya, E.: Depth-hoar crystal-growth in the surface-layer under high-temperature gradient, Ann. Glaciol., 18, 39–45, https://doi.org/10.1017/S026030550001123X, 1993. Gallet, J.-C., Domine, F., Savarino, J., Dumont, M., and Brun,
on the Antarctic plateau, The Cryosphere, 8, 1205–1215, https://doi.org/10.5194/tc-8-1205-2014, 2014.
Gow, A.: On the accumulation and seasonal stratification of snow at the South Pole, J. Glaciol., 5, 467–477, https://doi.org/10.3189/S002214300001844X, 1965.
Gow, A.: On the rates of growth of grains and crys-tals in south polar firn, J. Glaciol., 8, 241–252, https://doi.org/10.3189/S0022143000031233, 1969.
Hammer, C. U.: The influence on atmospheric composition of vol-canic eruptions as derived from ice-core analysis, Ann. Glaciol., 7, 125–129, https://doi.org/10.1017/S0260305500006029, 1985. Holtslag, A. A. M. and De Bruin, H. A. R.: Applied mod-eling of the nighttime surface energy balance over land, J. Appl. Meteorol., 27, 689–704, https://doi.org/10.1175/1520-0450(1988)027<0689:AMOTNS>2.0.CO;2, 1988.
Hulth, J., Rolstad, C., Trondsen, K., and Rødby, R. W.: Surface mass and energy balance of Sørbreen, Jan Mayen, 2008, Ann. Glaciol., 51, 110–119, https://doi.org/10.3189/172756410791392754, 2010.
Jordan, R.: A one-dimensional temperature model for a snow cover: Technical documentation for SNTHERM.89, Special Report 91-16, Cold Regions Research and Engineering Laboratory (US) and Engineer Research and Development Center (US), Hanover, NH, 1991.
Koerner, R. M.: A stratigraphic method of determining the snow accumulation at Plateau Station, Antarctica, and application to South Pole-Queen Maud Land traverse 2, 1965–1966, in: Antarc-tic Snow and Ice Studies II, edited by: Crary, A. P., American Geophysical Union, Washington, DC, 225–238, 1971.
Koffman, B. G., Kreutz, K. J., Breton, D. J., Kane, E. J., Win-ski, D. A., Birkel, S. D., Kurbatov, A. V., and Handley, M. J.: Centennial-scale variability of the Southern Hemisphere west-erly wind belt in the eastern Pacific over the past two millennia, Clim. Past, 10, 1125–1144, https://doi.org/10.5194/cp-10-1125-2014, 2014.
Lazzara, M. A., Weidner, G. A., Keller, L. M., Thom, J. E., and Cassano, J. J.: Antarctic automatic weather station program 30 years of polar observations, B. Am. Meteorol. Soc., 93, 1519– 1537, https://doi.org/10.1175/BAMS-D-11-00015.1, 2012. Miller, N. B., Shupe, M. D., Cox, C. J., Noone, D., Persson, P. O.
G., and Steffen, K.: Surface energy budget responses to radia-tive forcing at Summit, Greenland, The Cryosphere, 11, 497– 516, https://doi.org/10.5194/tc-11-497-2017, 2017.
Mitchell, L. E., Buizert, C., Brook, E. J., Breton, D. J., Fe-gyveresi, J., Baggenstos, D., Orsi, A., Severinghaus, J., Al-ley, R. B., Albert, M., and Rhodes, R. H.: Observing and modeling the influence of layering on bubble trapping in polar firn, J. Geophys. Res.-Atmos., 120, 2558–2574, https://doi.org/10.1002/2014JD022766, 2015.
Muto, A., Scambos, T. A., Steffen, K., Slater, A. G., and Clow, G. D.: Recent surface temperature trends in the inte-rior of East Antarctica from borehole firn temperature measure-ments and geophysical inverse methods, Geophys. Res. Lett., 38, L15502, https://doi.org/10.1029/2011GL048086, 2011. Orsi, A. J., Kawamura, K., Fegyveresi, J. M., Headly, M. A.,
Al-ley, R. B., and Severinghaus, J. P.: Differentiating bubble-free layers from melt layers in ice cores using noble gases, J. Glaciol., 61, 585–594, https://doi.org/10.3189/2015JoG14J237, 2015. Pinzer, B. R., Schneebeli, M., and Kaempfer, T. U.:
Va-por flux and recrystallization during dry snow metamor-phism under a steady temperature gradient as observed by time-lapse micro-tomography, The Cryosphere, 6, 1141–1155, https://doi.org/10.5194/tc-6-1141-2012, 2012.
Sigl, M., Fudge, T. J., Winstrup, M., Cole-Dai, J., Ferris, D., Mc-Connell, J. R., Taylor, K. C., Welten, K. C., Woodruff, T. E., Adolphi, F., Bisiaux, M., Brook, E. J., Buizert, C., Caffee, M. W., Dunbar, N. W., Edwards, R., Geng, L., Iverson, N., Koff-man, B., LayKoff-man, L., Maselli, O. J., McGwire, K., Muscheler, R., Nishiizumi, K., Pasteris, D. R., Rhodes, R. H., and Sowers, T. A.: The WAIS Divide deep ice core WD2014 chronology – Part 2: Annual-layer counting (0–31 ka BP), Clim. Past, 12, 769– 786, https://doi.org/10.5194/cp-12-769-2016, 2016.
Sommerfeld, R. A.: A branch grain theory of temperature gradi-ent metamorphism in snow, J. Geophys. Res.-Oceans, 88, 1484– 1494, https://doi.org/10.1029/JC088iC02p01484, 1983. Sorge, E.: Glaziologische Untersuchungen in Eismitte, in:
Glaziolo-gie, edited by: Brockamp, B., and others, Leipzig, FA Brockhaus, 935, 62–270, 1935.
Van As, D., Van Den Broeke, M., and Van De Wal, R.: Daily cycle of the surface layer and energy balance on the high Antarctic Plateau, Antarct. Sci., 17, 121–133, https://doi.org/10.1017/S095410200500252X, 2005.
WAIS Divide Project Members: Onset of deglacial warming in West Antarctica driven by local orbital forcing, Nature, 500, 440–444, https://doi.org/10.1038/nature12376, 2013.
Weller, G.: The heat and mass balance of snow dunes on the central Antarctic Plateau, J. Glaciol., 8, 277–284, https://doi.org/10.3189/S0022143000031257, 1969.