HAL Id: cea-02476112
https://hal-cea.archives-ouvertes.fr/cea-02476112
Submitted on 12 Feb 2020
HAL is a multi-disciplinary open access
archive for the deposit and dissemination of
sci-entific research documents, whether they are
pub-lished or not. The documents may come from
teaching and research institutions in France or
abroad, or from public or private research centers.
L’archive ouverte pluridisciplinaire HAL, est
destinée au dépôt et à la diffusion de documents
scientifiques de niveau recherche, publiés ou non,
émanant des établissements d’enseignement et de
recherche français ou étrangers, des laboratoires
publics ou privés.
Asmae El Maangar, Johannes Theisen, Christophe Penisson, Thomas Zemb,
Jean-Christophe Gabriel
To cite this version:
Asmae El Maangar, Johannes Theisen, Christophe Penisson, Thomas Zemb, Jean-Christophe Gabriel.
Microfluidic Study of Synergic Liquid-Liquid Extraction of Rare Earth Elements. Physical Chemistry
Chemical Physics, Royal Society of Chemistry, 2020, 22, pp.5449-5462. �10.1039/C9CP06569E�.
�cea-02476112�
PCCP
Physical Chemistry Chemical Physics
rsc.li/pccp
ISSN 1463-9076 PAPER H.-P. Loock et al.
Determination of the thermal, oxidative and photochemical degradation rates of scintillator liquid by fluorescence EEM spectroscopy
Volume 19 Number 1 7 January 2017 Pages 1-896
PCCP
Physical Chemistry Chemical PhysicsThis is an Accepted Manuscript, which has been through the
Royal Society of Chemistry peer review process and has been
accepted for publication.
Accepted Manuscripts are published online shortly after acceptance,
before technical editing, formatting and proof reading. Using this free
service, authors can make their results available to the community, in
citable form, before we publish the edited article. We will replace this
Accepted Manuscript with the edited and formatted Advance Article as
soon as it is available.
You can find more information about Accepted Manuscripts in the
Information for Authors
.
Please note that technical editing may introduce minor changes to the
text and/or graphics, which may alter content. The journal’s standard
Terms & Conditions
and the
Ethical guidelines
still apply. In no event
shall the Royal Society of Chemistry be held responsible for any errors
or omissions in this Accepted Manuscript or any consequences arising
from the use of any information it contains.
Accepted Manuscript
This article can be cited before page numbers have been issued, to do this please use: A. EL MAANGAR, J. Theisen, C. Penisson, T. Zemb and J. P. GABRIEL, Phys. Chem. Chem. Phys., 2020, DOI:
ARTICLE
Received 00th January 20xx, Accepted 00th January 20xx DOI: 10.1039/x0xx00000x
Microfluidic Study of Synergic Liquid-Liquid
Extraction of Rare Earth Elements
Asmae El Maangara,b, Johannes Theisena,b, Christophe Penissona,b, Thomas Zembb, and
Jean-Christophe P. Gabriela,c *,†
A microfluidic technique is associated to X-ray fluorescence in order to investigate the origin of the so-called synergy effect observed in liquid-liquid extraction of rare earth elements (REE) when special combinations of two extractants – one solvating and one ionic- are used.The setup enables kinetic studies by varying the two phases’ contact time. Results obtained are compared to those obtained using standard batch extraction method with equal contact time. We then determine variation of free energies of transfer for five rare earth elements present in solution together with a non-target ion (Fe3+) at
different pH. Analysis of the effect of temperature, as well as of surface charge density of the coexisting cations, allow separating electrostatic from complexation effects. We finally show that all non-linear (synergic) effects are quadratic in mole fraction. This demonstrates that in-plane mixing entropy of the bent extractant film, in the first nanometer around rare earth ions, is the determining term in the synergy effect. Surprisingly, even when the third phase is present, free energies of transfer could still be measured in the diluted phase, which is reported for the first time, to our knowledge. We hence show that the extractive power of the dense third phase is stronger than conventional reverse aggregates in equilibrium with excess water.
Introduction
With increased scarcity and/or strategic importance of many
chemical elements of the periodic table,1-4there is a large thrust
in research efforts for new economically viable processes for the recycling of such elements from the “Urban Mine”, ca. our
wastes.5-7 A critical example can be found in the case of rare
earth elements (REE) that are key elements in so many applications surrounding us, especially in the electronic and
energy sector.3, 8, 9 Many of such processes are based on
liquid-liquid extraction,10-14 hence making use of very complex
formulations, often refered to as complex fluids.13, 15 Ions
transfer between two phases and its driving force have been the subject of many kinetic, thermodynamic, theoretical, and modeling studies which require years of research with yet many
remaining unknowns.11, 16-20.21-22 In addition to this complexity,
even when promising hydrometallurgy processes are described, their use by the recycling industry is hindered by the cost associated with the use of very low pH, as well as the variability
in elemental composition from one waste lot to the other. The industry is therefore not only in need for more efficient approaches that can work at higher pH and show higher performances but also of methods enabling faster speed of process development or adjustment. In order to reduce time and volume, relying on microfluidic devices represent a very
promising route.15, 22-30 Indeed, since the pioneering work of
Ismagilov and co-workers,22 microfluidics has developed as a
popular method to save quantities of test materials needed to complete experimental plans in formulating efficient processes. The main difficulties in using microfluidics instead of the old “batch” method are related to the adsorption of electrolytes on all interfaces present as well as to the sensitivity required in element analysis. These effects contribute to uncertainty in final
result.31 The precise control of kinetics effects limited by
diffusion in thin channels depends on the design strategy chosen (membrane, membrane-less, bubble, droplet). In a preliminary paper, we have shown that the presence of a membrane does not limit the transfer observed and can be considered as an alternative to the most popular strategy based
on droplets.32
In this paper we report on the interest of chemical analysis of all four microfluidic channels (aqueous/oil, in & out), which enable accurate measurements of concentrations ratio
[Ion]out/[Ion]in (both in water and oil). We show that such a
microfluidic study, here applied to a very promising synergic
system formed by two different extracting molecules,33 allows
for: (i) classical yield measurements, but also, and for the first time to our best knowledge; (ii) the measurement of Gibbs free
a. Institut de Recherche Interdisciplinaire de Grenoble, IRIG, Univ. Grenoble Alpes,
IRIG-MEM, F-38000 Grenoble, France.
b. Institut de Chimie Séparative de Marcoule, ICSM, Univ Montpellier, CEA, CNRS,
ENSCM, Marcoule, France.
c. Nanoscience and Innovation for Materials, Biomedecine and Energy (NIMBE),
CEA/CNRS/Univ. Paris-Saclay, CEA Saclay, F-91191 Gif-sur-Yvette.
* Corresponding authors: JCP Gabriel (jean-christophe.gabriel@cea.fr)
† Current address: Energy Research Institute @ NTU (ERI@N), Nanyang Technological University, Singapore.
Electronic Supplementary Information (ESI) available: [details of any supplementary information available should be included here]. See DOI: 10.1039/x0xx00000x
Physical
Chemistry
Chemical
Physics
Accepted
Manuscript
Open Access Article. Published on 05 February 2020. Downloaded on 2/12/2020 1:42:18 PM.
This article is licensed under a
Creative Commons Attribution-NonCommercial 3.0 Unported Licence.
View Article Online
energies of transfer reaction and thus not only for Winsor II but
also Winsor III data points.14, 34, 35
Experimental
Chemicals
The solvating extractant
N,N'-dimethyl-N,N'-dioctylhexyl-ethoxymalonamide (DMDOHEMA) was purchased from Panchim SARL (Lisses, France) with a purity higher than 99%, determined by gas chromatography coupled to mass spectrometry (GC-MS). The cation exchanger Bis(2-ethylhexyl)phosphoric acid (HDEHP) was purchased from Sigma Aldrich with a purity higher than 97%. Isane® IP175 was purchased from Total Special fluids. Water was deionized using a Millipore Milli-Q purification system (Merck Millipore, Billerica, MA). All other chemicals where purchased from commercial
sources: 70% Nitric acid HNO3 (Sigma Aldrich), Lanthanum(III) nitrate
hexahydrate La(NO3)3·6H2O (Sigma Aldrich; purity,> 99,99%),
Neodymium(III) nitrate hexahydrate Nd(NO3)3·6H2O (Sigma Aldrich;
purity,> 99,9%), Europium(III) nitrate hexahydrate Eu(NO3)3·6H2O
(Sigma Aldrich; purity,> 99,9%), Dysprosium(III) nitrate hexahydrate
Dy(NO3)3·6H2O (Sigma Aldrich; purity,> 99,9%), Ytterbium(III) nitrate
hexahydrate Yb(NO3)3·6H2O (Sigma Aldrich; purity, > 99,9%) and
Iron(III) nitrate nonahydrate Fe(NO3)3·9H2O (Sigma Aldrich; purity, >
99,999%). All chemical products were used without further purification.
Solution preparation
For all samples, organic phases containing both extracting molecules DMDOHEMA and HDEHP were prepared with a well-defined quantity of the two extractants at different molar fractions of DMDOHEMA varying from 0 to 1 in steps of 0.25 (as reported in Table 1 of Supplementary Materials) diluted in Isane® IP175. Solutions of both extractants were prepared so
that their total concentration in extractant molecules, (Ctot =
CDMDOHEMA + CHDEHP) was fixed to 0.9 mol.L-1. This latter
concentration is chosen to be above critical aggregation
concentrations (CAC) for both extractants.33, 36
In order to measure all selectivities in a simulated although realistic case, we chose a reference aqueous solution composition that contained five lanthanides and a typical
non-target ion, Fe3+. Ln(III) and iron(III) aqueous solutions were
obtained by dissolving La(NO3)3·6H2O, Nd(NO3)3·6H2O,
Eu(NO3)3·6H2O, Dy(NO3)3·6H2O, Yb(NO3)3·6H2O and
Fe(NO3)3·9H2O, in an aqueous solution of nitric acid at different
concentrations ([HNO3] = 0.03, 0.3 and 3 M), so that each of
their respective concentrations in the aqueous phase was 10
mmol.L-1. The initial concentration of the different salts in the
aqueous phase was verified both by X-ray Fluorescence (XRF)
and Inductively Coupled Plasma Atomic Emission
Spectrophotometry (ICP-OES) analysis.
Microfluidic system
We used the set-up as illustrated in Figure 1 and previously
described in details, as well as validated, elsewhere.31, 32
Typically, the oil and aqueous channels, are micromachined in Figure 1: A) photo of the experimental bench with (from top to bottom): syringe pump modified to accommodate two syringes; aqueous (blue liquid) and organic (yellow liquid) syringes; microfluidic extraction ship; aqueous and organic output sample septum vial; valve; artificial food colouring in water is used to enable better visualisation. B) Schematic representation of the microfluidic set-up with injection and extraction cell.
Physical
Chemistry
Chemical
Physics
Accepted
Manuscript
Open Access Article. Published on 05 February 2020. Downloaded on 2/12/2020 1:42:18 PM.
This article is licensed under a
Creative Commons Attribution-NonCommercial 3.0 Unported Licence.
View Article Online
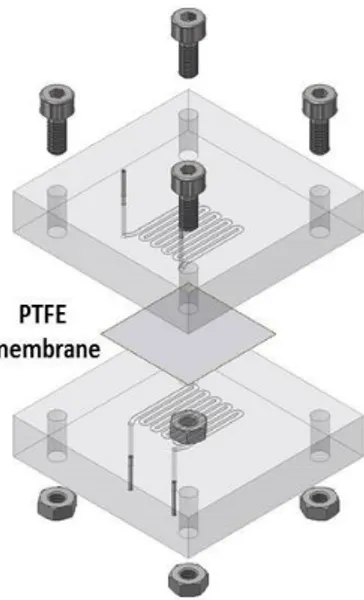
Poly(methyl methacrylate) (PMMA) blocks, which are chemically compatible with nitric acid and Isane® IP175, that were separated by a hydrophobic and porous PTFE membrane with a thickness of 30 µm, pore size of 20 nm and porosity of 55% (Commercially available from Cobetter filtration, China). It acts as capillary separation between the microfluidic channels. The thickness of this membrane was previously optimised to 30 m so as: (i) be easy to handle; (ii) not become the limiting
factor in the mass transfer kinetics.32 Connectors between the
microfluidic ship and PTFE tubing were made of stainless-steel tubing sealed with epoxy resin (Figure 2).
Our validated microfluidic liquid-liquid extraction procedure
can be summarized as follow:31, 32 the first step of any of our
microfluidic extractions consisted in loading the aqueous and oil phases – classically an extractant at predetermined composition and a “diluent” – into gas-tight 5 mL glass syringes equipped with PTFE plunger (Hamilton Bonaduz, syringe 1005TLL). Then, both syringes were placed on a syringe pump (NE1000, New Era Pump Systems, modified to enable simultaneous usage of two syringes) to deliver desired flow rates and injection volumes. Both syringes were connected to the microfluidic device with PTFE tubing of internal diameter 0.65 mm and known overall length. The aqueous sample was introduced first, manually, into the aqueous channel in order to avoid for the organic phase to pass through the membrane. Indeed, this may occur whenever oil phase is introduced first while the aqueous channel is either left empty or if it is under pressurized. Hence, a slight back-pressure of 200 mbar must be applied to the aqueous channel, thus maintaining the oil-water interface within the membrane. This back-pressure was applied by connecting the output
sample septum vial to a pressure regulated nitrogen (N2)
reservoir (Figure 1). Then the organic phase was injected into the organic channel. When both microfluidic channels were filled, both syringes were perfused simultaneously and at equal flow rates by computer-controlled automation. For each data
point, the microfluidic device was (i) fully flushed with twice its internal volume, in order to assure reaching a steady state;(ii) further flushed until 600 μL of each phase was retrieved in collecting output vials, for off-line XRF or ICP-OES analysis (see Supplementary Materials for more details about the XRF analysis). Necessary overall time required to obtain each sample varies according to the flow rate used (always equal, by construction, for both phases (Figure 1) which in our case varies from 34 μL/min to 0.57 μL/min (see Table 2 of Supplementary Materials). For all experimental studies: (i) both aqueous and organic samples were sampled out for five different contact times between the two phases, ca. after 1, 3, 10, 30, and 60 minutes, respectively. When all flow rates for a given composition have been sampled, the device of Figure 2 was disassembled, cleaned and its membrane replaced to proceed to another composition within the phase diagram. All
microfluidic extractions were performed within a large (1 m3)
thermostated chamber (Memmert, IPP 750 Plus), regulated at the set experimental temperature ± 0.1°C.
It should be noted that the collection of 600 μL from the microfluidic platform was the main data point acquisition time’s limiting factor. Such a large volume was indeed required to perform off-line characterizations. In future implementations, this data point experimental time should be reduced to whichever is the limiting factor: (i) the time required to acquire an on-line XRF spectra, once XRF is integrated to the platform; or (ii) the time to reach a steady state when using very slow flow rates. This will be the case in the next generation of our platform. Other groups have already integrated an online ICP-MS, but with the issue that it only measures the aqueous channel which further often requires a dilution before
performing the measurement.37
It should be noted that a blank experiment, in which only pure oil –ca. without extracting molecules- was performed and showed that no metals was extracted from the aqueous phase. Such loss of metal can sometime be observed due to their adsorption onto channels’ surfaces. This is usually avoided as long as the thickness of the microfluidic channels are more than 0.05 mm. Here, we used channels with rectangular cross-section of 0.4 mm in width and 0.2 mm in depth and with a contact section 171 mm long. Hence we did not need to correct data for absorbed cations in the porous membrane or elsewhere.
It should be noted that in some cases, organic phase samples obtained at the organic channel output decant in both an extractant-poor and an extractant-rich phases. The latter viscous phase is often referred to as a Winsor III instability, which is at the origin of the so-called “Third phase” incident in hydrometallurgy containing a dense and viscous phase, expelling a lighter and fluid organic phase. This phase separation was not observed by naked eye within the organic channel of the device during extraction process. Due to its increased density, it also leads to a reduced volume for the collected organic sample i.e less than 600 μL. After settling, the two organic phases were separated and recovered by decantation to measure their respective ions concentrations by XRF.
Figure 2: 3D sketch of microfluidic extraction circuit card with: PTFE membrane; four tightening bolts for mechanical stability; PMMA block milled with microfluidic serpentine channels; input/output stainless steel tubes. The volume of each channel within the phases contact area is 35.7 μL. Reprinted from ref. 33, Copyright 2019, with permission from Elsevier.
Physical
Chemistry
Chemical
Physics
Accepted
Manuscript
Open Access Article. Published on 05 February 2020. Downloaded on 2/12/2020 1:42:18 PM.
This article is licensed under a
Creative Commons Attribution-NonCommercial 3.0 Unported Licence.
View Article Online
Batch extractions
Batch extractions were performed in parallel to microfluidic extractions to serve as additional comparison and further validation points. These batch samples were prepared using identical compositions for the initial solutions (fifteen aqueous batch samples to be contacted with fifteen organic batch
samples) as previously described in details:33 typically, we used
a 1:1 volume ratio between the aqueous and the organic phases - the volume of each phase being 2.5 mL. Contact time of the two phases within a test tubes was set to 1h, using permanent mechanical shaking, to maintain a good emulsification, at room temperature. In the case of low acidity, extraction kinetic is slower. In order to achieve equilibrium, additional batch extractions were performed for contact times of 120, 180 and 480 min, and associated the recovery factor as calculated. Then, in all cases, the two phases were separated by centrifugation (8000 rpm for 30 minutes) and recovered separately by decantation. Results were compared to microfluidic extraction having a one hour contact time. All experiments were carried out at room temperature (25 ± 1°C) or, when other temperatures were studied, in a temperature controlled closed chamber (Memmert, IPP 750 Plus).
XRF
The commercial XRF spectrometer used to analyse both aqueous and organic phases after extraction is a SPECTRO XEPOS (AMETEK) model. It is commercially equipped with an energy dispersive X-ray analyser (ED-XRF) that used the energy loss of the X photon in a silicon material to determine the spectrum by a suitable signal processing. Secondary targets reduce background noise compared to the output signal from the tube and improve fluorescence detection. Liquid samples were placed in 6 mm diameter cups, the bases of which consisted of a 4 μm thick prolene film. The XRF spectrometer was used to analyse a series of eleven cups in sequence, using a rotating carousel that positions the sample to be measured above the inverted optical part. A volume of 100 μL for each of the samples was placed in the micro-cups of analysis for a duration of 40 minutes. The X-ray tube generator was set at 40 kV and an intensity of 0.160 mA. The Zirconium secondary target was monitored between 15 and 17 keV to visualize the fluorescence of all lanthanides and iron: between 4 keV and 10 keV.
ICP-OES
Rare earths extraction was also analysed by ICP-OES: aqueous solution ion concentrations were measured before and after extraction. The commercial tool used for this study is a SPECTRO ARCOS ICP-OES, which is equipped with a circular detector consisting of 32 linearly aligned CCDs, each having a resolution of 3648 pixels covering wavelengths ranging from 130 to 770 nm. The resolution of the detector is 8.5 pm from 130 – 340 nm and 15 pm from 340 – 770 nm with an intensity dynamic range of eight orders of magnitudes. CCDs were read out simultaneously and a complete spectrum was generated under two seconds. The circular polychromator (Paschen-Runge
design, optical components: MgF2, Zerodur structure) has a
focal distance of 750 mm. The radio frequency generator works at a frequency of 27.12 MHz and has a power output of 0.7 to 1.7 kW with an efficiency of 70 % and a stability of 0.1 %. A typical sample analysis was carried out as follows: The sample was diluted to an appropriate concentration ranging between 5
to 15 mg/L using 2% HNO3 in water. Before each run a
calibration was performed with metal standards made from a calibrated solution (1000 mg/L) which was diluted to obtain standards at 0, 1, 5 and 15 mg/L. Each sample was measured three times for statistical reasons and after each measurement,
the system was purged with 2% HNO3.
Results & Discussion
Currently, there are seventeen identified categories in the strategy for formulating efficient complex fluids for liquid-liquid
extraction.15, 34, 38 The vast majority of these efficient
formulations combine a solvating extractant and an ionic exchanger extractant that can modify the overall reaction mechanism and lead to either a synergic or an antagonist
effect.34, 39-42 Synergy -for which no predictive theory exists yet
- is strongly affected by various parameters such as aqueous
Figure 3: Location of the relative chemical potentials of the electrolyte during liquid-liquid extraction: reference chemical potentials µ0 are indicated explicitly. The water
rich phase is represented in blue and the oil phase in orange, while the interface, or rather the interphase, is schematized by a thick green undulating line. Extraction of ions into the organic phase is made possible by its incorporation within the core of an aggregate made of extractant molecules. Polar heads of extractant molecules are oriented toward the core of the aggregate.
Physical
Chemistry
Chemical
Physics
Accepted
Manuscript
Open Access Article. Published on 05 February 2020. Downloaded on 2/12/2020 1:42:18 PM.
This article is licensed under a
Creative Commons Attribution-NonCommercial 3.0 Unported Licence.
View Article Online
phase acidity, amount of extractants as well as temperature.40
Most of these effective processes rely on combining two extractants and an optimized “diluent” with so-called
modifiers.10, 11, 43-46 To optimize a process, both “yield”,
expressed in mass extracted by unit of time, and “selectivity” in differentiating “target” from “non-target” elements are
considered.47 In the absence of general predictive theory for the
selectivity of multi-component complex fluids,33, 40, 48
optimization requires very lengthy experimental plans. Anyhow, selectivity can be understood by comparing the “double differences” of free energies of transfer between the
water and the oil phases (∆∆𝐺𝑅0 ) for the two elements
considered.16 The methodology is illustrated in Figure 3, it gives
an overview on how an extraction process can be coupled with thermodynamic driving forces. On the left side, the Gibbs free energy of transfer between the water and oil phase is calculated using the ienaics approach: from the difference between the reference chemical potentials of each phase (Equation 2) -since the reference chemical potential reflects the intrinsic affinity of the solute towards the aqueous or oil phase -. In Figure 3, the reference chemical potential of a solute in the initial aqueous
phase 𝜇𝐴𝑞𝑖𝑛𝑖𝑡𝑖𝑎𝑙 (blue bar) is higher than the reference chemical
potential in the final organic phase after contact 𝜇𝑂𝑟𝑔𝑓𝑖𝑛𝑎𝑙 (grey
bar). Thus, it is transferred into the organic phase, as it is
thermodynamically favourable (see reference 16 for further
details on the ienaics approach). At the input of the microfluidic device, ions have an initial state which is represented by an
initial chemical potential in each phase i.e 𝜇𝐴𝑞𝑖𝑛𝑖𝑡𝑖𝑎𝑙 and 𝜇𝑂𝑟𝑔𝑖𝑛𝑖𝑡𝑖𝑎𝑙,
during the transfer, the ion will reach thermodynamic equilibrium and will have the same chemical potential in both phases at the output of the liquid-liquid extraction microfluidic zone (Equation 1).
The chemical potential can then be split into the reference chemical potential in the designated phase and a second term related to the activity. Such rearrangement of Equation 1 leads
to an expression of the free energy of transfer, ∆𝐺𝑅0 (Equation
2), in which, assuming ideal behaviour (i.e. no interactions of the solute molecules between each other), the activity can be reduced to the solute’s concentration. Thus, the free energy of transfer can be expressed using only the ratio of the considered ion’s concentration in each individual phase (Equation 3 to Equation 5).
𝜇𝐴𝑞𝑓𝑖𝑛𝑎𝑙= 𝜇𝑂𝑟𝑔𝑓𝑖𝑛𝑎𝑙 Equation 1
This explains the final aim of this microfluidic investigation: to explore the phase diagram of a synergic extraction system in regards to its ions free energies of transfer from the water to the oil phase, and thus as fast as the kinetics of the extraction allows (typically from few minutes to few hours in worse cases). Also, since our microfluidic chip allows to precisely control solution’s contact times, it therefore also enables studying transient states and establishing extraction’s time dependence. Studying such transient behaviours, at constant total molarity of extractant, allows identifying asymptotic values, therefore
characterizing the thermodynamic equilibrium and thus for various acid concentration, temperature and molar fractions. It therefore allows determining the Gibbs free energy of transfer.
∆𝐺𝑅0 (𝐽⁄𝑚𝑜𝑙𝑒) = 𝜇0,𝐴𝑞− 𝜇0,𝑂𝑟𝑔 Equation 2
∆𝐺𝑅0 (𝐽⁄𝑚𝑜𝑙𝑒) = −𝑅𝑇 𝑙𝑛 (
[𝑅𝐸𝐸]𝑜𝑟𝑔𝑒𝑞
[𝑅𝐸𝐸]𝑎𝑞𝑒𝑞 ) Equation 3
For the sake of clarity, it should be noted that the reaction Gibbs
energy of transfer ∆𝐺𝑅0 standard state is defined for a solvent
containing all the species but the rare earth nitrate salt. It is therefore the free energy per mole of transferred species and not the raw difference of a given sample versus a reference
state, as classically noted µ0 or ΔG0 in thermochemistry. There
is no assumption considering a dominant supramolecular extraction equilibrium that would take into account all other species present in the solution. The ratio of extracted to remaining species defines the reference free energy linked to the advancement of the reaction. Here, all other species than the one considered are considered part of the solvent and participate in defining the reference state, as explained previously.
One particular interest of this work, is that we performed chemical analysis of both fluids coming out of liquid-liquid extraction device, in order to improve the measurement of the free energy of transfer (See supplementary information 1.4).
Indeed, when [REE]org is well below the standard error of the
measurement of [REE]aq, measuring only [REE]aq can lead to
significant measurement errors on [REE]org, and hence of both
[REE]org/[REE]aq ratio and Gibbs free energies of transfer (see
supplementary information 1.4) Ion concentrations are measured by X-ray fluorescence.
The latter approach differs from most reports available in the literature, that focus on mass balances for which some lack of precision in the measurement of the aqueous residual concentrations of ions left after extraction is acceptable (since efficiency > 90%). In such case, the « remaining » species in the aqueous phase are highly diluted and hence difficult to accurately measure to enable a precise calculation of the ion concentration in the organic phase. To precisely quantify ion concentration of the organic phase, another chemical preparation, such as back extraction, is usually performed prior
Physical
Chemistry
Chemical
Physics
Accepted
Manuscript
Open Access Article. Published on 05 February 2020. Downloaded on 2/12/2020 1:42:18 PM.
This article is licensed under a
Creative Commons Attribution-NonCommercial 3.0 Unported Licence.
View Article Online
to capillary chromatography in aqueous medium and quantification via inductively coupled plasma (ICP).
To avoid this and enable accurate measurement of the ratio between extracted and non-extracted ions, an absolute method working for both phases is then needed, such as X-ray
fluorescence (XRF).49 See supplementary information 1.4 for
more details on how the calculation of the free energies of transfer from the concentrations of the two phases allows to reduce the errors of measurements by comparing the method used in this study to the classical one i.e measuring aqueous concentrations only.
In this study, the synergic extraction system investigated is composed of the solvating extractant DMDOHEMA and the cation exchanger HDEHP (Figure 4). We selected these as they form a well-studied synergic system based on DMDOHEMA, the latter being known to be efficient to extract lanthanides with
high actinides/lanthanides selectivity. More generally
DMDOHEMA is a good example of diamine extractants which are known to show high actinides/lanthanide selectivity, a crucial property required when long-lived and short-lived radioactive species coexist in large quantities, such as in closed nuclear cycle that is associated to any fourth generation nuclear plant. Furthermore the viscosity of solutions containing typically 30% of DMDOHEMA in a solvent is acceptable for
process design.50, 51 Moreover, modern predictive approaches
exist: (i) to calculate the viscosities observed when solutions are
loaded with uranium is available;52, 53 to derive the critical
micellar concentration (cmc) of extractants in different solvents, not only alkanes and solvo-surfactants, but also ionic
liquids (such as COSMO-RS).54
Overall, our study allows determining the influence of (i) the
molar fraction, XDMDOHEMA, of the solvating extractant (Equation
4); (ii) the acidity and; (iii) the temperature, on the kinetics, efficiencies and selectivities of the extraction.
𝑥𝐷𝑀𝐷𝑂𝐻𝐸𝑀𝐴=
[𝐷𝑀𝐷𝑂𝐻𝐸𝑀𝐴]
[𝐷𝑀𝐷𝑂𝐻𝐸𝑀𝐴] + [𝐻𝐷𝐸𝐻𝑃] Equation 4
In this article, the efficiency is defined as a distribution ratio
expressed in standard free energy difference:55
∆𝐺𝑅0 (𝐽⁄𝑚𝑜𝑙𝑒) = −𝑅𝑇 𝑙𝑛(𝐾𝐷) Equation 5 Where: 𝐾𝐷= [𝑅𝐸𝐸]𝑜𝑟𝑔 [𝑅𝐸𝐸]𝑎𝑞 Equation 6
KD is the concentration distribution ratio calculated from ionic
concentrations in both the organic and aqueous phases after
the extraction process.16
Note that iron is ten times more concentrated than the rare earths, in order to be representative of typical conditions for
recycling of wind-mill magnets.56 It is an active field of research
due to the very large amount of expensive rare earth (neodymium and dysprosium, for example) that can be recycled
from them.57, 58 However, due to (i) overlap of X-ray
fluorescence peaks and; (ii) the very low extraction of iron: extracted iron concentrations were too small to be measured either by ICP or XRF. Therefore, we made no tentative of calculating selectivity of the five lanthanides versus iron.
Figure 4: Skeletal formulas of HDEHP and DMDOHEMA.
Figure 5: Extraction percentage versus time obtained in microfluidics, with [HNO3] =
0.03 M, T = 25°C, for different lanthanides (La3+, Nd3+, Eu3+, Dy3+, Yb3+) and molar
fractions, xDMDOHEMA = 0 (a), 0.25 (b), 0.5(c), 0.75 (d), 1(e). (f) Extraction percentages
obtained using batch method (1h). Comparing contents of same colour rectangles in graphs (a-e) with the ones in (f) allow visual assessment of reproducibility of microfluidic extraction versus batch extraction measurements (for quantitative data comparisons see Table 1).
Physical
Chemistry
Chemical
Physics
Accepted
Manuscript
Open Access Article. Published on 05 February 2020. Downloaded on 2/12/2020 1:42:18 PM.
This article is licensed under a
Creative Commons Attribution-NonCommercial 3.0 Unported Licence.
View Article Online
Comparison of Microfluidic versus Macroscopic Liquid-Liquid Extraction approaches
Various microfluidic approaches to do liquid-liquid extraction have already been proposed, each with advantages and
disadvantages, which have already been critically reviewed.25, 26
To summarize, the main advantages of microfluidic over the batch approach is that most microfluidic platforms enable: (i) a good control and possible variation of the contact time between the two phases (by control of the flow); (ii) a known effective surface of contact. Hence, they enable the quantification of extraction kinetics, otherwise fairly difficult to quantify. More specifically, advantages of the microfluidic platform used in this article are: (i) a large range of contact time can be investigated (which is not the case when the two phases are directly
contacted in a co-flow microchannel);27, 59, 60 (ii) the assembly of
the cell and technology required are simple and do not need complex handling / building procedures or expansive process controls such as what is required when using alternating phase
droplets.22 Hence, it should be noted that our simple design and
assembly method, using only four screws to hold in place and squeeze the membrane, proved to be very efficient and therefore economical as it enabled us to perform all seventy-five microfluidic extraction experiments, including fifteen membrane exchanges, without any disabling leaking issue. This saves considerable amount of time and effort when compared to non-reversible method of assembly such as gluing or thermal bonding. Importantly, we recently reported that the use of a thin membrane to separate the two phases, such as the one used here, is not a limiting factor, hence it does not modify
extraction kinetics.32
To compare our microfluidic extraction results with standard approaches, we measured extraction efficiencies for various molar fractions of microfluidic extraction experiments and systematically reproduced these using the macroscopic standard so-called “batch method” in flasks.
From ICP-OES or XRF ion concentration measurements of samples obtained from both organic and aqueous phases using our microfluidic procedure, one can calculate an extraction percentage for each measured data point. The extraction percentage , %E (Equation 7), also called recovery factor, is defined, for any given ion, as the ratio of its concentrations, at
equilibrium, in the organic phase [𝑹𝑬𝑬]𝒐𝒓𝒈𝑶𝒖𝒕over its concentration
in the input aqueous solution [𝑹𝑬𝑬]𝒂𝒒𝑰𝒏:
%𝐸 =[𝑅𝐸𝐸]𝑜𝑟𝑔
𝑂𝑢𝑡
[𝑅𝐸𝐸]𝑎𝑞𝐼𝑛 Equation 7
Examples of extraction percentages for all studied ions, obtained for various contact times and at 0.03 M in nitric acid, are calculated, plotted and presented in Figure 5. Additional
results for other acidities (0.3 and 3 M in HNO3) can be found in
supplementary information 1.3). At such acidic concentrations,
pH values are well below 3 where lanthanides and iron ions are trivalent.
Results comparison between microfluidic and batch methods was made for a contact time of 1h. Microfluidic extraction percentages at extraction time identical to standard batch extractions (1h) are highlighted in coloured boxes in Figure 5 (a-e). They can be compared to values obtained using the standard
Figure 6: Free energies of transfer ΔG (kJ/mole) explored around the Winsor II-Winsor III re-entrant phase limit versus the DMDOHEMA molar fraction for three different HNO3
concentrations: 0.03 (a), 0.3 (b) and 3M (c). T=25°C. In b) one can note the observation of a “third phase” when xDMDOHEMA > 0.5 that is observed in the Winsor III domain of the
phase diagram. The test tube schematic on the right represents the Winsor III equilibrium: a concentrated “third phase”, made of rich extractant structured solution loaded by acid an salts (orange) is formed that coexists at equilibrium with a denser aqueous phase (blue) and a less dense oil rich phase containing diluted extractant monomers, ca. below the CAC (yellow).
Physical
Chemistry
Chemical
Physics
Accepted
Manuscript
Open Access Article. Published on 05 February 2020. Downloaded on 2/12/2020 1:42:18 PM.
This article is licensed under a
Creative Commons Attribution-NonCommercial 3.0 Unported Licence.
View Article Online
batch method and given in Figure 5 (f). Quantitatively, the data set acquired both using our microfluidic device and in batch samples for all cations present in solution coincide within experimental uncertainty of the analysis and the difference between the two methods is never more than 3% (See table 1). For example for Ytterbium, this represents at most 0.5 kT (= 1.2
kJ/mole) in free energy of transfer.22
Table 1: Extraction percentage variation between batch and microfluidics,for different lanthanides (La3+, Nd3+, Eu3+, Dy3+, Yb3+) and x
DMDOHEMA (0, 0.25, 0.5, 0.75, 1), with [HNO3]
= 0.03 M, T = 25°C. xDMDOHEMA La Nd Eu Dy Yb 0.00 0.0109 0.0116 0.0008 0.0000 0.0000 0.25 0.0270 0.2131 0.0002 0.0003 0.0001 0.50 0.0153 0.0016 0.0151 0.0091 0.0036 0.75 0.0002 0.0094 0.0369 0.0025 0.0028 1.00 0.0063 0.0162 0.0111 0.0057 0.0024
Study of the Parameters Influencing the Extracting Properties Effect of acid concentration:
From Figure 6 (a)-(c) (as well as Figures 1 and 2 of supplementary information) one can estimate that extraction equilibria were reached in times ranging from a few minutes to two hours with the fastest kinetics observed at high acid concentration and the slowest at low acidity (Figure 5 and Supplementary information’s Figure 1). This is an additional interest of the microfluidic approach as it directly allows to verify that equilibrium is reached. This is of particular interest when one explore unusual phase diagram domains.
Such influence of the pH on extraction kinetic has previously been explained as being linked to the ion exchange mechanism:
at low pH, the concentration of H+ in extractant aggregates’s
polar cores is high which facilitates cation exchange.20 Although
observed curves can show some irregularities, that are likely to be attributed to measurment artefacts, It should be noted that the difference in kinetics for the considered ions could be exploited to enhance selectivity by using contact time that maximise it (and not wait to reach the equilibrium): for example in the absence of DMDOHEMA, fast extraction allows targetting of heavy rare earths. Such observation cannot be obtained using the standard batch approach in the case of fast kinetics. From these, new process protocols of separation and purification could be derived that would work away for the thermodynamic equilibrium.
Furthermore, in order to go beyond a qualitative analysis and enable a more quantitative analysis of the influence of the nitric acid concentration on lanthanides extraction with the mixed system HDEHP and DMDOHEMA, free energies of transfer of lanthanides are measured at various nitric acid concentrations from 0.03 M to 3 M in Isane diluent. Extractions were carried out using same model aqueous phase and with 0.9 M of total
extractant concentration. Results will be discussed and linked to the behaviour of the extractant molecules as well as the electrolyte composition.
Hence, Figure 6 represents the standard-state Gibbs free
energy of transfer ∆𝐺𝑅0 (Equation (5)) as a function of the molar
fraction of the DMDOHEMA and for three different nitric acid concentrations. For each lanthanide and in the absence of the
solvating extractant DMDOHEMA (xDMDOHEMA = 0), one can
observe that ∆𝐺𝑅0𝑥𝐷𝑀𝐷𝑂𝐻𝐸𝑀𝐴=0values increase significantly when
changing [HNO3] from 0.03 (figure 3 in supplementary
information and Figure 6(a)) to 0.3 M (Figure 6(b)). Less
variations are observed when increasing further [HNO3] (Figure
6 (c)). According to Equation 3, this therefore indicates that
[REE]org / [REE]aq is decreasing when acidity increases, and thus
that the extraction efficiency of lanthanides decreases with the
increased acidity and is maximum at [HNO3] = 0.03 M.
This has previously been explained as coming from the
competition between the transfer of H+ from the solvent to
aqueous phase and the extraction of lanthanides.61 More
generally, it is often observed when using a cationic exchanger
system.62-64
The general evolution of the Gibbs free energy ∆𝐺𝑅0 as a
function of the molar fractions however differs for each of the three acid concentrations studied. We discuss this behaviour in more details hereafter.
[HNO3] = 0.03 M From a thermodynamic point of view, when
the solvating extractant DMDOHEMA molar ratio increases,
Figure 6 (a), a linear response in ∆𝐺𝑅0 is observed with a positive
slope. This is indicative of a reduction of the extraction toward the organic phase and therefore of an antagonistic effect of DMDOHEMA versus HDEHP appears. This effect has been
explained by Ellis et al.:65 trivalent cations are more attracted
towards highly negatively charged interface than complexed by solvation only. Indeed, surface charge density is in the order of
magnitude of about 2 e/nm2 since the area per molecule of
HDEHP is typically 0.5 nm2 as determined by scattering or
surface tension.66, 67
[HNO3] = 0.3 M acidity is now increased tenfold when compared
to previous paragraph, as shown in Figure 6(b), the curve slopes
of ∆𝐺𝑅0 as a function of the molar ratio are negative for all REEs
studied with an average value of -8 instead of 25 in the previous case, except for ytterbium. At such an acid concentration in the aqueous phase and above the DMDOHEMA molar fraction of 0.5, we observed the appearance of a dense, viscous third
phase.68 Hence, the oil phase becomes instable at xDMDOHEMA
> 0.5 which prevents the determination of ∆𝐺𝑅0. Below x = 0.5,
the curves’ slopes in Figure 6(b) are significantly reduced by a
factor of 3 in absolute value, showing that the intrinsic
efficiency of HDEHP is weakened by the large amount of H+
competing with rare earths: thus the antagonistic effect of DMDOHEMA disappears.
The two to three phases transition can be understood as a Winsor II to Winsor III equilibria. Winsor II is the coexistence of two fluid phases: a water-poor microemulsion in an oil-continuous medium coexisting with an aqueous phase in
excess.69 Winsor III is a three phases equilibrium. Winsor-II
Physical
Chemistry
Chemical
Physics
Accepted
Manuscript
Open Access Article. Published on 05 February 2020. Downloaded on 2/12/2020 1:42:18 PM.
This article is licensed under a
Creative Commons Attribution-NonCommercial 3.0 Unported Licence.
View Article Online
equilibrium enables standard liquid-liquid extraction processes while entering the Winsor-III domain is a third-phase accident, stopping plants for very long times since all reservoirs must be cleaned. Transition from Winsor II to Winsor III in a liquid-liquid extraction process is due to attraction and coalescence between molecular aggregates producing the splitting of the organic phase into two phases, an extractant-rich and an extractant-poor one, respectively. The latter dilute organic phase has its extractant concentration below the cmc, so all
aggregates decompose into monomers.70 Most Winsor III
studied in the literature have been obtained using equal volumes of water and solvent, but they also coexist at low water
proportion, even for water volume fractions of less than 10%.71,
72 Comparing figures 7a, b and c, shows that a Winsor III regime
is only observed at intermediate pH, namely [HNO3] = 0.3 M.
Erlinger et al.68 has already studied similar systems and explain
that at low acidity there is not enough extracted species to induce such phase transition by van der Waals forces whereas at high acidity, the coalescence due to interfacial film bending is not strong enough. In classical microemulsions, these are called liquid-liquid phase separation and emulsification failure,
respectively.73, 74
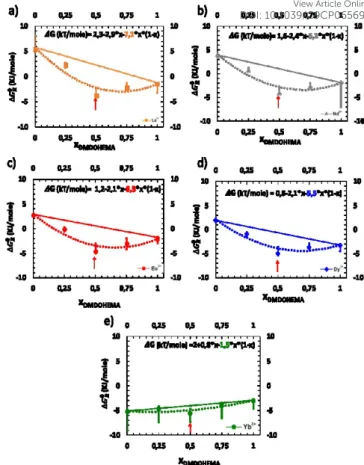
[HNO3] = 3 M: Results obtained are plotted in Figure 6(c) as well
as in an enlarged scale for each ion in Figure 7(a-e). Most curves
of ∆𝐺𝑅0 versus molar fraction exhibits a nonlinear synergic
behaviour, ca. the free energy of transfer measured is lower than the value that would be expected from a linear
interpolation between the ∆𝐺𝑅0 values for each of the two
molecules when present alone in the solution. This interpolation is also represented together with their fitting
curves using a quadratic function Figure 7(a-e).75 It should be
noted that the molar fraction of the mixture for which the synergy is maximum is always measured close to the molar
fraction xDMDOHEMA = 0.5, similarly to previous report by Bley et
al.48
Table 2: experimental entropy coefficients deduced from fits. Ion La3+ Nd3+ Eu3+ Dy3+ Yb3+
Entropy
coefficient (A) 7.1 6.2 6.3 5.5 1.5
As recently detailed by Spadina et al., the free energy of transfer can be expressed as the sum of different terms: (i) complexation term; (ii) bulk term which represents the reduction of accessible volume solutes confinement in cores of aggregates and; (iii)
other electrostatic terms.76 This is also valid in the case of mixed
micelles with two extracting molecules.76 In this latter case,
according to Spadina et al., the sum of the entropic part of these three terms seems to be dominant which enhanced synergy extraction as due to the increase of configurational entropy for extracted ions.
The configurational mixing entropy inside the aggregate formed
by the extractant in first and second coordination spheres77 can
be expressed as follow: 75, 78-80
∆𝑆 = 𝐴. 𝑘. 𝑇. 𝑥(1 − 𝑥) Equation 8
Where the prefactor A depends on the exact number molecules in the first and second molecular spheres around extracted ions. For this reason, it is useful to plot free energies of transfer versus molar fractions as it quickly gives an indication of the number of degrees of freedom involved. Numerical values
corresponding to this factorization (A) are calculated from the
Figure 7: graphical representation of the efficiency of extraction (expressed in step of chemical potential (kJ/mole)) for different lanthanides from a highly concentrated nitric acid solution in Winsor II equilibrium with a solvent phase containing a mixture of DMDOHEMA and HDEHP at constant total extractant concentration of 0.9M. Initial aqueous phase: [Ln(III)] = 10mM, [HNO3] = 3M, T=25°C. The red arrows stand for the molar fraction where synergism reaches its maximum: a) La3+; b) Nd3+; c) Eu3+; d) Dy3+;
e) Yb3+.
Figure 8: Evolution of the free energy of transfer as a function of the temperature for the five lanthanides and for a total extractant concentration of 0.9 M (50% DMDOHEMA) in
Isane.
Physical
Chemistry
Chemical
Physics
Accepted
Manuscript
Open Access Article. Published on 05 February 2020. Downloaded on 2/12/2020 1:42:18 PM.
This article is licensed under a
Creative Commons Attribution-NonCommercial 3.0 Unported Licence.
View Article Online
fits in the Figure 7(a)-(e) and indicated explicitly in the Table 2. Most experimental values for the entropy coefficient A are between five and six.
Such excess in configuration entropy can be associated with the many possible arrangements of the ion in the polar core of the aggregate, which is intrinsically included in molecular dynamics, but neglected in quantum chemistry (second coordination
sphere).76 Hence, since in that case (i) synergy is reported to be
mostly due to configurational entropy and not to a specific unique stoichiometry of defined complexes as used in
parametric model30 and; (ii) we assume that the main
contribution to entropy is due to the extractant present in the aggregate and not to co-extracted nitric acid or water, then we can evaluate the configuration excess mixing entropic according to: 33, 75
∆𝑆(𝐽/𝑚𝑜𝑙𝑒) = RT ln ((𝑁𝑐 + 𝑁𝑠)!
𝑁𝑐! 𝑁𝑠! ) Equation 9
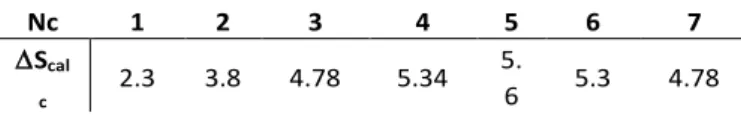
Considering, (i) the expression of the extractants entropy given in Equation 9 and (ii) the hypothesis that aggregates are made of about ten interacting molecules of both solvating extractants
(Ns) and charged surfactants (Nc): Ns+Nc = 10, one can tabulate
the entropy as a function of the number of charged surfactants per aggregate (Table 3). N.B. we assumed that number since,
according to reference 81, most efficient extraction systems
have local water in oil cylindrical microstructure, with both a typical cylinder diameter and length per extracted ion in the order of one nanometre. From this, the number of complexing molecules in first and second coordination position can easily be calculated to be between eight and ten. From Table 3, expected values for the entropy should be between 2 and 5 and
furthermore, one can also observe that it is maximum for Nc=5,
similarly to the experimentally determined synergy which is also maximum for a molar ratio of 0.5.
Since entropy experimental values, listed in Table 2 (ranging between 1.5 and 7 for Ytterbium and Lanthanum, respectively), and the calculated ones are of a similar order of magnitude, this is coherent with the fact that surface excess mixing entropy is
the dominant term responsible of the synergy effect.76 Further
mechanism studies of surface mixing entropy are however yet required to explain the variability of synergy versus ionic radius of the lanthanides.
Table 3: Entropy estimates in the extracting molecules aggregates as a function of the number of charged surfactants, calculated using equation 9.
Nc 1 2 3 4 5 6 7
Scal
c 2.3 3.8 4.78 5.34
5.
6 5.3 4.78
Results presented and fitted in Figure 7 and discussed above
demonstrate also the interest of precise measurement of ∆𝐺𝑅0
as a function of the molar fraction. Indeed, we just showed that it enables the estimation of the extracting aggregates’ composition for which a drastic enhancement of separation
efficiency is observed. Indeed, in the case of Dysprosium (Figure 7d), at a molar fraction of 0.5, one can measure a Synergic Gibbs
free energy variation, written ∆∆𝐺𝑅0, which is the difference
between the experimental Gibbs free energy measured with the one calculated from linear interpolation at x = 0.5, see
Figure 7. In the latter case, ∆∆𝐺𝑅0 is equal to 4. This means that
the extraction efficiency is improved by almost two orders of magnitude (x 50).
Effect of temperature
The Gibbs free energies of transfer for the five lanthanides were determined for three different temperatures ranging from 15°C
to 35°C, with [HNO3] = 3 mol·L-1, DMDOHEMA’s molar fraction
of 0.5 and a total amount of extractants of 0.9 M. Plotted results are presented in Figure 8 and precise values for each data point are given in supplementary information. The increasing of the free energy of transfer with the temperature indicates an exothermic nature of the extraction process (Figure 8). According to the literature, all lanthanide extraction by amides
or mixed extractants are enthalpy driven,48, 82, 83 with yet
unpredictable effects of solvent branching or monomer
isomerisation.84 In classical thermodynamics and when
considering the extraction process as a whole, the standard van’t Hoff derivation used for simple fluids can be used only when (i) all aggregation effects are negligible and (ii) enthalpy itself has no temperature dependence. With these two restrictions, all entropy variations can be calculated from the derivatives of the free energy with respect to the temperature. It should be noted that this van’t Hoff approach is only valid for ideal fluids, it is not numerically correct and no more valid when aggregation or electrostatic effects are more than 2-5 kJ/mole. If we suppose that configurational mixing entropy of the extraction is much larger than other contributions such as complexation entropy, then we can consider as in classical thermodynamics. Considering the linear dependence of the Gibbs free energies of transfer of lanthanides versus
temperature (Equation 10), the plot of ∆𝐺𝑅0 as a function of
temperature leads to a straight line from which: (i) the entropy
of complexation (S0) can be measured directly as its slope and;
(ii) the enthalpy of complexation (H0) is equal to the intercept
values.
G0 = H0 - TS0 Equation 10
where H0 and respectivelyS0 are the enthalpic and entropic)
parts, respectively, of all coexistingextraction mechanisms.
Negative values measured for H indicate the exothermic nature of the extraction process. Furthermore, one can observe
that all slopes are positive (measured S0 are given in Table 4).
Since strong slopes are indicative of strong entropic contributions to the extraction process (Figure 8, Table 4), this is coherent with extraction efficiencies maximum at the lowest temperature values accessible experimentally.
Table 4:values of measured S0
ION La3+ Nd3+ Eu3+ Dy3+ Yb3+ S0 measured (J/mol) -302 -274 -271 -254 -237
Physical
Chemistry
Chemical
Physics
Accepted
Manuscript
Open Access Article. Published on 05 February 2020. Downloaded on 2/12/2020 1:42:18 PM.
This article is licensed under a
Creative Commons Attribution-NonCommercial 3.0 Unported Licence.
View Article Online
As said before, one must however be careful when using this
approach85 as it only applies when the solvent’s structuration is
independent of the temperature. Nevertheless, it allowed us to
determine quantitatively averaged thermodynamic
parameters. All measured averaged thermodynamic
parameters ΔS0 and ΔH0 for extraction are given in
supplementary information and plotted in Figure 9 versus various characteristics of the considered REEs.
From these measured values and for all lanthanides tested here, it has been found that REE extractions are mainly driven by strong enthalpies of complexation, although they are also
associated to negative entropy terms, which favours the initial
state in water. A higher exothermic enthalpy value (-ΔH0) for
lanthanum suggests its stronger binding with the mixed system compared to dysprosium for example. The negative entropy
change (ΔS0) may be associated with a loss of translation and
rotation entropy of the mixed extractant system during complexation in the volume of the extracted species.
The Yb (III) -DMDOHEMA / HDEHP complex seems to be more favourable than the La (III) DMDOHEMA / HDEHP one, since
-ΔG0 for ytterbium is larger than that for lanthanum.
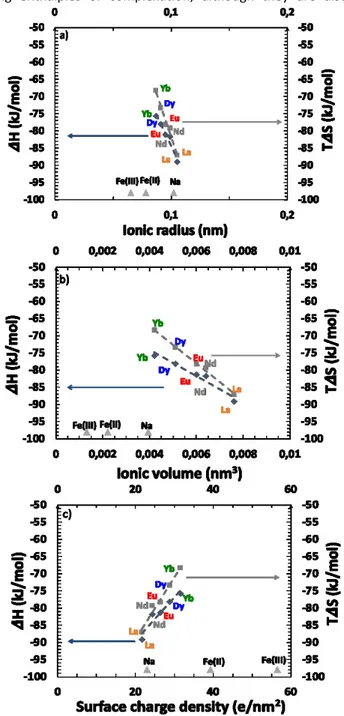
If we compare behaviours within the lanthanides family, three quantities are typically discussed regarding the origin of
selectivity:86 ionic radius (Figure 9a), ionic volume (Figure 9b)
and surface charge density (Figure 9c). All plots are linear for enthalpy as well as entropy so the dominant mechanism cannot be directly determined from these plots. The effect of surface charge density shown in Figure 9c, leads to larger extraction of lanthanides versus iron. Since the charge effect seems to be little, this indicates that non-electrostatic complexation is dominant but it is not the only important effect, since
complexation also follows Pearsons HSAB principle.87-90
In any case, one of the core property of the ieanics approach is that the speciation of the different complexes in the water phase is not needed in order to interpret the free energy of transfer of the solute. Moreover, the ieanics approach does not suppose any “dominant” reaction: it considers the energy of the transfer in the presence of a large number of polydisperse W/O aggregates coexisting. There are therefore hundreds of competing equilibria between weak aggregates and there is no reason to presuppose the existence of a single stoichiometric “reaction mechanism” similarly to monodisperse “complexes”
that are sometimes co-crystallize with water and salts.32, 61, 68
Additional findings
The microfluidic set-up was designed for the study of phase diagrams in the Winsor II regime allowing efficient extraction and stripping. Surprisingly, our result indicates that the Winsor III16, 68, 91, 92 regime could also be obtained, although in the
collecting tube of the solvent phase. This liquid-liquid instability of the solvent phase occurs therefore spontaneously and without the need of mixing and emulsification. The top phase is nearly pure solvent and contains only extractant monomers. The latter coexists with the third phase. Even without gentle centrifugation, it was possible to take a sample for analysis with a syringe. Due to the unique dynamic range of XRF, as well as the absence of further preparation, the dosage of both the diluted and the concentrated optically birefringent mesophase of condensed aggregate could be performed. It should be noted that the phase separation was not visible by naked eye in the
Figure 9: Entropy-Enthalpy compensation for the different lanthanides tested expressed versus three physical quantities: (a) radius as used in structural studies, (b) volume that is important for all depletion effect and (c) surface charge density as used to evaluate electrostatic contribution.
Physical
Chemistry
Chemical
Physics
Accepted
Manuscript
Open Access Article. Published on 05 February 2020. Downloaded on 2/12/2020 1:42:18 PM.
This article is licensed under a
Creative Commons Attribution-NonCommercial 3.0 Unported Licence.
View Article Online
channels of the microfluidic device. Its occurrence was also cross-checked with the batch method where, after extraction, the extractant-rich and extractant-poor phases could be collected separately and our XRF analysis protocol used. Hence, in this regime, the free energy of transfer could even be obtained in the diluted phase, for the first time to our best knowledge.
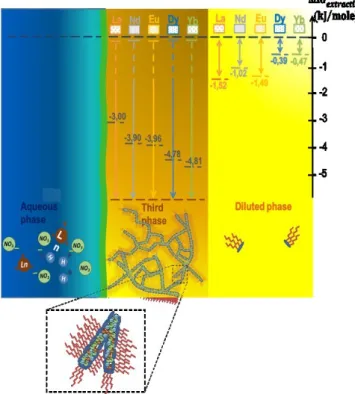
Figure 6b illustrates the case where the acid concentration is equal to 0.3 M but for molar fractions of DMDOHEMA strictly greater than 0.5 and where a concentrated “third phase” is formed which coexists with a diluted organic solution as Winsor
III equilibria.14, 68, 93 Figure 10 present observed free energies of
transfer for the diluted phase (light yellow), that are ranging between ~─0.5 to ─1.5 kJ/mole. Regarding the third phase
(orange), made from interconnected polar cylinders,81 Gibbs
free energy are too strong to be measured with ions concentrations in the organic phase that are too low (hence free energies of transfer values diverge, which we represented with arrows pointing down going all the way).
We assembled graphically the main findings of this work in a schematic form in Figure 10, including free energies of transfer of the Winsor III diluted phase. Ions exchanges occur between aqueous (in blue) and solvent-rich phases (orange and light yellow). Kinetic barrier and asymmetry in the transfer rate are
due to the thin interfacial domain, also called interphase,23 that
is schematized as a green line.94,95 Again, in the diluted phase,
complexation versus entropy balance results in low but
measurable energy of transfer.78, 79 Moreover, as previously
reported,34 the domain where extraction is most efficient and
optimum for liquid-liquid formulation in industrial plant feed is close to the third phase appearance point.
Conclusions
In this report, after presenting a simple although versatile microfluidic assembly enabling the study of liquid-liquid extraction, we then report its use for the study of a synergetic extracting system hereby enabling:
(i) the acquisition of kinetics data, otherwise difficult to
obtain using standard batch method or other more complex microfluidic systems;
(ii) to study the influence of acid concentration, molar
fraction and temperature, thus giving access to pieces of information on the stoichiometry of the aggregate forming in organic solvent;
(iii) to prove the interest of measuring the concentrations
in both aqueous and organic phases by a constrained fit which increases result’s precision down to 2 kJ/mole (1kT/molecule) (see supporting information 1.4);
(iv) the simultaneous study of multiple chemical elements
solution and therefore of realistic model or real lixiviates;
(v) to greatly reduce the amount of chemicals used for
such a study (only 10.86 g of DMDOHEMA, 7.25 g of HDEHP and 73 mL of Isane/water where used in total here. This could further be reduced by about one order of magnitude with on-line XRF).
Finally, it appears that this device is also adapted in the case when the solvent channels is the locus of a phase separation. Thus this device could also be used for the collection and study of the Winsor III equilibria. Although, if in the classical extraction regime (Winsor II), we have shown in a previous paper that the
chosen membrane is not a limiting factor, 32it has recently been
evidenced that liquid-liquid and liquid-solid interfaces increase the domain of stability of the liquid crystals that constitute the
“third phase”.23 Therefore, results concerning experiments
where a third phase may be present in the pores of the membrane will have to be considered with care and with some uncertainty regarding the exact composition of the final equilibrium state.
Once fully integrated with computer controlled mixing capability and online characterization methods such as hollow
waveguide FTIR,24, 96 and XRF,31 and ultimately small angle X-ray
scattering, we anticipate that phase diagram exploration can be fully automatized, with very little down time. It would furthermore also give access to kinetics information, otherwise difficult to obtain. Ultimately, a two stages system would allow studying simultaneously both extraction and desextraction, as well as the recycling of the organic extractant. Hence such tools should accelerate the study of liquid-liquid extraction processes, a key factor to enable the recycling of highly variable waste streams lixiviates.
Figure 10: Relation between the driving force for extraction observed in three different cases: bold black dashed levels represents best measured extraction efficiencies (see equation. 5) in the Winsor II equilibria situated at the limit of the phase ([HNO3] = 0.3 M, xDMDOHEMA= 0.25); for the third condensed phase made from interconnected polar
cylinders, the chemical potential step is too large to be measured (hence the infinite arrows); in the diluted phase, free energy steps are small but measurable (coloured
dotted lines).
Physical
Chemistry
Chemical
Physics
Accepted
Manuscript
Open Access Article. Published on 05 February 2020. Downloaded on 2/12/2020 1:42:18 PM.
This article is licensed under a
Creative Commons Attribution-NonCommercial 3.0 Unported Licence.
View Article Online


![Table 1: Extraction percentage variation between batch and microfluidics,for different lanthanides (La 3+ , Nd 3+ , Eu 3+ , Dy 3+ , Yb 3+ ) and x DMDOHEMA (0, 0.25, 0.5, 0.75, 1), with [HNO 3 ]](https://thumb-eu.123doks.com/thumbv2/123doknet/13196396.392234/10.892.64.407.303.491/table-extraction-percentage-variation-microfluidics-different-lanthanides-dmdohema.webp)