HAL Id: halshs-03131182
https://halshs.archives-ouvertes.fr/halshs-03131182
Preprint submitted on 4 Feb 2021
HAL is a multi-disciplinary open access archive for the deposit and dissemination of sci-entific research documents, whether they are pub-lished or not. The documents may come from teaching and research institutions in France or abroad, or from public or private research centers.
L’archive ouverte pluridisciplinaire HAL, est destinée au dépôt et à la diffusion de documents scientifiques de niveau recherche, publiés ou non, émanant des établissements d’enseignement et de recherche français ou étrangers, des laboratoires publics ou privés.
A Wealth Tax for South Africa
Aroop Chatterjee, Léo Czajka, Amory Gethin
To cite this version:
Aroop Chatterjee, Léo Czajka, Amory Gethin. A Wealth Tax for South Africa. 2021. �halshs-03131182�
World Inequality Lab – Working Paper N° 2021/02
A Wealth Tax for South Africa
Aroop Chatterjee
Léo Czajka
Amory Gethin
A Wealth Tax for South Africa
∗
Aroop Chatterjee
Léo Czajka
Amory Gethin
January 2021
AbstractThis paper considers the feasibility of implementing a progressive wealth tax to collect additional government revenue to both reinforce fiscal sustainability in the wake of the COVID-19 crisis and reduce persistent extreme inequality in South Africa. Drawing on our new companion paper, we first identify the tax base and discuss the design of potential tax schedules. Testing alternative tax schedules, we estimate how much additional revenue could be collected from a progressive tax on the top 1% richest South Africans. Our results show that under conservative assumptions, a wealth tax could raise between 70 and 160 billion Rands — 1.5% to 3.5% of the South African GDP. We discuss in turn how sensitive our estimates are to assumptions on (1) mismeasurement of wealth and (2) tax avoidance and evasion, based on the most recent tax policy literature. We examine technical issues related to the enforcement of the tax, and how third-party reporting and pre-filled declara-tions could be used to optimize measurement of taxable wealth and minimize evasion and avoidance opportunities. Finally, we explain how this new tax could interact with other capital related taxes already in place in South Africa, and discuss the potential impact on growth.
∗Aroop Chatterjee, Southern Centre for Inequality Studies – University of Witwatersrand ; Léo Czajka,
Université Catholique de Louvain; Amory Gethin, World Inequality Lab – Paris School of Economics.
We are grateful to Facundo Alvaredo, Lucas Chancel, Juliana Londoño-Vélez, Clara Martínez-Toledano, Thomas Piketty, Imraan Valodia, Ingrid Woolard and other anonymous commenters for their useful feedback.
This work is based on the research supported by the National Institute for the Humanities and Social Sci-ences (NIHSS) as part of the Rethinking Economic Policy in the Age of Covid-19 project. We acknowledge that opinions, findings and conclusions or recommendations expressed in this publication generated by the NIHSS-supported grant is that of the authors, and that the NIHSS accepts no liability in this regard. We also acknowledge financial support from the Ford Foundation, the Sloan Foundation, the United Nations Development Programme, the European Research Council (ERC Grant 340831) and the Scientific Research Funds (FNRS - FRESH Grant 33877166)
Contents
1 Motivation 1
2 Our policy proposal 2
2.1 Estimation of the underlying tax base . . . 2
2.2 Design . . . 4
2.3 Key assumptions . . . 7
2.4 Main results: Estimates of Government Revenue . . . 9
2.5 Robustness and Limits of Our Estimates . . . 11
3 Taxing wealth: feasibility and economic consequences 14 3.1 Technical Feasibility . . . 14
3.2 Illiquid Taxpayers . . . 18
3.3 Tax Avoidance and Evasion . . . 18
3.4 Alternative capital-related taxes . . . 21
3.5 Impact on Growth . . . 23
References 25
Online wealth tax simulator : https://wid.world/south-africa-wealth-tax-simulator.
1
Motivation
Both the COVID-19 pandemic lockdown and the relief package will have immediate severe impacts on public debt, reducing expected tax revenues and increasing necessary expenditure. Given the predictions of continued economic depression and retrenchments, it is likely that some variety of relief will need to be either expanded or extended, further burdening the fiscus. The implication of a forced reduction in production and demand could potentially reduce tax revenues by 32.5 percent below its pre-crisis level (Arndt et al. 2020). Public debt is likely to spike to hazardous levels. Even with the rescue financing, South Africa’s capacity to repay debts needs to be supported. In this context, a progressive wealth tax concentrated on those most capable to pay would be a significant policy tool to finance debt reduction while sparing most vulnerable households, thus placing South Africa in a better position for an economic re-bound. It is worth noting that instances of successful wealth taxation are associated with crises, including drastic economic conditions, conflict and natural disasters (Flores-Macías 2014). In the current scenario, discussion of a wealth tax seems appropriate.
Furthermore, we believe the introduction of a wealth tax should also be considered as an ad-ditional policy tool to reduce extreme inequality. The most recent available evidence (see Fig-ure A1) suggests that, despite the end of the apartheid regime and the multiple reforms that followed, wealth inequality has not declined since 1994, and has even increased after the 2008 crisis. Over the last 25 years, South African wealth inequality has remained significantly higher than in France, the United Kingdom, the United States, China, Russia and India. Such levels of concentration should raise serious concern as they may affect the economy along several di-mensions: reinforcing the wealthiest’ ability to influence members of the institutions, eroding social cohesion, strengthening anti-competitive market structures and eventually depriving the poorest individuals of endowments needed to resist shocks and realize their full potential. Too often, wealth taxation has been rejected on the basis that all associated costs - capital flight, administration, or discouragement of effort - would greatly negate the benefits. Yet this claim is often grounded on little statistical evidence, mostly due to the lack of data. This paper brings new insights to this debate by estimating how much revenue could be collected from taxing household wealth in South Africa. Our intention is not to propose a readily implementable “optimal wealth tax" for South Africa, but rather to present estimates on the potential revenue that could be raised from different tax schedules, and so inform discussions that would compare a wealth tax to other tax instruments, fiscal consolidation, public expenditure contraction, and the restructuring of public finances.
To answer this question, we draw on the results of our new work which, for the first time, provides detailed data on the average wealth and share of wealth held by all South African adults (Chatterjee, Czajka, and Gethin 2020). This research combined data on aggregate wealth
from the South African Reserve Bank, exhaustive tax microdata on the universe of income taxpayers available from the Treasury, and household surveys. This was an incredibly complex exercise surrounded with many uncertainties, and our estimates of wealth inequality in South Africa are by no means perfect. Quite the contrary: we have documented extensively how access to matched individual-trust data, dividends tax data, and estate duty data – all of which could theoretically be harmonised and compiled from existing tax returns collected by the South African Revenue Service – would be key to better understand how wealth is concentrated at the top end of the distribution. That being said, debates on wealth taxation should not wait for perfectly accurate and exhaustive measures of the wealth distribution - as they themselves are historical by-products of the introduction of wealth taxes. In the case of income, for instance, predicted tax revenues led to the progressive adoption of a comprehensive personal income tax, whose administration required the systematic collection of information on income, which in turn could be used to more precisely estimate taxable income elasticities and optimal tax rates (seeKemp 2019for the South African case).
Notwithstanding current data limitations, our results suggest that, even under conservative as-sumptions on tax avoidance, a progressive wealth tax concentrated on only 1% of the adult population would still collect substantial revenue.
It is outside the scope of this document to discuss in depth the dynamics of public finance management, including the legitimate concerns of taxpayers regarding corruption and wasteful expenditure. We assume that these concerns would affect all tax policies equally, and believe there exists both political and budgetary transparency mechanisms which could be put in place to mitigate these concerns.
The paper is structured as follows. Part 2 explains the design of the wealth tax we propose, presents the different results and the key assumptions we use for our computation, and discusses the limitations of this exercise. Part 3 discusses the main issues related to the implementation of a wealth tax and its economic consequences.
2
Our policy proposal
2.1 Estimation of the underlying tax base
To compute the revenue from the proposed tax, we first need to adequately measure the distri-bution of the underlying tax base. While a lot of studies document the distridistri-bution of income in South Africa (e.g. (Leibbrandt, Woolard, and Woolard 2009)), the distribution of wealth has received relatively little attention. In a recent paper, we estimated, for the first time, a complete wealth distribution for South Africa, following international definitions of household wealth
and accounting for all forms of assets and debts held by individuals (Chatterjee et al. 2020).1 The concept of wealth we use corresponds to the official, international definition of households’ balance sheets as detailed in the United Nations’ System of National Accounts (SNA) (United Nations 2009). The SNA definition of assets includes cash, bank deposits, pensions, life insur-ance, real estate property, bonds and stocks. Debts include mortgages and other loans such as retail store credit accounts or loans from friends, family and money lenders.
For this exercise we relied on three main sources. The first source is the South African Re-serve Bank’s series of aggregate wealth and its composition in South Africa, which we used to derive an estimate of average household wealth and its portfolio composition. The second source are household surveys, which we used to estimate the distribution of real estate assets (homes and rented houses, also referred to as "owner-occupied housing" and "tenant-occupied housing"), of business assets, of cash and currency, and of mortgage and non-mortgage debts. The third source is the tax microdata file available from the South African Revenue Service, which covers the wages, business incomes, and capital incomes received by all South African income taxpayers since 2011. We used this exhaustive microfile to approximate the distri-bution of financial assets (pension assets, interest deposits, bonds, and stock) based on how wages, pension contributions, pension incomes, and capital incomes are distributed across the population.
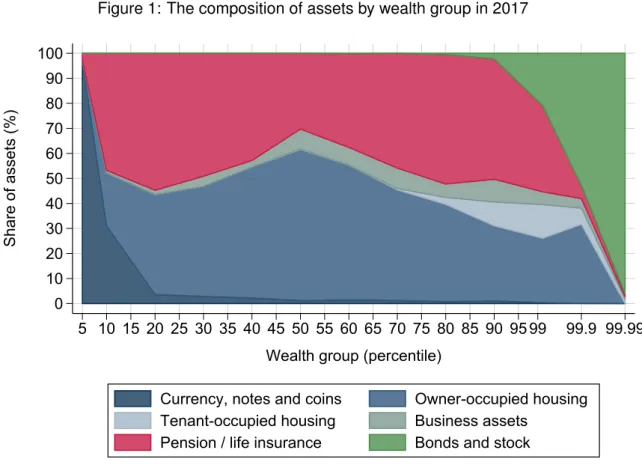
The core results of this exercise are displayed in table 1 and figure 1, which provide information on wealth inequality, wealth composition and average net wealth in South Africa in 2017. Together with the parameters described in section 2.2, all input figures required to simulate the different wealth taxes are displayed in table 1 and figure 1. The most important results to keep in mind for the present simulation exercise are the following:
• The bottom 90% owns only 14% of total personal wealth. On average, more than half of them are in debt, while the rest own only R52,300. Arguably, they should not be taxed. • Wealth is mostly concentrated at the very top: the richest 1% of the South African adult
population (350,000 individuals) own 55% of aggregate personal wealth. They have an average wealth which is 340 times that of the bottom 90%.
• The richest 10% own 99.8% of bonds and stock, 60% of housing wealth and 64% of pension assets (which respectively represent 35%, 29%, and 33% of total wealth). Rented houses are comparatively more important in the portfolios of the upper-middle wealth
1One study (Orthofer 2016) had attempted to estimate the distribution of wealth in South Africa before, but it had
focused on the distribution of capital incomes, rather than on the broader concept of wealth that we study in this paper.
Table 1: The distribution of personal wealth in South Africa in 2017 Number of adults Wealth threshold Average (2018 R) Total (2018 Rb) Wealth Share % of GDP Full population 35,600,000 R 326,000 R 11,600 100% 249.2% Bottom 90% (p0p90) 32,040,000 R 52,300 R 1,700 14.4% 36.0% Bottom 50% (p0p50) 17,800,000 R -16,000 R -300 -2.5% -6.1% Middle 40% (p50p90) 14,240,000 R 27,700 R 138,000 R 2,000 16.9% 42.1% Top 10% (p90p100) 3,560,000 R 496,000 R 2,790,000 R 9,900 85.6% 213.2% Top 1% (p99p100) 356,000 R 3,820,000 R 17,830,000 R 6,300 54.7% 136.4% Top 0.1% (p99.9p100) 35,600 R 30,350,000 R 96,970,000 R 3,500 29.8% 74.2% Top 0.01% (p99.99p100) 3,560 R 146,890,000 R 486,200,000 R 1,700 14.9% 37.2% Notes: The table shows the distribution of household wealth in South Africa in 2017. The unit of observation is the individual adult aged 20 or above. Wealth thresholds are expressed in 2018 Rands. Interpretation: in 2017, the minimum net wealth required to belong to the top 1% (356,000 individuals) was about R 3.8 million. The top 1% average wealth was R 17.8 million; the top 1% owned about 55% of total wealth in South Africa. Source: Chatterjee, Czajka and Gethin (2020).
groups (between percentiles p90 and p99). The assets of the top 0.1% mostly constitute of bonds and stock.
• These levels of concentration are significantly greater than in any other country where a similar exercise could be undertaken (e.g. France, the US, the UK, Russia, China, or India). Wealth inequality in South Africa has not decreased since 1993 (see appendix figure A1).
These estimates should not be considered perfect or definitive. They are characterised, as we already mentioned, by a significant degree of uncertainty, which we discuss in more detail in section 2.5 (for a complete review on the limitations and robustness of our estimates, please re-fer toChatterjee et al. 2020). That being said, we are confident that our figures give a good sense of the magnitudes, and that they can be useful to inform the debate on wealth taxation.
2.2 Design
Modality The design of a wealth tax could take various forms. Ultimately, the final design should be instructed based on informed collective decision. In this section, we briefly discuss modalities based on different structural parameters: recurrence, exclusions, rates and thresh-olds.
RecurrenceA wealth tax could be recurring, as in the standard discussions of an annual wealth tax. Alternatively, it could be imposed as a non-recurring wealth tax, often referred to as a capital levy. As a wealth tax interacts with expected behavioral responses, the time span is obviously a key policy parameter. A one-off tax could allow comparatively high marginal tax rates as behavioral responses should be less pronounced in non-repeated settings. Such taxes have been historically used to redress debt problems created by extraordinary circumstances. Conversely, a recurring wealth tax would require typically low marginal tax rates, but would
Figure 1: The composition of assets by wealth group in 2017 0 10 20 30 40 50 60 70 80 90 100 Share of assets (%) 5 10 15 20 25 30 35 40 45 50 55 60 65 70 75 80 85 90 95 99 99.9 99.99
Wealth group (percentile)
Currency, notes and coins Owner-occupied housing
Tenant-occupied housing Business assets
Pension / life insurance Bonds and stock
Notes: The figure shows the composition of assets of various groups in the distribution of household assets in South Africa in 2017. The unit of observation is the adult aged 20 or above. Source: Chatterjee, Czajka & Gethin (2020).
probably be a more efficient way to limit/decrease wealth concentration over the long term. Note that marginal tax rates could also vary along the period: higher in the beginning and progressively lower afterwards for instance. We further discuss policies which could be imple-mented to mitigate behavioral responses in section 3.3.
Exclusions To avoid design loopholes, a wealth tax should cover all forms of assets. Taxing only specific assets could lead to important economic distortions. Exempting housing, for instance, would create strong incentives for individual investors to sell their financial assets and invest massively on the real estate market, which could have negative consequences at the macroeconomic level. Our wealth tax proposal therefore covers all types of assets, including housing, wealth held through pension funds, and government bonds. Furthermore, our wealth tax proposal is a tax on net worth, that is the net value of individuals’ assets holdings after deducting outstanding debts. Deducting debts from the tax base is crucial both for efficiency and equity. Our estimates below account for this deduction.
That being said, short-term implementation restrictions could make the case for a narrower def-inition of wealth in the early phase of the introduction of the tax. Typically, most information on financial assets are generally easier to collect, as banks and financial intermediaries already
collect theses elements through their operational routine, making it easier for SARS to admin-ister the tax. In the case of South Africa, this for instance could imply temporarily excluding assets such as property, whose valuable could prove particularly challenging in the short run. However, we stress again that this could lead to significant distortions, as taxpayers become incentivised to avoid tax by changing the composition of their taxable asset base. This is one of the key reasons for the failure of many wealth taxes.
Rates and thresholdsVarious marginal rates and thresholds could be chosen.2 One might prefer for instance to increase the exemption threshold so as to spare more people, cut some of the administrative costs and put to contribution only the wealthiest. In our example below, we explore "low", "moderate" and "high" tax rates. Compared to historical and contemporary examples of annual taxes on wealth, both "moderate" and "high" tax schedules may seem high.
Londoño-Vélez and Ávila Mahecha(2018) find that the revenue maximizing rate of a wealth tax in Colombia, after accounting for short-term behavioral responses, is 11.9% - even our highest marginal tax rates are below this. Therefore available evidence in comparable settings suggests that, for a short period of time at least, marginal tax rates could still be relatively high. In the next section we provide yearly estimates for three tax schedules.
Targeting only the taxpayers most able to pay A wealth tax should have a sufficiently high exemption threshold to avoid the problem of the "illiquid" taxpayer. Homeowners with little cash, savings or financial assets would not be able to pay the tax, so taxing them would be inefficient, inequitable, and could have negative economic and social consequences. We believe that the tax should therefore cover the top 1% of wealth owners, whose wealth mostly consists of tenant-occupied housing, pension assets, and bonds and stock. This ensures that they could easily find sufficient liquidities to pay the tax. Also notice that our proposal only taxes excess wealth above the threshold that we propose: this limits the well-known incentive to “bunch" below the threshold, and further ensures that illiquidity should not be a problem.
Taxing trust/corporate wealth A tax on net worth should imperatively tax wealth held through trusts. Based on data from the South African Reserve Bank, we have estimated that more than 50% of shares held by households are held through unit trusts (Chatterjee et al. 2020). Trusts are well-known for being used extensively as legal vehicles to hold and transfer wealth. Indeed, transfers between member of the same “family” trusts do not trigger neither estate duty nor capital gains tax in South Africa. Assets (houses, land titles, corporate shares, etc.) can be thus transferred into such trusts, so that they can grow and be passed down to gener-ations without ever being subject to any tax (the only moment when a tax may be levied occurs when assets are handed to the trust). Exempting trusts’ wealth would both reduce revenues
2Note that all the necessary data to estimate revenues generated by alternative tax schedules (based on the same
Table 2: Marginal tax rates of proposed tax schedules
Wealth group No. adults Wealth threshold Low tax Moderate tax High tax
Top 1% 356,000 R 3,820,000 1% 3% 3% Top 0.1% 35,600 R 30,350,000 2% 5% 7% Top 0.01% 3,560 R 146,890,000 3% 7% 9%
Notes: Adults are individuals aged 20 y.o or older. Thresholds here are derived from our compan-ion paper before taking into account any discounting factors due to evascompan-ion or post-COVID asset depreciation.
substantially and reduce the effective tax rate of top wealth groups. Data on trusts’ incomes, as well as data on taxpayers benefiting from these trusts, are already collected on a regular basis by SARS. In this vein, strict enforcement strategies should also be put in place so as to prevent individuals from buying assets on their company’s behalf but for private benefits. In general, the regulation should be designed so that the ultimate effective beneficiaries of some asset would always be identical to the legal taxable owners of this asset.
Tax schedules considered We consider three tax schedules: a "low" wealth tax, a "moder-ate" wealth tax, and a "high" wealth tax (see table 2). For the low wealth tax, we propose a progressive tax rate from 1% to 3%; for the moderate tax, from 3% to 7%; and for the high tax, from 3% to 9%. The tax would only cover the top 1% of the South African adult population (about 350,000 individuals), so that individuals with net assets below the first threshold would be exempted. Note that these are marginal tax rates, meaning that even for individuals in the top 1%, the tax rates would only apply to wealth above the first threshold. Finally, nominal thresholds of table 2 are derived from our companion paper before taking into account any discounting factors due to evasion or post-COVID asset depreciation.
2.3 Key assumptions
To estimate the potential revenue from a wealth tax, we propose a very simple framework to account for economic and behavioural responses, as well as some potential sources of error. We start with the figures shown in table 1, which provide raw data on average wealth across the population, and we make a number of adjustments to estimate taxable wealth. We assume implementing policy makers would take these parameters ex-ante and adjust taxation thresholds accordingly to still target to top 1%.
Accounting for the COVID economic shock We account for the economic downturn in-duced by the COVID shock by assuming that the market value of bonds and stock has dropped by 20% since 2017 (the last year for which our companion paper estimates the distribution of household wealth). By assuming such decrease, we intentionally exaggerate the observable trend of the JSE All Share Index, and thus ensure that our estimates are conservative enough.
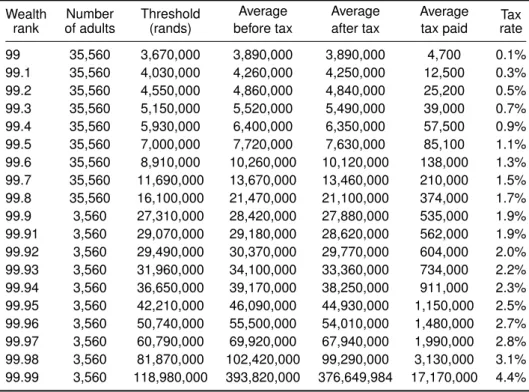
Table 3: The distribution of the tax burden (moderate tax, 30% evasion rate) Wealth rank Number of adults Threshold (rands) Average before tax Average after tax Average tax paid Tax rate 99 35,560 3,670,000 3,890,000 3,890,000 4,700 0.1% 99.1 35,560 4,030,000 4,260,000 4,250,000 12,500 0.3% 99.2 35,560 4,550,000 4,860,000 4,840,000 25,200 0.5% 99.3 35,560 5,150,000 5,520,000 5,490,000 39,000 0.7% 99.4 35,560 5,930,000 6,400,000 6,350,000 57,500 0.9% 99.5 35,560 7,000,000 7,720,000 7,630,000 85,100 1.1% 99.6 35,560 8,910,000 10,260,000 10,120,000 138,000 1.3% 99.7 35,560 11,690,000 13,670,000 13,460,000 210,000 1.5% 99.8 35,560 16,100,000 21,470,000 21,100,000 374,000 1.7% 99.9 3,560 27,310,000 28,420,000 27,880,000 535,000 1.9% 99.91 3,560 29,070,000 29,180,000 28,620,000 562,000 1.9% 99.92 3,560 29,490,000 30,370,000 29,770,000 604,000 2.0% 99.93 3,560 31,960,000 34,100,000 33,360,000 734,000 2.2% 99.94 3,560 36,650,000 39,170,000 38,250,000 911,000 2.3% 99.95 3,560 42,210,000 46,090,000 44,930,000 1,150,000 2.5% 99.96 3,560 50,740,000 55,500,000 54,010,000 1,480,000 2.7% 99.97 3,560 60,790,000 69,920,000 67,940,000 1,990,000 2.8% 99.98 3,560 81,870,000 102,420,000 99,290,000 3,130,000 3.1% 99.99 3,560 118,980,000 393,820,000 376,649,984 17,170,000 4.4% Notes: The table shows the estimated distribution of the tax burden when considering the moderate wealth tax and a 30% evasion rate. The unit of observation is the individual adult aged 20 or above. Interpretation: there are about 35,560 individuals belonging to wealth group P99.1–P99.2 — that is the group of individuals being sufficiently wealthy to belong to the top 0.9%, but not enough to belong to the top 0.8%. Individuals in this group have a minimum wealth of about 4.03 million rands, and an average wealth of about 4.26 million rands, after accounting for the drop in the JSE index. With the moderate wealth tax and assuming a 30% evasion rate, they would pay on average R 12,500 of tax, or 0.3% of their average wealth. This group would generate a revenue of about R 400 million, or 0.3% of the expected total revenue from the tax. Figures may not add up due to rounding.
The share of bonds and stock in total wealth is about 20% for individuals in the wealth group p99-p99.9, 55% for those in p99.9-p99.99, and 95% for those belonging to the top 0.01% (see figure 1). Accordingly, we reduce the average wealth of these three groups by 4%, 11% and 19% respectively.
Accounting for Evasion and Avoidance Under-reporting, evasion and offshoring are is-sues that should be considered seriously. We discuss in section 3.3 what the (scarce) literature on behavioural responses to taxation imply in terms of plausible parameters for the gap be-tween actual wealth and taxable wealth. In order to account for uncertainty in evasion, we propose three scenarios corresponding to different expectations on the ability of tax authorities to collect revenue. In our benchmark scenario, we assume a 30% evasion rate; our two other scenarios, which we take as a "confidence interval", correspond to a 10% and a 50% evasion rates respectively. We assume that the average evasion rate is constant within the top 1% for simplicity.
2.4 Main results: Estimates of Government Revenue
Based on these schedules and our assumptions, the computation is relatively straightforward: we first reduce the average wealth (and threshold) of each group to account for the COVID shock on bonds and stocks; we then reduce the average wealth (and threshold) by the evasion rate under our three scenarios to obtain taxable wealth; and we finally compute government revenue by applying the tax rate on wealth groups within the top 1%. All estimates provided in this paper are yearly figures, we do not delve into forecasting the revenues deriving from sequential implementation of the wealth tax.
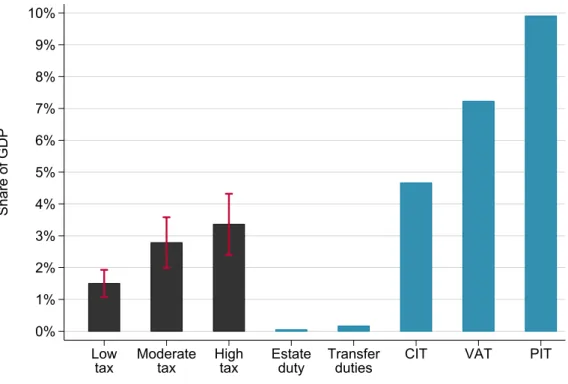
Estimates of total tax revenue The results of these computations are presented in figures 2 and 3. Depending on the extent of evasion, we estimate that a moderate wealth tax (with rates ranging from 3% to 7%) could raise about R70 billion to R160 billion – or 1.5% to 3.5% of GDP.3 In our benchmark estimate of a 30% evasion rate, the tax would raise 2.8% of GDP, or about R134 billion. This is equivalent to about two thirds of corporate income tax revenue, and about 40% of revenue from the value-added tax (see figure 2).4 Revenue from our wealth tax would be substantially higher than that obtained from existing "wealth taxes" in South Africa. In our benchmark scenario, the wealth tax would collect about 20 times more money than transfer duties, and as much as 60 times more than the estate duty. A moderate wealth tax would be sufficient to cover some 85% of debt-service costs and about 60% of all expenditures
3We estimate that the tax would collect approximately R72 billion, R134 billion, and R162 billion with evasion
rates of 50%, 30% and 10% respectively.
Figure 2: Potential wealth tax revenue relative to other tax revenue in South Africa 0% 1% 2% 3% 4% 5% 6% 7% 8% 9% 10% Share of GDP Low
tax Moderatetax Hightax Estateduty Transferduties CIT VAT PIT
Figure 3: Potential wealth tax revenue relative to government expenditure in South Africa
0% 1% 2% 3% 4% 5% 6% 7% Share of GDP Low
tax Moderatetax Hightax Debt-servicecost spendingHealth Social protectionspending
Notes: the figures compares the expected revenue from a low, moderate or high progressive wealth tax with that obtained from selected taxes (upper panel) or expenditures (lower panel) in South Africa in proportion of GDP in 2017. Confidence intervals correspond to evasion rates of 10% (lower bound), 30% (middle estimate) and 50% (upper bound). A moderate wealth tax with a 30% evasion rate could raise 3% of GDP. CIT: corporate income tax; VAT: value-added tax; PIT: personal income tax.
on social protection – including social security spending, all social grants, and provincial social development (figure 3).
Estimates of effective tax rates by wealth group Our simulation also allows us to estimate the effective tax rates paid by wealth group. These are presented in figures 4 and 5, which plot the tax rate faced by individuals depending on their position in the wealth distribution (figure 4) and their average wealth (figure 5). All the results underlying these figures, as well as estimates of pretax and posttax wealth, are displayed in table 3.
As explained above, the tax we propose only covers excess wealth above the top 1% wealth threshold. This implies, as shown in the figures, that someone at the threshold, with a wealth of R3.6 million (threshold adjusted for evasion and post-COVID depreciation), would face a 0% tax rate. Given a 30% evasion rate, the effective tax rate faced by the top 0.01% would be about 4.4% of their wealth. Furthermore, because of the exemption below the threshold that we propose, the wealth tax would only kick in at very high levels of wealth. Indeed, with a 30% evasion rate and the moderate tax, the effective tax rate would only exceed 1% for individuals with wealth higher than R7 million.
2.5 Robustness and Limits of Our Estimates
Now we briefly elaborate on the limitations of our estimates. Some of these limitations imply that we might be overestimating the revenue that could be collected from the tax; others suggest that we might be underestimating it.
Overestimation of top wealth inequality Our estimates may be too high if our study incor-rectly measured wealth inequality in the first place, that is if the average wealth of top wealth groups in South Africa appears to be lower than what we estimated. This is a serious issue: as mentioned earlier in this paper, the data sources at our disposal are scarce, and our estimates are the result of a complex exercise of combining them and approximating the distribution of wealth components in a very imperfect way.
In particular, we estimate the concentration of financial assets by relying on financial incomes (what is called the "income capitalisation" method). This implies that if high net worth in-dividuals have much higher average rates of returns than the rest of the population, then our methodology will overestimate their share of wealth. This is why it is imperative that our esti-mates are verified against estate duty data, dividends tax data, and trust data, which have been collected by SARS but are not available to academic researchers.
That being said, there is suggestive evidence corroborating our findings. According to AfrAsia, a consulting company, South Africa was home to about 39,200 US dollar millionaires in 2019, with a combined wealth amounting to 42% of total private wealth in South Africa (AfrAsia
Figure 4: Effective tax rate paid by percentile, moderate tax 0 1 2 3 4 5 6
Effective tax rate (% of wealth)
99 99.1 99.2 99.3 99.4 99.5 99.6 99.7 99.8 99.9 99.99
Wealth group (percentile)
Figure 5: Effective tax rate paid by average wealth, moderate tax
0 1 2 3 4 5 6
Effective tax rate (% of wealth)
0 50 100 150 200 250 300 350 400
Rands millions
Notes: the figures compares the expected tax rates on wealth paid by percentiles of net worth (upper panel) or by average wealth (lower panel) if South Africa was to implement the moderate wealth tax. Confidence intervals correspond to evasion rates of 10% (lower bound), 30% (middle estimate) and 50% (upper bound).
2019). This corresponds to about 0.11% of the population. Our estimate of the top 0.1% share is 29.8%, well below this figure. Similarly, according to Forbes, there were four USD billionaires in South Africa, with a combined net worth of some 15.4 billion USD (Forbes 2020). With a pre-crisis Rand to dollar exchange rate of about 13.3, this puts their share of wealth in total private wealth in South Africa at about 1.8% (accounting for offshore wealth).5 Based on 2015 data compiled by Forbes, Orthofer (2016) also estimated that the 10 richest South Africans had a combined net worth equal to about 5% of private wealth. Our result on the top 0.01% of the population, that 3,500 individuals own 15% of wealth in South Africa, does not seem particularly at odds with these findings and, if anything, relatively low. To be sure, these alternative figures should not be taken at face value, given that we have no information on their methodology and underlying data sources, but they are suggestive of the extreme concentration of wealth in South Africa.
Finally, let us stress that our study is very conservative when it comes to measuring inequali-ties in certain forms of assets (seeChatterjee et al.(2020)). For instance, we use the General Household Survey (GHS) to measure the distribution of owner-occupied housing, because this is the only survey doing so every year since the early 2000s and our objective was to be con-sistent across time. The GHS only collects data on the reported municipal value of houses in rough brackets, which implies that there is no doubt that we are underestimating housing wealth inequality. The top 10% share of housing wealth is about 60-70% in our dataset; when computing the same indicator on the National Income Dynamics Survey (NIDS), we find a figure of at least 75-85%. Both of the sources are household surveys, which are well known to insufficiently cover the top end of the distribution, so inequalities in housing wealth are likely to be even higher.
Change in market value of wealth since 2017 For simplicity and consistency with our previous work, we have kept our wealth distribution of 2017, expressed in 2018 Rands, as in our previous paper. This implies that we are underestimating average wealth in 2020 given that we do not account for inflation and real capital accumulation that occurred since then. It might also be that the COVID-19 crisis has led to a sharper drop in aggregate wealth than what we estimate. Unfortunately we have no good data at our disposal to check this. We also do not include the impact on pensions, as there is not sufficient information available to model the shock to portfolio composition of stocks and bonds in pension funds. In both cases, we doubt that our results would be affected substantially.
Underestimation of aggregate wealth Our estimates might also be affected not only by mismeasurement of wealth inequality, but also by mismeasurement of aggregate wealth. All
5SeeChatterjee et al.(2020) for more details on the share of offshore wealth in aggregate wealth in South Africa,
the evidence at our disposal points to the South African Reserve Bank potentially underestimat-ingaggregate wealth significantly. The total market values of households’ real estate properties reported in surveys are typically 50% to twice higher than that reported in official households’ balance sheets statistics (Chatterjee et al. 2020). This may be due to over-reporting by house-holds, but such a strong discrepancy also points to under-estimation of housing wealth by the SARB. Furthermore, the SARB is currently revising its estimates of total private wealth in South Africa, which we expect to lead to upward revisions of financial assets. This implies that our estimates of expected revenue from a wealth tax are likely to be biased downwards.
3
Taxing wealth: feasibility and economic consequences
It is beyond the scope of this paper to engage in a complete discussion of the pros and cons of taxing wealth. For good reviews of the available literature, we refer the reader to the Davis Tax Committee, as well as to the more updated study on the feasibility of taxing wealth, with a focus on the case of the United States, by Saez and Zucman (2019). In what follows, we briefly discuss some areas of uncertainty and common interrogations related to (1) the technical feasibility of implementing a wealth tax in South Africa, (2) the problem of taxing illiquid taxpayers with “high wealth" but “low income" (3) tax evasion, avoidance and migration, (4) alternative capital-related taxes, and (5) the impact of wealth taxation on growth.
3.1 Technical Feasibility
Implementation of any policy is often the crucial factor in determining its efficacy. In the case of the wealth tax, implementation is often raised as the key cost that prevents this being a realistic tax policy (Davis Tax Committee 2018). We take key components of implementation challenges raised in the Davis Tax Committee report (subsequently referred to as DTC) and consider them in turn, presenting both the challenges and potential solutions.
Overall, we stress that third party information is crucial in implementing a tax successfully. The implementation principle behind the efficiency of tax collection is simple: financial instru-ments such as equities and tradable bonds are held in a central securities depository (Strate Ltd in South Africa); custodian banks hold other bonds and funds; deposits are kept in banks; and insurances keep pension plans and other investment products. By collecting information at the source via these institutions, and making taxpayers pay the tax through pre-filled declarations of assets and liabilities, tax avoidance opportunities are minimal. As in the case of other with-holding taxes, the custodians and institutions at the source could pass the cost down the with-holding chain.
Stocks and bonds Open market valuation gives an accurate value of stocks and bonds to be taxed, as per DTC. A 3 month moving average can be used to remove “noise” from
ran-dom short-term price fluctuations, and prevent taxable value from dramatically changing from choice of valuation date. However, volatility per se is not a reason not to tax – incomes do vary, still they are taxed. To obtain valuation and ownership data on stocks and bonds, the administration could rely on the third party agents, as it already does to collect the Dividends Tax. Intermediary agents extract the relevant supporting data from their respective information systems and upload the data in a prescribed format to SARS’ systems. Currently, the system is designed only to collect information on stocks that pay out the dividends. However, interme-diate agents possess data on all stocks that their clients hold, irrespective of dividend pay outs, as demonstrated by the tax certificates that are issued. Thus it appears that to obtain the infor-mation, the system template would simply need adjusting the fields of information required. The reporting channels between third-party and SARS are already established, with only slight tweaks needed.
Bonds held directly lead to taxable interest payments, which are subject to the income tax. Bonds are primarily bought through intermediaries, or banks. Intermediaries also possess in-formation on bond holdings, so they can declare this inin-formation similarly to equities. Institu-tions such as banks are required to submit information directly to report interest income from investments, rental income, dividends, royalties and other income that was due, paid or accrued to account holders, via IT3(b) submissions, so data on the market value of bonds could be collected through this channel.
SARS are currently developing a Third Party Data Platform to accommodate bulk submissions of Third Party Data for certain types of taxes on the new Direct Data Flow channels. Both valuation and costs in this regard seem eminently practical.
Pension and Retirement Funds As explained above, we do not propose exemptions for retirement funds. A significant proportion of wealth is held in pension and retirement funds. DTC note that “The tax incentives and exemptions granted to South Africa’s retirement funds [has led them to] become relative tax havens for the wealthy”. A wealth tax would not be effective if pension funds are exempted. Exemptions would create misallocations of investment and tax administration problems as individuals would restructure their investments for rent-seeking purposes (Rudnick and Gordon 1996).
Currently, the only information SARS receives are pension and other retirement fund contri-butions, rather than valuations. Financial services firms that manage these funds do provide to their clients a valuation of each contributor’s fund, according to regulatory standards, and as evidenced by account statements provided to customers.6 The financial services industry
6Valuation of defined benefit pension funds is often raised as a potential obstacle. However, valuation methods are
established for these, for example, in divorce proceedings and estate duty calculations. For discussion of valuation methods, seeRamm and Eames(2020).
is data driven, and so as per earlier asset types, these values can be submitted via third-party reporting.
Property Property valuation is, as per DTC, the most challenging area of implementation. Municipal Valuation Rolls use inconsistent methods in calculating the values, while not all rolls are up to date or comprehensive. However it is important to stress that SARS would not start from scratch as property values are required for the administration of the Property Tax. A long term solution could be to centralise housing market information on a unique online platform where each transaction would need to be recorded first for the property transfer to be become legally binding. In the shorter run there are property companies, such as Lightstone, that already collect data on market valuations. This would need to be explored further, and the viability of such a partnership can only be assessed by SARS.
Wealth held abroad A last significant challenge relates to the difficulty for SARS and other domestic institutions to observe wealth held outside of South Africa. The risk is to let indi-vidual transfer (part of) their wealth in foreign jurisdictions, where no tax on capital is levied, while still being able to benefit from it - by spending it abroad or by repatriating derived capital income. To tackle this, SARS should first make sure to adequately scrutinize income out-flows/inflows made/received by individuals (or the corporations/trust they relate to) which can be considered as comparatively wealthy according to available information on domestic wealth or income. Then SARS should widely support and endorse international tax transparency re-forms such as the OECD led Automatic Exchange of information initiative and the creation of Ultimate Beneficial Owner registers in EU countries. For a longer discussion on the feasibility of taxing foreign wealth, see section 3.3 bellow andPiketty(2020), chapter 17.
International Comparisons International comparisons are often used in arguing that a wealth tax is impractical to implement and so unfeasible. The majority of these examples are instances in the OECD. As discussed extensively in Saez and Zucman(2019) and elsewhere, the chal-lenges that these taxes faced were largely due to the specific context of tax competition across EU countries. Other examples, such as India, have struggled due to significant exemptions introduced. Crucially, discussion of these examples ignore that implementing a net wealth tax has indeed been possible in a number of countries at a time when administrations were still entirely paper-based. A recent OECD report recalls that Switzerland instituted a similar tax as early as in 1840, to be followed by Norway (1892), Denmark (1903), Finland (1919), Lux-embourg (1934), Sweden (1947), Germany (1952), Austria (1954), the Netherlands (1965), Ireland (1975), Spain (1977) and France (1982) (OECD 2018).
Outside of the OECD circle, the Colombian case is perhaps the most compelling example that practical obstacles in South Africa are tractable. A tax on net wealth has been enforced from
1935 to 1992, then from 2002 until now. In this most recent period, Colombia re-introduced a wealth tax in order to fund a response to the security crises. Details of the wealth taxes imposed are given in table A1. Prior to the 2002 wealth tax, the Colombian tax system was character-ized as having "severely limited administrative capability" (Bird 1992, p. 27), even after several rounds of reform, with insufficient attention given to building the administration itself. It was at this time of formidable tax administration constraints that Colombia re-introduced and ad-ministered the wealth tax.
The tax could be collected in two instalments and focused on liquid assets to assist with liq-uidity and ease of payment. In 2006, the government listed all public and private institutions required to provide third-party information and created an online web-portal to upload these reports. Nowadays, the value of all financial assets is reported online by third-parties. Is-sues remain - e.g debt over-estimation or implausibly low property valuations - but not to the point that the tax should be repealed, and it has generated sufficient revenue to significantly contribute to its original policy objective. The Colombian example demonstrates that weak im-plementation capacity is not a sufficient reason to dismiss the use of a wealth tax to meet policy objectives.
There were some key factors in the political economy that enabled implementation challenges to be addressed. First the context played a significant role. The reintroduction of the wealth tax in 2002 came in a period of economic turmoil and public safety collapse. There was a high level of dissatisfaction with the government’s ability to manage finances and make progress on security issues, as well as prior financing obligations. Addressing the crisis of internal security while "reining in the drastic escalation of the debt became a priority for the government", and together created an "impetus for taxation" (Flores-Macías 2014, p. 486). The newly elected President responded to the momentum by decreeing a "State of Internal Commotion" (akin to declaring a state of emergency), and then establishing the creation of the wealth tax. Second, revenues collected with the tax (labelled the Democratic Security Tax) were tied to expendi-tures of a public good, namely security spending, that was a tangible benefit to everyone. Last, a joint oversight committee gathering civil servants and private actors was put in place to ade-quately monitor the expenses funded by the tax. This was possible due to established business organisations, civil society, and a stable democracy that ensured fiscal commitments would be honoured by any successive administration. The Colombian case shows that to credibly alle-viate very legitimate concerns about corruption and misspending, newly introduced taxes must be accompanied with increased transparency.
Overall At first, all these changes might seem very costly. But the expected costs - which only SARS itself can precisely estimate - must be weighed against the expected tax revenue. Given that the total current operating cost of revenue collection in SARS is equal to about
10% of the revenue that could be collected from the wealth tax that we propose, we believe administrative costs are not a compelling argument to discard our policy proposal.7
Also, it would seem unlikely that introducing a tax on net wealth above R 3,600,000 is prac-tically not realistic while there already exists a tax on net total estate above R 3,500,000. Ob-viously, the current system would need to be scaled up, as the wealth tax we propose would certainly apply to more people; and considerably improved, to enforce third-party reporting whenever possible. But it is not clear why this would be impossible. Moreover, the costs in-curred to set up the wealth tax would incidentally make the administration more efficient at collecting the current estate duty, as well as income tax on incomes earned from assets.
As we do not operate from within the administration, there might still be some details we are missing, making this tax truly infeasible in the coming years. If this were to be the case, given the potential benefits at stake, we hope that this report would induce the supporters of that view to be as detailed and transparent when sharing their explanation.
3.2 Illiquid Taxpayers
One common and legitimate concern regarding the feasibility of a wealth tax is the ability for the taxpayers to duly pay the tax. Some forms of wealth are less liquid than others - e.g. residential housing as compared to cash deposits. Thus there is a risk for some taxpayers to be asset-rich, but income-poor. Given the design of the tax we propose here, we believe this should be a very minor risk. First, the threshold above which net wealth would start to be taxed is arguably high: only 1% of all South African adults do own more wealth than this. Second, it is important to stress again that the marginal tax rates apply only to wealth above the threshold. For instance (assuming no evasion, no depreciation) a person with R6 million net worth would have to pay (6,000,000 - 3,820,000) × 3 % = R 65,400, and not R 180,000 (i.e. 3 % of R6 million) as is sometimes believed. Third, in the unlikely event that even with that schedule, an individual might find herself unable to immediately pay the tax, SARS could allow paying by instalments, as is often done for firms.
3.3 Tax Avoidance and Evasion
Available evidence on the combined responses to wealth taxation in terms of evasion, avoid-ance, and migration are scarce. In what follows, we cite a few key studies which motivate our benchmark estimate of a total evasion rate of 30%.
Wealth hidden in tax havens Wealthy individuals may hide assets in offshore tax havens to evade taxes. This is an important issue which should not be ignored and should be quantified as
much as possible. By combining a number of data sources for Norway, Sweden and Denmark,
Alstadsaeter, Johannesen, and Zucman(2019) estimate that the top 0.01% of the wealth distri-bution are able to evade between 20% and 30% of all the taxes they owe by hiding their wealth in tax havens (offshoring), while wealth groups between p99 and p99.9 typically evade 0% to 10% of taxes. Notice that this study includes all personal taxes, and not only tax on wealth, so it does not provide a direct estimate of our parameter of interest. Similarly,Londoño-Vélez and Ávila Mahecha(2018) find that at least 40% of individuals in the top 0.01% hide part of their wealth offshore in Colombia. In South Africa, offshore wealth amounts to about 5% of aggregate wealth (Chatterjee et al. 2020;Alstadsæter, Johannesen, and Zucman 2018). Assum-ing that all this wealth corresponds to bonds and stock, this reduces taxable bonds and stock by about 15% (as bonds and stock represent about 33% of aggregate wealth). Therefore, as-suming for simplicity that all this wealth is concentrated within the top 0.01%, evasion due to offshoring among this group would be about 15%. Total evasion due to offshoring would be lower, given that a significant share of taxable wealth still consists of other forms of wealth such as pension funds and housing.
Wealth held by residents in South Africa Our estimates exclude assets held by non-residents in South Africa. Including South African assets held by non-non-residents in the tax base would therefore increase expected government revenue. While this remains a particularly difficult task, taxing assets held by foreigners in South Africa could be considered, and should be carefully evaluated. In principle, the South African government could ask intermediaries to provide information on foreign financial assets holdings, which should be possible through the existing OECD system of automatic exchange of information on international financial assets. This practice is on the rise: in 2018, information exchanged revealed the existence of 47 million offshore accounts sheltering 4.9 trillion euros; in 2019, 84 million bank accounts were uncovered, amounting to 10 trillion euros, i.e 12.7 % of world GDP (seeOECD, 2020).
The tax could then be collected directly from financial institutions, based on all assets held in South Africa by identified foreigners. Ultimately, the government could also oblige all firms that undertake economic activity on South African territory to declare final foreign individual beneficiaries from their activities (as is being implemented now in the EU, see5th Anti-Money Laundering Directive), and collect the tax directly from these firms accordingly.
Wealth held by South African residents abroad (excluding tax havens) Our estimates include assets held legally by South African residents in other countries, which are part of the official definition of household wealth published by the South African Reserve Bank. The tax-ation of financial assets held by South African residents abroad (excluding those hidden in tax havens) poses challenges similar to those faced when considering wealth held by foreigners. Information on foreign holdings can be collected through the OECD system of international
transmission of information, and the value of foreign assets can be added to the taxable wealth of resident taxpayers. The South African Reserve Bank does not publish official series on the total value of foreign assets legally held by South African residents abroad. Aron, Muellbauer, and Prinsloo (2008) estimate that total foreign assets were approximately equal to 3.7% of household disposable income in 2005, or about 0.9% of net personal wealth in South Africa. Therefore, we doubt that our estimates would be significantly affected by the inclusion or ex-clusion of assets held abroad by South African residents.
Migration Taxpayers may attempt to avoid paying the tax by migrating to another country. This has been found to be a significant issue when looking at long-run behavioral responses, particularly in high-mobility territories like the European Union. A thorough review of the most recent literature can be found inKleven, Landais, Munoz, and Stantcheva(2020). In the very short term, even in the presence of relatively high taxes we believe this would not necessarily lead to a dramatic leak as changing residencies is not a simple decision to take and wealth transferred out is subject to the annual foreign investment allowance, which has a limit of R10 million per individual per year. However in the longer term, migration could be an issue if the wealth tax is set permanently at too high levels. To mitigate this risk, South Africa could keep long-term marginal tax rates relatively low, tie tax payments to citizenship as done in the United States, and/or implement an exit tax. All these reforms would contribute to reduce incentives to expatriate (Saez and Zucman 2019).
Short-term elasticity of taxable wealth A number of studies have exploited variations in tax rates to measure how taxable income or wealth adjust to these differences before tax. However only one study (Londoño-Vélez and Ávila Mahecha 2018) has attempted to do so in an emerg-ing country: the authors find that the short run elasticity of reported wealth is 2, in other words, a 1% change in the net-of-tax wealth induces a 2% change in reported wealth. This would im-ply an avoidance/evasion behavioural response of at most 15% for the 7% top marginal tax rate that we propose in our benchmark estimation. The overall avoidance/evasion rate will again be lower, given that we propose lower marginal tax rates for lower wealth groups.
Plausible evasion rates in South Africa Summing up the previous discussion, evasion through offshoring in tax havens is likely to be at most 10%-15% of total taxable wealth; evasion through migration is likely to be insignificant in the short-run; and short term behav-ioral responses are likely to be below 15%. This would put the typical short-run evasion rate in South Africa at about 25% to 30%.8
8There is limited literature available on taxation and behavioural responses in South Africa. Most recently,Kemp
(2019) estimates the elasticity of taxable income, whileErero and Gavin(2015) use a CGE model to investigate the impact of the 2012 dividend tax increase on the South African economy. Unfortunately, these studies do not provide estimates of short term responses on taxable wealth.
That being said, we cannot absolutely guarantee that the short-term reaction to the tax will not be stronger than expected. Taxpayers may massively under-report the market values of their assets, or hide a substantial share of their wealth in offshore accounts. We also unfortunately have very little empirical evidence about the long-term behavioral responses induced by a per-manent wealth tax. The only paper that documents such effect estimates a 10-30% reduction in reported wealth after 8 years (Jakobsen, Jakobsen, Kleven, and Zucman 2020) taking into account all types of responses - not only evasion but also saving decisions. This is not a ques-tion to which our data nor the literature can give a definite answer. Nevertheless, the literature agrees that the degree to which evasion and avoidance take place is strongly determined by the legal and administrative framework. Eventually, efforts made by the tax administration to strictly enforce the law, carry out tax audits and cross-check taxpayers’ declarations with third-party information can significantly mitigate the impact of unlawful behaviors on tax revenue. In this respect, Londoño-Vélez and Ávila Mahecha(2018) find that the voluntary disclosure scheme enforced by the Colombian government induced evaders to disclose the equivalent to 1.7% of GDP in hidden taxable wealth to avoid possible legal sanctions – with 40% of the top richest 0.01% reporting concealed foreign assets.
Enforcing a wealth tax is probably difficult, but simply assuming is cannot be put in place certainly discourages efforts to do so and may thus become a self-fulfilling prophecy. In this regards, it is crucial that SARS continues to reinforce its collaboration with other adminis-trations, banks and financial intermediaries, domestic or abroad, along the common reporting standards set by international conventions on Automatic Exchange of Information.
3.4 Alternative capital-related taxes
As many countries, South Africa already has in place a couple of tax instruments which target assets or income deriving from asset ownership. We can classify these instruments into three categories: taxes on transferred assets (transfer duty, donation tax, estate duty, and to some extent taxes on retirements lump sum benefits), taxes on income derived from capital ownership (dividend tax, withholding tax on interest, capital gain tax), and taxes on asset ownership (local property tax). In light of this, one might argue that South Africa already levies enough taxes on capital. But the wealth tax we propose stands out among other capital-related taxes because 1) it takes all assets into account, 2) it allows to deduct debt, 3) it is progressive and 4) it is levied on a yearly basis.
The municipal property tax, collected by and for municipalities, is the closest policy to what we propose. It is the only one that is triggered by the fact of owning an asset, rather than acquiring it. However, it suffers from two major drawbacks. Given that it only applies to the value of housingproperty and excludes other types of assets it fails to be progressive with respect to the distribution of total assets. Indeed, with the existing system, a person owning a house of R4m
will pay the same amount of tax, as a person owning not only a house of R4m, but also a R100m private jet and some corporate shares worth R50m. In fact, given that the relative importance of housing property decreases in individual portfolio at the very top of the wealth distribution (see Figure 1), the municipal property tax is even regressive among the richest. The property tax is also particularly unfair as it does not take into account the level of indebtedness. A person who just bought a house and needs to reimburse the credit on this house each month will have to pay the same amount of property tax as one who owns a house worth the same value but has no credit to reimburse (because she already reimbursed it, or say, because it was paid for by her parents whom she inherited from). In the long run, if the implementation of the wealth tax is successful enough, and conditional on a proportional increase of transfers from the central government to the municipalities, the property tax could be progressively abandoned.
Taxes on transferred assets are not collected on a regular basis and leave room for some avoid-ance strategies. The administration needs to wait for the asset to be sold, given, or demised for any tax to be levied. As long as the owner prefers to keep the asset, it is never taxed, even if its value grows. This feature allows unlimited private wealth accumulation, and limits the ability of the administration to collect resources on a regular basis and where it is most concen-trated. As in the case of the property tax, taxes on transferred assets fail to be progressive with respect to the distribution of total assets. A person with no prior wealth who buys some land for instance will pay the same transfer duty on this transaction as one buying similar rights for the same amount but who already owns a vast amount of land. Moreover, taxes on transferred assets all have relatively high exemption thresholds: R 1,000,000 for the transfer duty (yearly), R 100,000 for the donation tax (yearly) and R 3,500,000 for the estate duty. Therefore, signif-icant amount of wealth can change hands without ever being taxed, regardless of how initially wealthy the beneficiaries are. As with the local property tax, the donation tax and the transfer duty could as well be repealed in the long run, once the administration has become efficient enough to collect the wealth tax. We would however not advocate for the suppression of the estate duty. The estate duty indeed has the unique property to allow redistribution without expropriation - as the owner is dead - and for this reason, it is a central policy tool to limit intergenerational transmission of wealth, and improve equality of opportunity with limited ad-verse impact on incentives. Nevertheless, the tax code should be adapted so as to revoke the possibility for transfers to be made within trusts without triggering the estate duty (see above section 2.2)
It is often argued that, for the sake of administrative simplicity, it is preferable to tax capital income than capital itself, with the idea that, assuming for instance a 4% rate of return, a tax on capital with an average tax rate of 1% is equivalent to a 20% tax on capital income. However the equivalence is not exact. First, as for transferred assets, the payment of the dividend tax would need to be triggered by an event over which the administration has no control. Interest
typically comes on a regular basis, but dividends may be converted to retained earnings if beneficiaries prefer to. Most importantly, some assets we include into our tax base do not generate capital income, such as owner-occupied housing, vacant land and houses, or current bank account deposits. Therefore, in the example above, 1% of total wealth should be greater than 20% of capital income. Finally, we believe our wealth tax can be complementary rather than a substitute to currently existing taxes on capital income. More precisely, to reinforce the progressiveness of the personal income tax, dividends and interests should not be taxed separately, but added to total income liable to personal income tax, as it is already done for rental income and capital gains9.
3.5 Impact on Growth
It is often argued that wealth should not be taxed because it would have a detrimental impact on growth. This prediction is essentially based on two general arguments. The first one is that com-petitive markets are more efficient than the government at producing and allocating resources across economic actors. The second is that, by imposing an additional cost on production or consumption, taxation inevitably makes economic activity less profitable, which discourages effort or investments, and distorts markets, leading to a sub-optimal equilibrium.
These concerns are valid. However they apply to any type of tax and do not entail that lower taxes are always desirable. Indeed sharing resources through tax collection and expenditure is fundamental to guarantee the very existence and regulation of markets, to provide public goods which markets fail to produce, and to build elements of a welfare state allowing to pool idiosyncratic shocks nationwide. For all these reasons the relevant general policy question is not whether taxes should be collected, but rather how much should be collected and how. Also, while it was long believed by economists that optimal capital taxation should converge to zero in the long run, this vision has been increasingly disproved by a growing body of theoretical research in recent years. Straub and Werning (2020) show for instance that even in standard optimal taxation theories, a positive capital tax can be socially desirable for centuries, and even indefinitely under loose conditions.
Adequately used tax revenue can for instance help fund social transfers and economic assis-tance to individuals and firms most severely hit by the current economic downturn. The quicker vulnerable actors can recover from the shock, the quicker they can actively contribute to the economy again. This important mechanism should not be neglected when considering the pros and cons of the different policy tools to address the current crisis. In this respect it is worth recalling that from our benchmark estimation, a moderate wealth tax would help collect the
9With notable exceptions however. High exemption thresholds allow, for instance, to make net benefit of
Figure 6: Wealth inequality within age groups, 2010-2017 40 45 50 55 60 65 70 75 80 85 90 95 100 105 110 Share of wealth (%) 2010 2011 2012 2013 2014 2015 2016 2017
Top 10% (20-39 yr) Top 1% (20-39 yr)
Top 10% (40-59 yr) Top 1% (40-59 yr)
Top 10% (60+ yr) Top 1% (40-59 yr)
Notes: The figure shows top 10 per cent wealth share and the top 1 per cent wealth share estimated when splitting the South African population into three age groups (20-39 years old, 40-59 years old, and 60+ years old). The unit of observation is the individual adult aged 20 or above.
Source: (Chatterjee et al. 2020)
equivalent of about 60% of all expenditures on social protection – including social security spending, all social grants, and provincial social development.
A wealth tax could also be growth enhancing by lowering public debt and reducing the effect of debt overhang caused by the COVID crisis, the effects of which are particularly relevant in low-income countries (Woo and Kumar 2015). This would depend on the degree to which this allows the crowd-in effect to dominate the crowd-out effect (Arai, Kunieda, and Nishida 2014). Arguably, lowering public debt to a sustainable level would position the economy optimally for economic recovery by improving South Africa’s risk-rating score published by rating agencies, allowing to borrow at lower rates and eventually better attract foreign investors.
Also, we have shown inChatterjee et al.(2020) that wealth is highly concentrated even among younger cohorts, as illustrated by figure 6, indicating the heavy relevance of inheritance. In cases where inherited wealth is significant, we could argue that a wealth tax may be growth enhancing by inducing some younger cohorts to increase their labor income and create their own wealth rather than relying on capital income earned through inherited wealth.
Eventually, given the current state of our knowledge, forecasting the impact of the introduction of a wealth tax on growth is extremely complex as multiple, conflicting, mechanisms are at play. The optimal amount of tax to be collected is thus unknown, and should ideally result from
an informed collective policy choice. By providing new evidence on the potential revenues collected from a wealth tax, we hope this policy paper could contribute to this debate.
References
AfrAsia. (2019). ‘AfrAsia Wealth Report South Africa 2019’. Technical Report.
Alstadsaeter, A., Johannesen, N., and Zucman, G. (2019). ‘Tax evasion and inequality’. Amer-ican Economic Review, 109(6): 2073-2103.
Alstadsæter, A., Johannesen, N., and Zucman, G. (2018). ‘Who owns the wealth in tax havens? Macro evidence and implications for global inequality’. Journal of Public Economics, 162(1): 89–100.
Arai, R., Kunieda, T., and Nishida, K. (2014). Is Public Debt Enhancing or Growth-Reducing? (Kier Discussion Paper Series 884)
Arndt, C., Davies, R., Gabriel, S., Harris, L., Makrelov, K., Modise, B., Robinson, S., van Sev-enter, D., and Anderson, L. (2020). Impact of Covid-19 on the South African economy: An initial analysis. (SA-TIED Working Paper 111)
Aron, J., Muellbauer, J., and Prinsloo, J. (2008). ‘Estimating the Balance Sheet of the Personal Sector in an Emerging Market Country: South Africa, 1975-2005’. In J. B. Davies (ed.), Personal wealth from a global perspective. Oxford University Press.
Bird, R. M. (1992). ‘Tax reform in latin america: a review of some recent experiences’. Latin American Research Review, 27(1): 7–36.
Chatterjee, A., Czajka, L., and Gethin, A. (2020). Estimating the Distribution of Household Wealth in South Africa. (WID.world Working Paper 2020/06)
Davis Tax Committee. (2018). ‘Report on the feasibility of a Wealth Tax in South Africa for the Minister of Finance’. Report for the Minister of Finance of South Africa.
Erero, J. L., and Gavin, E. (2015). ‘The impact of the dividend tax in south africa: A dynamic cge model analysis’. Economic Research Southern Africa Working Paper,(544): . Flores-Macías, G. A. (2014). ‘Financing security through elite taxation: The case of colombia’s
“democratic security taxes”’. Studies in Comparative International Development, 49(4): 477–500.
Forbes. (2020). ‘Forbes Africa Rich List 2020’. Technical Report.
Jakobsen, K., Jakobsen, K., Kleven, H., and Zucman, G. (2020). ‘Wealth taxation and wealth accumulation: Theory and evidence from denmark’. The Quarterly Journal of Eco-nomics, 135(1): 329–388.
Kemp, J. H. (2019). ‘The Elasticity of Taxable Income: The Case of South Africa’. South African Journal of Economics, 87(4): 417–449. Retrieved 2020-05-04, from https:// onlinelibrary.wiley.com/doi/abs/10.1111/saje.12232 doi: 10.1111/saje.12232
Kleven, H., Landais, C., Munoz, M., and Stantcheva, S. (2020). ‘Taxation and migration: Evidence and policy implications’. Journal of Economic Perspectives, 34(2): 119–142.