HAL Id: hal-02876982
https://hal-pjse.archives-ouvertes.fr/hal-02876982
Preprint submitted on 21 Jun 2020HAL is a multi-disciplinary open access
archive for the deposit and dissemination of sci-entific research documents, whether they are pub-lished or not. The documents may come from teaching and research institutions in France or abroad, or from public or private research centers.
L’archive ouverte pluridisciplinaire HAL, est destinée au dépôt et à la diffusion de documents scientifiques de niveau recherche, publiés ou non, émanant des établissements d’enseignement et de recherche français ou étrangers, des laboratoires publics ou privés.
Ten facts about income inequality in advanced economies
Lucas Chancel
To cite this version:
World Inequality Lab Working papers n°2019/15
Ten facts about income inequality in advanced economies
Lucas Chancel
Keywords : inequality; advanced economies; income inequality; wealth
inequality; inequality data; Distributional National Accounts; DINA; inequality
measurement;
Ten facts about inequality in advanced economies
Lucas Chancel
1,2This version: October 16th, 2019
This paper presents 10 basic facts regarding inequality in advanced economies. Income and wealth inequality was very high a century ago, dropped in the 20th century, and has been rising at different speeds across countries since the 1980s. The financial crisis of 2008 does not appear to have inverted this trend. At the global level, while between-country inequality mattered more than within-country inequality in the 1980s, it is the opposite today. The rise of inequality has not been counterbalanced by an increase social mobility. The reduction of gender pay gaps has tempered the rise of inequality in recent decades, but gender inequality remains particularly high among top income and wealth groups. Racial inequalities remain large as well. Evidence suggests that trade and technology alone cannot explain large inequality variations across rich countries. Shifts in tax and wage setting policies, as well as differences in educational and health systems matter a lot.
1 World Inequality Lab, Paris School of Economics 2 Sciences Po
Postal address: World Inequality Lab at the Paris School of Economics, 48 Bd Jourdan, 75014 Paris. Contact: [email protected]. The author would like to thank Tancrède Voituriez, Olivier Blanchard and Dani Rodrik, Thomas Blanchet as well as colleagues at the World Inequality Lab for comments. Thanks to Abhijit Tagade for excellent research assistance.
Introduction
Inequality in high-income countries has attracted significant attention in recent years among academics, international organizations, civil society and policymakers1. This interest contrasts with the relatively little appetite for distributional issues that characterized the economics discipline in the second half of the 20th century. The idea that more economic development led to lower levels of economic inequality, conveyed by Kuznets’ seminal piece on economic growth and income inequality, (Kuznets, 1955) has been widespread in the economic literature. J. Galbraith, for instance, argued in the late 1950s that “few things are more evident in modern social history than the
decline of interest in inequality as an economic issue”2. In the second half of the 20th century, it had been quite common to think about inequality as a developing-world issue – not a rich country’s problem.
The last two decades witnessed a renewed interest in the distribution of income and wealth. A key development has been the production of systematic historical inequality series based on the mobilization of tax data (Atkinson and Harrison, 1978; Piketty and Saez, 2003), which makes it possible to track income and wealth inequality from a global and historical perspective. At the same time, public opinion in rich countries is showing increasing concern with the distribution of economic growth, particularly in the context of the global financial crisis of 2008 and the subsequent rise of a new wave of anti-globalization discourse.
To be sure, our knowledge of inequality and its drivers is still limited. The opacity of the financial system and the limitations of standards tools and concepts to track income and wealth hinder our ability to grasp the complex nature of inequality in the 21st century. Such a situation limits the quality and scope of public policy debates on inequality and growth. And yet, there has been a “quantum leap” in the realm of inequality research. This paper seeks to review recent findings on income and wealth dynamics in rich countries, discuss them in the broader context of educational, intergenerational, gender and racial inequalities, and provide insights on the policy implications of this burgeoning literature.
1 See for instance Piketty, 2014; Stiglitz, 2012; IMF, 2017 and UN (2015) 2 See Galbraith, 1958.
The rest of the paper is organized around 10 key facts about inequality in advanced economies: (i) inequality data remains scarce in the digital age; (ii) income inequality rose at different speeds since the 1980s, after a historical decline; (iii) nations have become richer, and governments poorer; (iv) capital is back, for a few; (v) the Great Recession did not halt the rise of inequality; (vi) global inequality is now more about class than nationality; (vii) higher inequality is associated with lower social mobility; (viii) gender and racial income inequalities declined in the 20th century but remain high; (ix) equal access to education, health and high-paid jobs lift pretax incomes at the bottom; (x) progressive taxation is key to curbing inequality at the top of the distribution.
1. Inequality data remains scarce in the digital age
Standard measures to track income and wealth inequality face serious comparability issues across countries and over time. Inequality data published by statistical institutions essentially rely on household surveys, which provide a rich source of socioeconomic data on individuals’ standard of living, informing on the various faces of socioeconomic inequalities (Alvaredo et al. 2018). However, surveys have well-known limitations when it comes to measuring inequality, particularly at the top end of the distribution (Atkinson and Bourguignon, 2000; Atkinson and Piketty, 2007). Surveys tend to misreport income and wealth levels at the top of the distribution3. In addition, income and wealth levels reported in household surveys generally do not add-up to National Account aggregates and to macroeconomic growth estimates. Changes in household survey concepts methodologies also make it particularly challenging to compare inequality levels across countries and over time, especially in the long run (UNECE, 2011)4.
3 Top income and wealth levels can are misreported because of sampling errors (the low sampling size of most
surveys affects the variance of estimates, which means they can vary a lot around their actual value and can create large biases when measuring top-end inequality) as well as non-sampling errors (individuals refusing to answer surveys or misreporting their incomes) See Blanchet, Flores and Morgan (2019).
4 The quality of survey data tends to be even lower emerging countries. In India and China, for instance, top 1%
income share in surveys is found to be at most half its true value (Piketty, Yang and Zucman, 2019; Chancel and Piketty, 2019). In Brazil, survey data shows a reduction of income inequality while tax data reveals it was stable overall (Appendix Figure 2). Systematic comparison of inequality levels therefore requires using additional information.
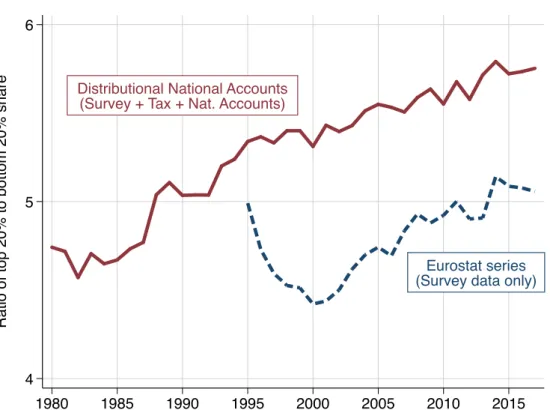
In Europe, where high quality tax and national accounts data is available, Blanchet, Chancel and Gethin (2019) find that annual pretax incomes of the top 1% of Europeans recorded in household surveys are about €220 000, 60% below their value of €340 000 meaured using tax data and national accounts. Official survey data therefore tends to underestimate actual inequality levels (Figure 1) and may fail to accurately inform on inequality trends. In the US, according to the Current Population Survey, the top 5% pretax income share rose by about a third between 1980 and 2014. Mobilizing tax data, national accounts and household surveys, Piketty, Saez and Zucman (2017) find that the top 5% income share rose by more than 50% over the period5.
Figure 1
Administrative tax data provides better estimates at the top of the distribution. The use of tax data to track income and wealth dynamics builds on the pioneering work of Simon Kuznets (1953) and Atkinson and Harrison (1978), who mobilized tax tabulations to monitor income and wealth dynamics at the top of the distribution. The 2000s witnessed a renewed interest in this methodology, with historical series produced for several high-income countries, starting with the US and France (Piketty, 2003; Piketty and Saez, 2003; Atkinson and Piketty, 2007; 2010). Thanks to the contributions of dozens of researchers located all over the world and collaborating with the World Top Incomes Database, top income shares series were produced for 70 countries and contributed to the flourishing global debate on inequality trends.
Top income share series based on fiscal data also have key limitations. Comparability between countries and time periods may also be an issue because of differences in national tax legislations.6 The definition of fiscal income often changes from one country to another and can be subject to policy changes. In the United States, about two thirds of capital income included in macroeconomic growth statistics is missing from income tax statistics. These income sources (which include imputed rents, undistributed profits and income paid to pensions and insurance) gained importance over the past two decades in the US and many rich countries (See
5 See Piketty, Saez Zucman, 2018 and CPS 2018. See also Appendix
6 For e.g., in some countries, individuals may have to file tax returns separately whereas in others, they file incomes
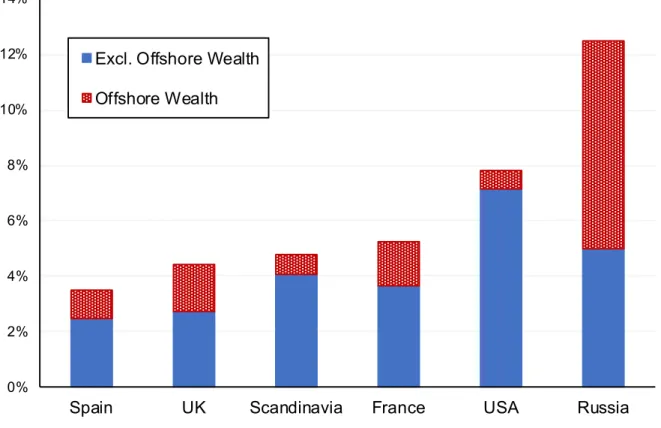
Appendix Figure 1).7 Tax data also has a relatively poor coverage of the bottom of the distribution. This is true in high-income countries but even more so in the emerging world.8 Finally, tax data is known to suffer from evasion practices - at a varying degree across nations depending on norms, political systems and tax policies. In Russia, the top 0.01% wealth share recorded without tax evasion is 5%, but it turns out to be higher than 12% when offshore assets are (at least partly) taken into account; in the UK, the figure rises from less than 3% to 4.5%, in France from 3.5% to 5.5% (Figure 2) (Alstadsæter, Johannesen and Zucman, 2018).
Figure 2
The Distributional National Accounts methodology (DINA, see Alvaredo et al. 2016), seeks to distribute the totality of national income and wealth in a coherent conceptual framework to address the limitations of existing inequality data sources. The production of DINA estimates is based on the systematic combination of tax, survey and national accounts – and to the extent possible of tax evasion data (see Zucman, 2016; 2019). This methodology has been applied to a series of high-income countries (see for instance Piketty, Saez and Zucman 2018; Garbinti, Goupille and Piketty 2018; Blanchet, Chancel and Gethin, 2019) as well as to emerging countries (see Alvaredo et al. 2018),9 providing novel comparable results on global income and wealth inequality dynamics.
Despite recent progress in inequality measurement, inequality data remains particularly scarce. In certain countries (such as in Sweden, for instance), household surveys are matched with administrative tax registers, making it possible to track inequality from the bottom to the top of the distribution with a relatively high level of precision. This situation however remains the exception rather than the norm in the
7 i.e. profits retained by corporation rather than, for e.g., being cashed as dividends. Recent work has found that
the choice to keep profits within a company largely depends on tax incentives (Alstadseater et al., 2017). Failing to include them in inequality estimates thus makes top income shares artificially volatile. Undistributed profits are included in national income growth statistics and correspond to the net primary income of corporations. For studies focusing on the impact of undistributed profits on inequality, see Wolfson, Veall, and Brooks (2016) for Canada and Blanchet, Chancel and Gethin (2019) for Europe.
8 In India for instance, only about 8% of the total adult population files income tax receipts (a value close to those
observed in Western Europe and the US in the interwar period).
9 The World Top Income Database was subsumed into the World Inequality Database in 2017 to reflect this new
ambition. It now regroups more than 100 researchers and is constantly updated thanks to new releases of income or wealth tax or survey data.
world of official inequality statistics10. The revision of the system of national accounts, expected for 2022-24, currently being discussed under the auspices of the UN Statistical Commission and at the OECD, is expected to incorporate new guidelines to distribute economic growth, in line with the recommendations of the Stiglitz, Sen Fitoussi Commission (2009). This could accelerate the standardization of methods reconciling microeconomic and macroeconomic datasets. It is too early to know, however, what can be expected from this revision.
2. Income inequality rose at different speeds since the 1980s, after a
historical decline
The systematic combination of survey, tax and national accounts data shows that income inequality has been rising since the 1980s in most advanced economies, after a historical decline in the 20th century. The richest 1% of Western
Europeans and North Americans captured around 17-20% of national income in the early 20th century. This value decreased to 8% in the 1970-80s before returning to 10.5-20% in the late 2010s (Figure 3). Other advanced economies (Australia, New Zealand, Japan), followed broadly similar trajectories (Appendix Figure 3). In Australia and New Zealand, top 1% income shares decreased from 10-12% in the early 20th century to around 5% in the late 1970s and rising back to nearly 10% in the 2010s. In Japan, early 20th century top 1% income share levels were close to that of Europe and the US at the time. Top incomes dropped to less than 8% after World War II (WWII) before returning to close to 10% in the recent period.
Figure 3
The historical decline of inequality in advanced economies in the mid 20th
century was mainly driven by the fall of capital incomes. The role of the two World Wars, of the 1929 crisis and of decolonization processes in the reduction of top capital incomes via capital losses and the destruction of physical capital, has been amply discussed (see Piketty, 2014; Piketty and Saez, 2014; Alvaredo et al., 2018). While
10 The recent suppression of the wealth tax in France led to the destruction of the administrative apparatus to track
wealth dynamics at the top of the distribution. More precisely, the tax was replaced by a tax on real estate. At the top of the distribution, about 80-90% of net wealth takes the form of financial wealth, rather than real estate (Garbintin, Goupille, Piketty, 2018).
military and economic shocks strongly and durably impacted inequality in high-income countries, the importance of peacetime policies implemented in the interwar period and in the aftermath of WWII should not be underestimated: high tax progressivity, nationalizations and capital control policies (rent control, lease regulations, limitation of shareholders’ rights in governance boards) also affected income dynamics at the top of the distribution.11 At the bottom of the distribution, sustained investments in education and the rise of social transfers in the 1950s-1980s contributed to lift income growth.12
Large emerging countries followed inequality trajectories that were broadly similar to those of advanced economies across the 20th century. Available
historical data for India and Russia shows that inequality strongly declined in the first half of the 20th century. Top 1% income shares dropped from around 20% in these countries a century ago to around 5-7% in the late 1970s (Alvaredo et al., 2018). In India and Russia, inequality rose back to its early 20th century levels after the 1980s. Since the 1980s, China followed a median path, with its top 1% income share rising from 7% in the 1980s to around 15% in the recent period. Despite radically different political, economic and social systems, advanced economies and former communist (or highly regulated) countries also went through an inequality reduction phase, followed by a marked increased at different speeds.
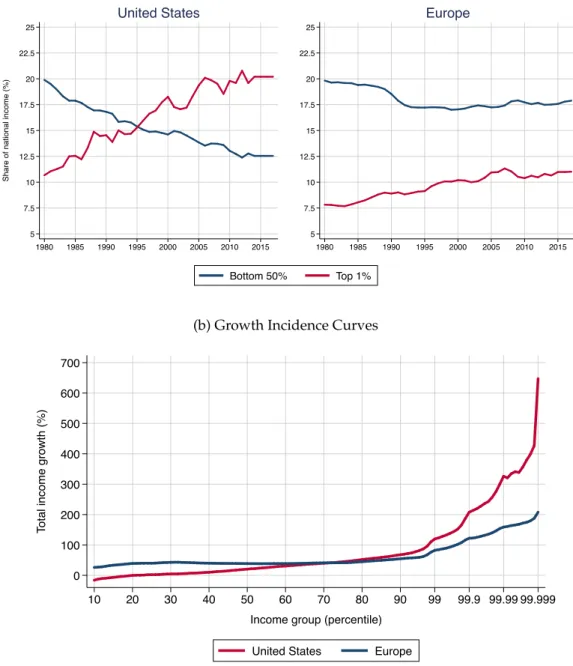
Since 1980, growth dynamics at the bottom of the distribution diverged in Europe and the US. Between 1980 and 2017, the bottom 50% income share in the US collapsed (from 20% to 12.5%) (Figure 4). The top 1% income share followed an almost exactly inverse trajectory (rising from near 10% in 1980 to over 20% in 2017). In Europe, the top 1% income share rose much less rapidly13 and the bottom 50% share was reduced, but maintained at a relatively high level (from 20% to 17.5% in the late 1980s and was stabilized at this level afterwards). Over the period, income of the poorest 50% of Europeans rose by 40%, while the bottom 50% of the US distribution was de facto shut off from economic growth (with just 3% overall income growth over 11 Between 1930 and 1980m the average top income tax rate in the US, Western Europe and Japan were around
70%-80%, see also section 8.
12 See also Lindert, 2003 and Piketty, 2019.
13 The top 1% income share of Europeans rose from 7.5% to around 11%. Focusing on Western Europe only barely
modifies this result. The US per adult pretax income Gini increased from from 0.46 in 1980 to 0.6 in 2016. In Western Europe, it increased from 0.37 to 0.43 over the same period. To fix ideas, the global income Gini fluctuated around 0.65 since 1980.
a near fourty-year time span).14 At the very top of the distribution, incomes skyrocketed in the US: the top 0.001% in the US grew by 650% between 1980 and 2016. In Europe incomes of the same group grew by 200% (Piketty et al. 2019; Blanchet et al., 2019). The rise of inequality in rich countries is not driven by population ageing: focusing on working-age individuals only, it is found that growth was actually negative for the bottom 50% of Americans since 1980.]15
Figure 4
Diverging inequality and growth trajectories in the EU and the US suggest that policies and institutional changes played a key role in these evolutions. Western Europe and the US are broadly comparable regions in terms of population, exposure to trade with low income countries and technological development levels. While trade and technology are likely to explain common inequality trends observed in these regions, the divergence observed between Europe and the US largely owe to different policy choices and institutional changes – as we discuss 9 and 10.
3. Rich countries have become richer but their governments have
become poor
A basic way to think about the dynamics of wealth inequality is to focus on the decomposition of net national wealth into net private wealth (all assets, net of debts detained by private actors) and public wealth (net assets detained by governments). Why does such a decomposition matter for inequality analysis? Similar levels of wealth concentration between individuals do not have the same meaning in a country where private wealth-income ratios are relatively low (e.g. the UK in the early 1980s) and where they are high (e.g. the UK today)16. In Norway, where public wealth
14 This figure includes 38 European countries, see Blanchet, Chancel Gethin (2019) for more detailed tables. Bottom
50% incomes growth rates for EU-15 countries over the period are very close to that of Bottom 50% for all European countries (38% vs. 40% respectively).
15 Rising inequality does not result from changing family structures either. Series are expressed on per-adult basis,
with equal split among spouses. See Piketty, Saez and Zucman (2018)
16 Indeed, private and public wealth ownership can have different social and political meanings. Equity ownership
in Germany (where workers have 50% of seats reserved in corporate governance bodies) entails different forms of voting power as in the US (where there is no such reservation rule). Public wealth ownership can also have radically different meanings depending on the political system looked at. The study of the dynamics of public and private wealth ownership must therefore be accompanied with in-depth studies into transformations of property rights and political systems (see for e.g. Alvaredo et. al., 2018 and Piketty, 2019). The very notions of private property and public property can have very different meanings depending on the country or the period considered. The study of
ownership is high, the private wealth inequality is partly counterbalanced by a more egalitarian distribution of public wealth ownership. In the longer run, low (or negative) public wealth levels also tend to be associated with lesser room for governments to invest in public goods that matter for inclusive and sustainable growth (e.g. education, health or climate protection), whereas higher private wealth levels also tend to be associated with higher wealth inequality between individuals, due to the cumulative and multiplicative nature of wealth accumulation processes.
A key fact about wealth in advanced economies in the 21st century is that capital
is back, after it collapsed during the 20th century (Piketty and Zucman, 2014). In
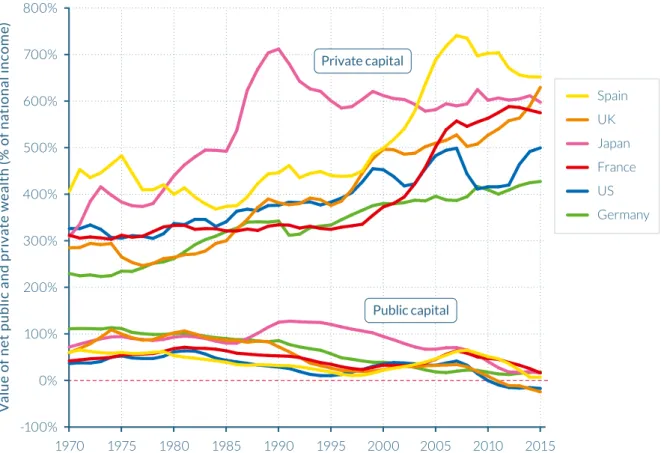
order track the evolution of wealth over long time spans, it is useful to report the evolution of aggregate wealth as a share of national income. National wealth-income ratios (the sum of net private and net public wealth) amounted to 500-700% in the early 20th century in rich countries. They fell to 200-350% after WWII and stabilized around 400% until the early 1980s, before returning to 400-600% (with significant country variations) in the recent period. The decline of national wealth in the 20th century echoes the dynamics of income inequality: the military shocks of the two World Wars, the loss of assets by wealth owners in rich countries, due to the decolonization process and the capital control policies of the interwar and post-WII period contributed to deflate wealth income ratios in the long-run.
Figure 5
Another important finding about aggregate wealth dynamics is that capital is back because private wealth is back. Private wealth income ratios were around 200-300% in the late 1970s and have risen to 400-600% in the recent period. On the opposite, public wealth income ratios have declined, from 50-100% of national income to nearly 0% in most advanced economies (see Figure 5). Some countries (including the US and the UK) now have negative public wealth positions. The secular decline of public wealth was driven by the rise of public debt and the sale of public assets, in particular in infrastructures. A few rich countries followed a different path, suggesting
private and public wealth must be grounded in a deeper understanding of the countries' institutions and how these affect political and social inequality, as well. See Alvaredo et al. (2018) and Piketty (2019) for a longer discussion.
the trend at least partly owes to policy choices. The comparison with emerging countries is also enlightening in that respect: while Russian governments after the fall of the USSR decided to privatize most of its economy, leading to the collapse of the country’s public wealth, China’s net public wealth position was maintained at relatively high levels since the late 1970s.17
Negative public wealth implies that total public debt is superior to the total value of public assets (e.g. schools, roads, hospitals, etc.). In other words, the owners of public debt (essentially detained by nationals in rich countries)18 possess, via their financial assets, the totality of public infrastructures and financial assets in their country. In practice, such a situation also arguably tends to give private owners of public debt more political leverage to influence fiscal and budgetary policies. To summarize, low and negative public wealth positions may limit both politically and financially governments’ ability to invest in policies that help reduce inequalities.
4. Capital is back, for a few
The return of private wealth since the 1980s has been accompanied by a return of high wealth concentration in rich countries (Alvaredo et al., 2018; Zucman, 2019). While the return to high private wealth-income ratios could in principle be seen as a positive development (suggesting that there is more capital per worker, and hence that workers are more productive), it has been associated with a rise of wealth inequality between individuals rather than in increased capital ownership at the bottom of the distribution.19
In the US, wealth concentration is now close to levels observed during the Gilded Age. The top 1% wealth share culminated at around 45% during the Gilded Age and fell after the 1930s and 1940s, due to the drastic policy changes that were part of the
17 Public wealth in Russia was around 300% of national income in 1990 and is now less than 100% today. The
public wealth income ratio in China oscillated around 220-250% since 1978. See Alvaredo et al. (section 3).
18 Net foreign wealth position of Japan, Europe and the US is positive, implying that wealth owners in these countries
detain more abroad than foreign wealth owners detain at home. See Alvaredo et al. 2018 (section 3) and Piketty (2019).
19 Capital ownership of the bottom 50% of Americans is lower today than in the 1980s. In France, bottom 50%
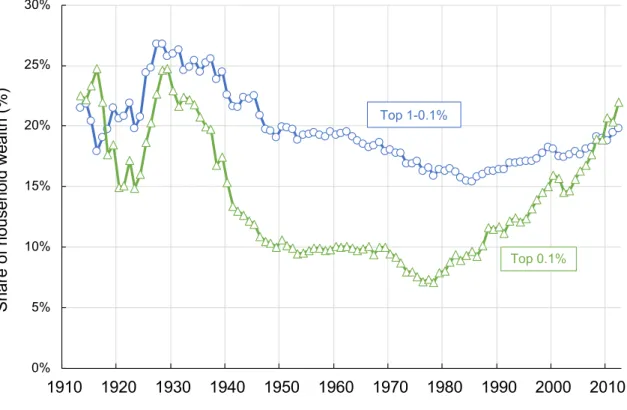
New Deal20. By the late 1970s, the top 1% wealth share had progressively dropped to about 25%. The top 1% wealth share rose back to 40% (Figure 6) in the recent period. One particularly striking fact: in the US, the rise has been almost entirely driven by the top 0.1% of the distribution - whose wealth share grew from 7% in 1979 to around 20% today (Saez and Zucman, 2016) (Figure 7).
Figure 6
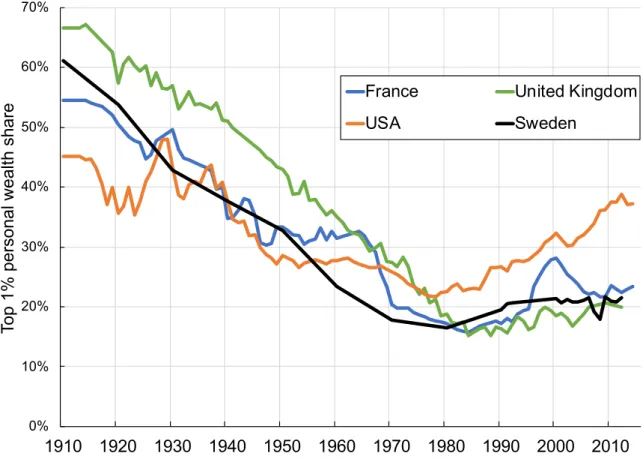
Western European countries experienced a larger decline of wealth inequality throughout the 20th century than the US, and a slower increase since the 1980s.
Top 1% wealth shares in France and the UK culminated around 55-70% of national wealth in the early 20th century – levels significantly higher than in the US at the time. Interestingly enough, despite the French Revolution and the self-proclaimed meritocratic Third Republic, wealth concentration remained extremely high in the country up middle of the 20th century - as it did in the UK (Piketty, 2014). Under the combined effects of military, policy and economic shocks, the top 1% wealth share fell to around 15% in France and the UK by the late 1970s. Since the 1980s, wealth rose at relatively slow pace: the top 1% is now around 20-22% in France and the UK. Sweden followed a broadly similar trajectory. One of the key developments of wealth inequality in the 20th century is the apparition and persistence of a patrimonial middle class in Europe, which did not exist before.
Portfolio composition plays an important role in explaining diverging wealth inequality dynamics across countries. In France and the UK, the rise in the value of real estate is likely to have tempered the rise of wealth inequality at the very top of the distribution. Indeed, the wealth middle class is characterized by a dominant share of housing in its total wealth – contrary to top wealth groups who essentially possess financial wealth (see Appendix Figure 4 for the case of France).21
Figure 7
20 The development of progressive income and estate taxation made it much more difficult to accumulate and pass
on large fortunes and financial regulation sharply limited the role of finance and the ability to concentrate wealth.
21 Rising housing prices have ambiguous and contradictory effects on overall wealth inequality. On the one hand,
high housing prices can mitigate rising inequality between the middle and the top, but on the other hand high housing prices make it for difficult for the poorer groups to access real estate property to begin with.
In the long-run, wealth concentration is determined by the inequality of rates of return on wealth (r) and the growth rate of average income (g) as well as by the inequality of savings rates (s)22. Rates of return available for large financial portfolios
usually have little do with those open to small deposits. Between 1987 and 2017, the wealth of Forbes’ 500 Europeans and North Americans grew at an average annual rate of 8.9% - significantly faster than the average wealth growth rate (2.7%). In comparison, average incomes grew at 1% per year on average (See Table 1).
Table 1
Changes in savings rates among wealth groups played a large role in the collapse of the bottom 90% wealth share. In the United States, the savings rate of the top 1% and the next 9% were the same in the 1960-70s at around 30%. The top 1% savings rate is however near 35% today, stable since the 1990s. The savings rate of the next 9% dropped to 15% over the period and it collapsed from around 10% in the 1980s to 0% today for the bottom 90% of the population. With a constant savings rate for the poorest 90% of the population (i.e. 3%), Saez and Zucman (2016) show that the bottom 90% wealth share would have been roughly stable between the mid-1990s and the early 2010s.
In Europe and France in particular, rising savings rate inequality between groups also contributed to the increase in wealth concentration (Garbinti, Goupille, Piketty and 2018). The rise in wealth inequality in Europe has been slower than in the US but simple simulations show that the continuation of current inequality of savings rates and of rates of return will gradually bring wealth concentration levels back to the values observed in the nineteenth and early twentieth centuries (see Appendix Figure 5). Slight changes the inequality of savings and of rates of return can have long lasting consequences on wealth accumulation and concentration.
22Under fairly general conditions, it is possible to show that the top tail of the distribution of wealth converges towards
a Pareto distribution, and that the Pareto coefficient (a measure of the inequality of the distribution) is a function of r-g (Atkinson and Harrison, 1978; Atkinson, Piketty and Saez, 2011). Intuitively, the higher the gap between growth and the rate of return on capital, implies that past wealth is capitalized at a faster pace, and that it is less likely to be overtaken by the general growth of the economy. This effect is reinforced by the fact that rates of returns increase with the level of wealth.
5. The Great recession did not halt the rise of inequality in most
high-income countries
The 2008 financial crisis was immediately followed by a drop in top income and wealth shares in most high-income countries and by several policy initiatives seeking to embed financial markets in tougher regulatory frameworks23. Did the
Great Recession and the subsequent policy responses alter the long-run trend in inequality? Evidence from ten years of data provides little support for this view. First, the secular rise of private wealth in high-income countries seems to have been broadly unaffected by the financial crisis. Private wealth dropped at varying degrees in the aftermath of the financial crisis in rich countries (Figure 6). The drop was particularly strong in the US (private wealth decline by about 90% of national income) and more moderate in the UK and France (10-20%). Private wealth however recovered relatively rapidly in these countries. In a similar way, the real asset booms and bust observed in Japan (1985-1995) and Spain (2000-2010s) do not seem to have impacted the long run rise in wealth-income ratios either, suggesting a strong structural element to the rise of private wealth, beyond cyclical fluctuations.
Wealth inequality between individuals was impacted by the financial crisis, but the long-term trend seems broadly unchanged. In the US, the trend in rising wealth share was not affected by the financial crisis, nor by subsequent policy responses. In 2014, total net wealth of the top 1% was 10% above its 2006 value and 20% above its 2000 value, whereas the bottom 99% still hasn’t recovered its pre-crisis wealth levels (See Figure 8 and Appendix Figure 6).24 In France, the secular rise of the top 1% wealth share does not seem to have been significantly affected by the crisis either. The gap between the bottom 99% and the top 1% actually widened since before the financial crisis. Wealth inequality dynamics since the crisis in the UK followed as similar pattern as well. In Spain, where the destruction of wealth was particularly strong after the housing bubble bust, top wealth groups were left relatively unaffected, as they were 23 See for instance the Basel agreements initiated by the G10 in 2008 or the US Dodd-Frank Act.
24 The strong wealth destruction that followed the recession left the middle 40% wealth group with as much wealth
as in 2001. The wealth of the bottom 50% household was still negative in 2014. At the other end of the distribution, after a drop in stock market prices during the crisis, the top 1% recovered promptly (See Saez and Zucman, 2016 and WID.world, 2019). As a result, the top 1% share rose quite steadily from 23% in 1980 to nearly 39% today in the US.
able to shift their investment portfolios from real estate to financial assets at the right time (Toledano, 2017). To summarize: focusing on wealth inequality for countries with sufficiently good quality data at the very top of the distribution, there is no clear evidence that the crisis altered the secular rise in wealth concentration or reduced pre-crisis concentration levels. What seems particularly striking instead is the ability of top wealth groups to rapidly recover and continue to accumulate wealth at faster rates than the rest of the population.
Income inequality trends since the financial crisis offer a more nuanced picture, but there is no clear sign of a new normal. In Germany and France, top income shares have slightly declined from their pre-crisis level and top incomes still have not recovered from their 2008 values (See Appendix Figure 7)25. In Italy, Japan, Australia, New Zealand, top shares have been broadly stable since 2007. In the UK, the top 1% income share significantly dropped during the crisis but has recovered since then. In the US and Spain, top 1% income shares have more than recovered from their precrisis values. In Northern Europe (Denmark and Sweden in particular) income shares and levels of the top 1% are today significantly higher than before the crisis (Appendix Figure 8).
Figure 8
6.
Global inequality is now more about class than nationality
The rise of income inequality in high-income countries as well as in large emerging economies, combined with the reduction of average income inequalities between countries changed the nature of inequality between global citizens. Thanks to novel Distributional National Accounts data, it is possible to build on earlier estimates (in particular Lakner and Milanovic, 2015) and measure more accurately than before the distribution of global growth over the past decades, as well as the relative importance of between-country and within-country inequality.
The distribution of global growth has been highly skewed since 1980. While incomes grew rapidly but unevenly at the bottom of the global income
25 Income growth is measured without capital gains. Including capital gains in the concept of income would amplify
distribution, incomes of top global earners rose even faster. At the middle of the distribution, bottom 90% income groups in rich countries benefitted from much slower growth rates. Incomes among the top 1% grew by more than 100% (1.9% per year) and by more than 200% at the top 0.001% (3% per year), over the 1980-2018 period. Such growth rates contrast with the sluggish income growth of the bottom 90% of the population in rich countries (below 50% over the past four decades) (See Appendix Figure 9A).
Novel results show that the Theil index of pretax per adult national income inequality accounted for slightly more than half of global inequality in the early 1980s and only about a quarter today (see Figure 9). Put differently, nationality mattered more than class in the early 1980s, but the situation was reversed with the rise of within-country inequalities. Today, in order to predict the position of an adult in the global distribution of income, it is more useful to know her income group rather than her nationality. This finding may have important implications for global inequality policy debates on the relative importance of migration, between-country transfers and national-level inequality policies (see also Chancel, 2019; Milanovic, 2019).
Figure 9
These results about the relative importance of within-country inequality at the global level confirm the trend observed in earlier work but provide novel insights with respect to the level of within-country inequality today, higher than previously measured. According to Lakner and Milanovic (2015), the global within-country Theil increased over the past decades, but between-country inequality remained more important in 2011 than within-country inequality. The use of new datasets of national level inequality, with more granularity than earlier studies thanks to the mobilization of tax data account for a large part of the difference in results. Novel results also rely on one single concept (pretax national income per adult) while previous studies relied on a mixture of income and consumption distributions per capita in previous studies.26
26 The use of adults as the support of the distribution in our results also differ with earlier work, where consumption
and income were distributed to all individuals. Simulations however show that this difference is unlikely to explain a large share of the divergence with previous estimates.
Despite persistent income inequalities between countries, income distributions of rich countries are now spread across the global inequality spectrum. For instance, in 1980, the bottom 20% of the distribution in Germany and in the US stood between the 60th-80th percentiles of the global income distribution. In Germany, the bottom two deciles now belong to the 50th-70th percentiles of the global distribution, whereas the bottom 20% in the US belong to the 30th-50th global percentiles (See Appendix Figure 9B). In other words, there are now global poor in rich countries.
7. Higher inequality is associated with lower mobility rates
Has the rise of inequality in most high-income countries since the early 1980s been counterbalanced by an increase in social mobility? Broadly speaking, there are two ways to think about mobility: mobility across generations (intergenerational mobility) and mobility during individuals’ lifetime (intragenerational mobility).27 Recent evidence suggests that higher inequality is associated with lower intergenerational mobility rates and that increases in snapshot inequality measures are associated with the rise of intragenerational inequality.
Countries with higher inequality at a given point of time tend to have lower intergenerational mobility rates. Among rich countries, those which record low levels of income inequality (eg. Scandinavian countries, with a top 10% income share around 25-30%) tend to have relatively high levels of mobility (the intergenerational earnings elasticity28 in these countries is low, around 0.15-0.2). Countries with moderate income inequality (eg. France or Germany, with top 10% income share around 30-35%) have moderate mobility levels (intergenerational earnings elasticity of 0.3-0.4) and countries with high income inequality (e.g. the US, with a top 10% income share around 45%) have a relatively high intergenerational earnings elasticity (around 0.5) (Corak, 2013; Solon 2002). This relationship, dubbed the “Great Gatsby curve”,29 reveals that high income inequality countries do not “compensate” for higher intergenerational mobility rates.
27 See also, for e.g., Burkhauser, Nolan and Couch (2011).
28 The intergenerational elasticity is the elasticity of parental income on the income of their children at adulthood
(see Corak, 2013).
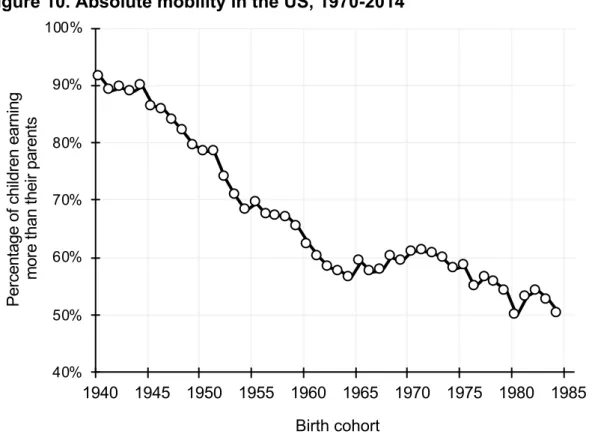
Absolute intergenerational mobility has worsened, rather than increased in the US over the past decades. Among intergenerational mobility measures, it is useful to distinguish between relative intergenerational mobility (measured for instance by the correlation between parents’ and children’s earnings or education) and absolute intergenerational mobility (measured for instance by the share of children earning more or reaching higher educational degrees than their parents). Chetty et al (2014) find that relative intergenerational mobility in the US was stable over the past decades, at low levels. The probability of a child born in the bottom 20%of the income distribution to reach the top 20% is only 10%, whereas the probability of a child born in the top 20% to remain in the top 20% is three times higher. While relative mobility stagnated over the past two decades, absolute mobility decreased in the past three decades and even more so since the 1940s. Chetty et al (2017) find that the percentage of children earning more than their parents fell from about 90% in the 1940s to around 50% today (Figure 10). Absolute mobility rates declined among all income groups but the middle class was hit hardest. Absolute mobility declined while relative mobility was stable because a large fraction of Americans were shut off from economic growth since the 1980s. This implies that higher average growth rates, keeping the distribution of growth unchanged in the US, would be insufficient to return to absolute mobility rates observed in the 1940-60s.
Figure 10
Available evidence suggests that intergenerational educational mobility declined in the US over the past decades, while it remained broadly stable over time in Europe since the 1980s. Comparable data on intergenerational income mobility across countries and over time remains particularly scarce. There is relatively more data on intergenerational mobility measured in terms of educational attainment, which offer an imperfect but useful proxy of intergenerational income mobility. In the UK, France, Germany or Spain, available data suggests that educational mobility increased for students born in the 1940-1960s and remained broadly stable for students born afterwards (GDIM, 2018). In the US, Japan, Sweden and Norway, absolute educational mobility declined since the 1960s. Such results provide additional evidence that rising income inequality in high-income countries since the 1980s does not seem to have been compensated by a rise in intergenerational mobility.
Intragenerational inequalities have risen in line with standard measures of inequality. Measures of the inequality of life cycle incomes reveal that the dynamics of inequality and earnings measured at a given point of time provide a relatively good picture of lifetime’s earnings inequality. In the US, Kopczuk, Saez and Song (2010) find that all of the increase in the inequality of earnings is due to an increase in the inequality of lifetime earnings. Focusing on 24 OECD countries, Garnero et al. (2019) reach a similar conclusion. Inequality measures at a given point of time thus provide a good approximation of lifecycle measures of inequality. It has been argued that countries with high inequality levels had relatively higher intragenerational mobility rates, but this assertion received only mixed empirical support.30
Measures of intragenerational mobility have been broadly stable since the early to mid-1970s but mask heterogenous trajectories among men and women. Lifetime mobility among males actually worsened since the mid-1970s in the US (and even more so since the 1950s). On the contrary, lifetime mobility of women dramatically increased since the 1970s (and even more so since the 1950s), driven by the rise of females in the workforce and the secular reduction of the gender pay gap (Kopczuk et al., 2010) – as we discuss in the next section.
8. Gender and racial income inequalities were reduced in the 20
thcentury but remain high
The share of women in the employed population in rich countries has risen over the past decades. In Canada, France, Germany, the UK and the US, the share of women in the workforce is over 46% in the late 2010s. This share has been rising since the 1990s (See Figure 11) and even more so since the 1950s. The secular rise of female participation in the second half of the 20th century has contributed to a significant reduction in income inequalities between men and women – and has tended to temper the increase of income inequality across the entire population. The pay gap between female workers and male workers has also been reduced since the 1980s (Kleven et al. 2018). The median earnings of full-time workers in the US and the UK
30 See for instance Flinn, 2002 and Garnero et al, 2019., who find that more unequal countries tend to have higher
intragenerational mobility rates and Burkhauser et al. (2002) as well as Gottschalk and Spoalore (2002) who find the opposite.
decreased from 35% to around 20% between 1980 and 2015, and from 20% to 15% in Denmark.
Figure 11
The total income gap between males and females was only moderately reduced since the 1980s. Thanks to rising labor participation rates and a reduction in the earnings gap in the US, the male to female pretax income ratio was reduced from over 350% in the 1960s to 250-200% in the 1980s. Since the 1980s, progress has been much slower: the ratio was still close to 180% in 2014 in the US (Piketty, Saez and Zucman, 2018) (See Figure 12). The ratio of male to female earnings for full-time workers decreased from around 170% in 1980 to 130% in 2014, revealing the persistence of both composition effects and “pure” pay discrimination effects.31 Gender differences in occupations and industries are found to account for about half of the gender pay gap among full-time workers in the US (Blau and Kahn, 2016).
Figure 12
Women remain strikingly underrepresented among top income and wealth groups. Only about a quarter of top 10% earners are women in the US (Piketty et al. 2018) and the representation gap increases the further one goes up the income distribution. Among the top 0.1%, only 10% of individuals are females (see Appendix Figure 10). Similar values are found in France and other European countries including Norway, Italy and Denmark (Atkinson et al., 2018). In France, it will take about a hundred years to reach parity among top income groups at current trends (Garbinti, Goupille and Piketty, 2018) (Figure 13).
Figure 13
Turning to racial wealth inequalities, evidence shows that they have decreased in the second half of the 20th century in the US. The White-Black earnings ratio in
the US (measured by the average earnings of Whites divided by that of Blacks) was of
250% in the 1960s. This value decreased to around 130% in the 1980s, in part due to the extension of the minimum wage to several sectors of the US in 1966 (Derenoncourt, and Montialoux, 2018). Since the 1980s, the earnings gap has shown no sign of further reduction. The total income gap between Whites and Blacks has also been stable since the 1990s, at around 200% (Wolff, 2017). Discrimination at the entry of the labor market tend to perpetuate such inequality income inequality levels in the US (Bertrand and Mullainathan, 2005).
The racial wealth gap in the US has widened over the past decade. The racial wealth gap32 was around 500-600% in the 1980-1990s and rose over 700% in the recent period (Wolff, 2017) (Appendix Figure 11). The rise in the racial wealth gap is not only driven by a surge of wealth inequality levels at the top of the distribution: it dramatically increased between median Black and median White households as well33.
Evidence points towards persistent racial inequalities in other high-income immigration countries, but data is scarce. In the UK, the earnings ratio between South Asian and Whites is found to be broadly stable over the 2012-2018 period, at around 120% (ONS, 2019). Official inequality data on race is still missing in many rich countries, such as France, Germany or Italy, due to administrative regulations. Discriminations in the job market are nevertheless found to be large in a country like France, with evidence of a strong racial and religious bias in the labor market. Candidates with Muslim names have four times less chances to be selected for an interview than candidates with non-Muslim names, for the exact same level of qualifications. Having the best qualifications and diplomas does not increase selection chances for men with Muslim men (Valfort, 2018).
9. Equal access to education, health and high-paid jobs are key to lift
pretax income at the bottom of the distribution
32 The wealth gap is measured by the average wealth of White households divided by the wealth of Black
households. Values exclude consumer durable goods such as cars, see Wolff, 2017 for a description of the composition of wealth.
33 Median net wealth for White households in the US rose from about $110 000 in 1983 to nearly $150 000 in 2016,
The various inequality trends discussed in this paper reveal that there are different dimensions to inequality depending on which income or wealth groups are looked at. This has implications on how to frame inequality policy debates: there is no silver bullet to tackle inequality but different policy tools, each impacting growth among the bottom 50%, middle 40%, top 10% and top 1% differently. In this section and the next, we succinctly review some standard explanations for the rise of inequality at the top and at the bottom of the distribution.
One of the standard explanations for the rise of inequality in rich countries has been the impacts of technological change and openness. The evolution of technology and increasing trade with low-income countries is said to have increased the relative productivity of skilled labor relative to unskilled labor in rich countries, thereby increasing the demand - and hence relative pay - for skilled workers. This purely technological line of explanation has several limitations. First, rising income inequality is a broad-ranging phenomenon which also involves capital income and wealth dynamics, and not only the distribution of labor income. Second, the supply of skilled labor is determined by education, which depends on policy. That is, the expansion of education leads to a rise in the supply of skills, while technological change and globalization may increase the demand for skills in rich countries. Depending on which process occurs faster, the inequality of labor income will either fall or rise. This idea has been described as the race between education and technology (Goldin and Katz, 2009).
While trade and technology are likely to explain part of the general rise in inequality observed in rich countries, these drivers largely fail to explain the variations in growth trajectories at the top or at the bottom of the distribution. Western Europe and the US had relatively similar penetration rates of goods from low-income and emerging countries over the past decades (Figure 14), as well as relatively similar levels of technological change34, but followed radically diverging pretax (and posttax) inequality pathways.
34 Penetration of IT products or measures of industrial robots appear to be uncorrelated with the dynamics of
inequality in rich countries. In most industrial sectors, robot penetration is lower in the US than in Western European countries (see Acemogly and Restrepo, 2017).
Figure 14
At the bottom of the distribution, different choices in terms of educational and health systems or labor market policies can have significant impacts on pretax incomes. Focusing on pretax incomes, bottom 50% Western Europeans were slightly poorer than bottom 50% in the US in 1980 and are now around 25% richer than their US counterpart35. Measured at posttax incomes, bottom 50% Western Europeans were 12% poorer than bottom 50% in the US, and are 3% richer today. The comparison of pretax and postax trends reveals that Europe has lower inequality levels than the US, and managed to trigger more growth at the bottom not mainly because of the mechanical effect of the tax and transfer system, but largely thanks to policies and institutional settings which determine pretax incomes (Figure 15).
Figure 15
Different definitions of pretax and posttax incomes can generate confusion when debating about redistribution. A number of publications on redistribution compare inequality measured at market incomes to inequality levels measured at disposable incomes. Such analyses find that European countries’ low inequality levels are essentially due to European countries’ tax and transfer system.36 This interpretation calls for caution. Indeed, in countries with public pension systems (i.e. most continental European countries), market incomes are zero for pensioners whereas this is not the case in countries with private pension systems, such as the US. Inequality measured at market incomes is thus by definition very large in most European countries – but this fact simply reflects a different choice in the organization of the pension system, rather than it informs about differences in market inequalities across countries. In order to net out the effect of the pension system, it is useful to either limit the analysis to the working age population or to define pretax incomes as
35 When measured with posttax incomes, Western Europeans were 12% poorer in 1980 and are 2% richer today. 36 This is the approach typically followed by the OECD publications on redistribution.
incomes before the operation of the tax and transfer system but after the operation of the pension system.37
Posttax income inequality is primarily determined by pretax inequality levels among rich countries. The most equal countries (Scandinavian countries) have lower inequality levels both before and after the operation of the tax and transfer system. Cash redistribution can however have a significant impact on inequality: Western European countries such as Germany or France are more unequal than Eastern European countries before taxes and transfers, but have more redistributive tax and transfer systems: posttax inequality is lower in Western European countries than in Eastern Europe countries (Blanchet, Chancel and Gethin, 2019) (Appendix Figure 12). Inequality differences in access to higher education and training are likely to have played an important role in bottom 50% pretax income growth differentials across rich countries. Access to higher education remains notably unequal in the US. Chetty et al. (2014) show that children whose parents are within the bottom 10% income earners, only have a 30% probability to attend college, while those whose parents are within the top 10% earners have a 90% probability38 (Figure 16). The probability gap is even starker for Ivy League colleges, as children whose parents belong to the top 1% of the income distribution have seventy-seven times more chances to attend an Ivy League college as children of the bottom quintile (Chetty et al., 2017). Available evidence suggests that the influence of parental background in educational outcomes is lower in Europe than in the US and also relatively well correlated with pretax income inequality levels within European countries (Causa and Chapuis, 2009).
Figure 16
Universal access to higher education systems tends to be associated with lower educational inequalities (Oliveira Martins et al., 2010). In the US, the share of private expenditure on tertiary educational institutions is over to 65%, this value is
37 In this paper, pretax incomes are defined as incomes before taxes and transfers but after the operation of the
pension and unemployment insurance system (see Alvaredo et al., 2016 as well as Piketty, Saez and Zucman, 2018).
around 60% in other Ango-Saxon countries, 30% in France, Spain or Italy and as low as 8% in Germany and Scandinavian countries (Piketty, 2019). Recent research points towards strong positive impacts of highly subsidized higher education on intergenerational mobility and college attendance in the US (Chetty et al. 2017).39
Differences in the organization of health systems across countries are also likely to explain differences in pretax income growth outcomes at the bottom of the distribution. Case and Deaton (2015) show that, after a historical decline, morbidity rates among white men have increased in the US since the late 1990s, contrary to other high-income countries. Chetty et al. (2017) find that there is a 14 years life expectancy gap between top and bottom 1% males in the US, and that this gap has widened since 2001. In return, poor health is associated with reduced capabilities for the worse-off, as well as lower incomes and mobility chances (Marmot, 2003; Case, Lubotsky and Paxson, 2002), fueling a broader cycle of social inequality and low pretax income growth at the bottom of the distribution. One of the most salient difference between US and Western European health systems is that the latter are characterized by public universal access, which tend to limit inequalities in access to health.
In the US, health transfers (Medicare and Medicaid) account for the most part of the little posttax income growth of the bottom 50% of the population since 1980 (Piketty et al., 2018). However, it is likely that an important share of these transfers just matched the increase in the price of health services rather than enabled an increase in the quality or amount of health services (Figure 17).
Figure 17
Beyond education and health, labor market institutions can play an important role determining pretax growth rates at the bottom. While the extension of the minimum wage contributed to reduce inequalities in the US40 in the 1960s, the decline of minimum wage afterwards is likely to have contributed to the stagnation of incomes at the bottom. In the US, the minimum wage went from 42% of average earnings in 1980 to 24% between today (in real terms, it decreased from more than $10 per hour 39 Top to bottom quintile intergenerational mobility is found to be the highest in mid-tier public colleges in the US
(Chetty et al., 2017).
in the 1960s to $7.25 in 2018). In many European countries, the movement followed an the opposite direction, with the minimum wage being maintained at a high level relative to average income: in France, it was kept approximately at 50% of the average wage (in real terms it rose from 5.5€ to 10€ per hour between 1980 and today) (Appendix Figure 13). In the United Kingdom and in Germany a minimum wage was introduced after 1990.
European countries with low pretax income inequality levels and without minimum wage have powerful trade unions and collective bargaining agreements to set wages at the sectorial level. In Scandinavian countries, union density is around 50%-70%, the highest rate among OECD countries, where union density has been dramatically falling over the past decades. Variations in union density across rich countries are found to be relatively well correlated with pretax inequality dynamics (Jaumotte and Osorio Buitron, 2019).
The distribution of power in corporate governance bodies may also matter a lot for pretax income growth at the bottom of the distribution. In Sweden, the Netherlands or in Germany for instance, workers are represented in corporate governance boards, and can influence corporate decisions on wage and other strategic matters. In Germany, up to 50% of seats in advisory boards can be reserved for trade unions and up to 30% in Sweden, reinforcing the need for other board members to enter in coalition with trade union representatives.
To summarize: the large growth differentials observed in the US and in Europe since the 1980s do not appear to be mainly due to trade or technological change, but neither are they about cash redistribution. The gap largely owes to different policies and institutional setups which impact pretax incomes. Policies impacting the distribution of pretax incomes have been termed “predistribution policies” (Hacker, 2011) as opposed to “redistribution policies”. This opposition should be nuanced: policies with potentially strong impacts on pretax incomes at the bottom, such as the public provision of higher education or universal health coverage require government resources. The way these are financed can also have impacts on pretax and posttax inequality, as we discuss below. So far, European countries succeeded to maintain a
relatively high level of public spending in higher education and health41. Yet, European countries have also increasingly relied on flat taxes to finance public services and government expenditures (Appendix Figure 14)42. These dynamics have raised concerns about the political sustainability of the financing of public services in Europe and suggest that redistribution (and progressive taxation in particular) and predistribution cannot be discussed independently.
10. Tax progressivity has shaped the dynamics of inequality at the
top
It has been suggested that the rise of the top 1% could be explained by higher educational attainment – and higher productivity- of top income groups (Mankiw, 2013). But a close look at the incomes of the top 0.01% across rich countries shows large variations in terms of remunerations and little or no correlation between productivity levels and top wages (Alvaredo et al. 2018). The remunerations of the CEOs of Germany’s largest companies, for instance, are on average about 50% below remunerations of top CEOs in the United States (Bloomberg, 2017), with little evidence that such pay differentials reflect significant differences in productivity differentials between firms on both sides of the Atlantic.
Another explanation for rising top labor incomes is the so-called “superstar effect” (Rosen, 1981). Technological change and globalization have made it easier for those who make it to the top to reap a higher share of growth thanks to rising market size. Due to the superstar effect, tiny differences in talent—or sometimes in bargaining power and other attributes—may translate into very large income differentials. Indeed, these global “superstars” are not necessarily more productive or talented than they were forty years ago, but benefit from a wider market potential. The superstar effect is likely to account for common inequality trends across rich countries. But stark divergences in pretax income growth rates at the very top of the distribution in rich countries again suggest that other factors were at play.
41 We note, however, that public investments in public education have been declining over the past decades in
Europe, including in some Scandinavian countries which have also experienced a rise of inequality.
42 Indeed, the average top corporate income tax rate in the European Union decreased from 50% in 1980 to 25%
today. Conversely, the average VAT rate was increased over the period (by 4p.p., from 17.5% to 21.5% from 1980 to 2017) (See Blanchet, Chancel and Gethin, 2019).
Changes in tax progressivity have played an important role in the surge of top incomes pretax and posttax over the past decades. Progressive tax rates contribute to the reduction of posttax income inequality at the top of the distribution via their highest marginal tax rates. One often-neglected role of top marginal tax rates is their ability to reduce pretax income inequality. This can occur via two channels. The most obvious one is that when top marginal income tax rates are high, top earners have less money to save and accumulate wealth, and therefore all else equal, less capital income in the long run (Piketty et al., 2014). Another way to understand the impact on top income tax rates on income inequality is to focus on rich individuals' bargaining incentives. When top marginal tax rates are low, top earners have high incentives to bargain for compensation increases. Conversely, high top marginal tax rates tend to discourage such bargaining efforts. High top tax rates also act as signals of societies' aversion to extreme gains at the top of the distribution and can, at least partly, influence board pay strategies. Reductions in top tax rates thus tend to drive upwards posttax and pretax inequality.
Top income tax rates were significantly reduced in rich countries after the 1970s and their variations are relatively well associated with changes in top pretax income shares across rich and emerging countries. Countries such as Germany, Spain, Denmark, and Switzerland, which did not experience any significant top rate tax cut, did not experience increases in top income shares. Conversely, the United States, UK, and Canada experienced important reductions in top marginal tax rates and strong increases in their top 1% income shares (Figure 18).
Figure 18
Personal income taxes are just one dimension of overall progressive taxation. Since the 1980s, top marginal estate taxes have declined in the US and the UK. More broadly, the total tax rate applicable to individuals at the top of the distribution has declined significantly in the US. Piketty et al. (2018) find that the overall tax on the top 0.01% fell from 50% in the 1950s, to less than 40% after the 1980s. The tax rate on
the top 400 Americans declined from 60% in the 1960s to slightly over 30% today43 (Saez and Zucman, 2019). For the first time, richest Americans pay effectively less taxes than the rest of the population (Appendix Figure 15). The strong decline of progressive taxation at the top of the distribution in the US is not only due to the movements of income tax rates, but largely to the joint dynamics of income and corporate tax rates. The huge fall of the corporate tax form the 1960s in the US allowed top business owners to shift their compensations in order to reduce tax. Around 1.3% of US GDP accruing to S-corporation business owners corresponds to disguised salary (Smith et al., 2019).
In rich countries, the reduction in tax rates at the top was associated with an increase in the tax rate of the middle class. Egger et al., 2019 show that the mid-1990s, the labor income tax of the middle class rose in high-income countries, while the top 1% of workers and employees faced a reduction in their tax total tax rates. In the US, taxes on the bottom 90% grew from less than 10% in the 1910s-1920s, to around 30% in the 1990s-2000s.
The high tax progressivity era of the 1940s to the 1980s did not prevent high income growth rates in the EU and the US. In the longer run, the high progressive tax era of the 1950-1980s is associated with higher growth rates than the low progressive tax era of the 1980s (Appendix Figure 16). On the contrary, the post-1980 low-tax progressivity era has been associated with lower income growth rates – and particularly so at the bottom of the distribution. This suggests that bargaining elasticities of the rich are more important than incentive effects (at least when high tax progressivity applies to the very top of the distribution – top marginal income tax rates of 80-90% applied to the top decile might have impacted growth in a different way). In 43 In 2018 the US, the macroeconomic tax rate (total taxes and social contribution divided by national income) is
28.5%. In the 2010s, rich countries’ macroeconomic tax ratewas around 40%, after a dramatic increase throughout the 20th century. High-income countries’ average macroeconomic tax rate was around 25% in the 1960s and less
than 5% in the 1930s (Lindert, 2004). This indeed masks relatively large variations: Anglo-Saxon countries redistribute around 30-35% of national income, while Western European and Scandinavian countries redistribute 45-50% of what they earn. The bulk of the difference in macroeconomic tax rates across countries owes to public pensions. In Western European and Scandinavian countries, they represent on average 10% of national income (and pensions be higher than 15% of national income in France or Italy43). To summarize: excluding pensions
contributions from total tax rates, rich countries have broadly similar macroeconomic tax rates, around 35% of national income. However, rich countries organize redistribution and access to public services, including education and health very differently, and these differences are likely to have large impacts on the growth outcomes at the bottom of the distribution (see section 9).