HAL Id: hal-01139693
https://hal.archives-ouvertes.fr/hal-01139693
Submitted on 7 Apr 2015
HAL is a multi-disciplinary open access
archive for the deposit and dissemination of
sci-entific research documents, whether they are
pub-lished or not. The documents may come from
teaching and research institutions in France or
abroad, or from public or private research centers.
L’archive ouverte pluridisciplinaire HAL, est
destinée au dépôt et à la diffusion de documents
scientifiques de niveau recherche, publiés ou non,
émanant des établissements d’enseignement et de
recherche français ou étrangers, des laboratoires
publics ou privés.
Winter 2010 in Europe: A cold extreme in a warming
climate
J. Cattiaux, R. Vautard, C. Cassou, P. Yiou, Valérie Masson-Delmotte, F.
Codron
To cite this version:
J. Cattiaux, R. Vautard, C. Cassou, P. Yiou, Valérie Masson-Delmotte, et al.. Winter 2010 in Europe:
A cold extreme in a warming climate. Geophysical Research Letters, American Geophysical Union,
2010, 37 (20), pp.L20704. �10.1029/2010gl044613�. �hal-01139693�
Winter 2010 in Europe: A cold extreme in a warming climate
J. Cattiaux,
1R. Vautard,
1C. Cassou,
2P. Yiou,
1V. Masson
‐Delmotte,
1and F. Codron
3Received 7 July 2010; revised 25 August 2010; accepted 27 August 2010; published 22 October 2010.
[1] The winter of 2009/2010 was characterized by record
persistence of the negative phase of the North‐Atlantic Oscillation (NAO) which caused several severe cold spells over Northern and Western Europe. This somehow unusual w i n t e r w i t h r e s p e c t t o t h e m o s t r e c e n t o n e s a r o s e concurrently with public debate on climate change, during and after the Copenhagen climate negotiations. We show however that the cold European temperature anomaly of winter 2010 was (i) not extreme relative to winters of the past six decades, and (ii) warmer than expected from its record‐breaking seasonal circulation indices such as NAO or blocking frequency. Daily flow‐analogues of winter 2010, taken in past winters, were associated with much colder temperatures. The winter 2010 thus provides a consistent picture of a regional cold event mitigated by long‐term climate warming.Citation: Cattiaux, J., R. Vautard, C. Cassou, P. Yiou, V. Masson‐Delmotte, and F. Codron (2010), Winter 2010 in Europe: A cold extreme in a warming climate, Geophys. Res. Lett., 37, L20704, doi:10.1029/2010GL044613.
1.
Introduction
[2] The period December 2009–January 2010–February
2010 (hereafter winter 2010) was punctuated by series of cold weather events and unusual snow accumulation in several Northern Hemisphere countries (see http://www. ncdc.noaa.gov/sotc/). In Europe, three successive cold out-breaks and unusual persistence of snow cover were observed (see http://www.knmi.nl/cms/content/79165), which shaped the public perception of an exceptionally intense winter. Several states of Eastern United States also recorded their snowiest winter ever [Seager et al., 2010] while a few cities witnessed record‐breaking cold daily temperatures [Wang et al., 2010]. These weather events occurred during and after intense media activity covering international climate negotiations in Copenhagen, and raised up questioning about global warming. A global perspective nevertheless high-lights that winter 2010 was marked by a mean warm anomaly at global scale, especially over Greenland, Canada, North‐ Africa and Middle East (see http://data.giss.nasa.gov/gistemp/ maps/). Understanding and improving the predictability of such mid‐latitude cold spells is a key societal issue, since their fate in both frequency and intensity in a warming climate directly impacts sectors of energy demand, transport disruption and social emergency protection systems.
[3] This paper focuses on European cold temperatures of
winter 2010. The European wintertime climate is mostly driven by atmospheric dynamics over the North‐Atlantic – European (NAE) area [Walker, 1924], characterized by a baroclinic instability of the westerly jet stream which gen-erates planetary waves traveling from North‐Eastern America to the European continent [e.g., Charney, 1947]. The unstable nature of the jet also triggers quasi‐stationary circulation patterns of larger scale, often referred to as “weather regimes”, which can persist from a few days to a few weeks [Legras and Ghil, 1985; Reinhold and Pierrehumbert, 1982; Vautard, 1990]. The seasonal‐to‐decadal variability in European temperatures has often been considered as driven by the frequency of occurrence of each regime [Philipp et al., 2007; Vautard and Yiou, 2009]. For instance the positive (negative) phase of the North Atlantic Oscillation (NAO) is generally associated with rather warm (cold) temperatures [e.g., Hurrell, 1995], while the persistence of a high‐pressure system over Northern Europe or the British Isles, often referred to as “European blocking” conditions, leads to cold and dry weather over Western Europe [e.g., Yiou and Nogaj, 2004].
[4] Our aim is to investigate which weather regimes were
associated to the cold winter 2010, and their interplay with the temperature anomaly. In particular we use the “flow‐ analogues” approach developed by Yiou et al. [2007] to analyze this temperature anomaly based on past relation-ships between atmospheric circulation and temperatures.
2.
Data and Methods
[5] The daily atmospheric dynamics is analyzed through
re‐analyses of geopotential height at 500hPa (Z500) pro-vided by National Centers for Environmental Prediction and National Center for Atmospheric Research (NCEP‐NCAR) [Kistler et al., 2001] over the period 1948–2010 (http:// www.esrl.noaa.gov/psd/data/gridded/data.ncep.reanalysis. html). Anomalies are computed by removing at each grid point the 1961–1990 daily climatology.
[6] Several indices are used for the statistical analysis of
winter 2010 seasonal dynamics: (i) the seasonal NAO index (NAOi) defined as the difference between Azores and Ice-land normalized surface pressures [Jones et al., 1998; Osborn, 2006] (computed from monthly values downloaded from http://www.cru.uea.ac.uk/∼timo/datapages/naoi.htm), (ii) the frequency of blocking days throughout the winter season as defined by Tibaldi and Molteni [1990] (computed over 30° rcW(±10°)), (iii) the winter Seasonal Dynamics Index (SDI) defined by Cattiaux et al. [2010] and based on optimal correlation between European atmospheric circu-lation and temperatures, and (iv) the seasonal frequency of daily occurrences of North‐Atlantic “weather regimes” obtained by Cassou [2008] from a “k‐means” clustering
1LSCE, UMR 8212, IPSL, CEA‐CNRS‐UVSQ, Gif‐sur‐Yvette,
France.
2Cerfacs, CNRS, Toulouse, France.
3LMD, IPSL, CNRS‐Ecole Polytechnique‐ENS‐UPMC, Paris,
France.
Copyright 2010 by the American Geophysical Union. 0094‐8276/10/2010GL044613
method computed in the Empirical Orthogonal Functions phase space [Michelangeli et al., 1995] over the NAE domain and the period 1974–2007.
[7] Temperature data are from the European Climate
Assessment and Dataset (ECA&D) project [Klein‐Tank et al., 2002], which provides daily minimum, maximum and mean temperatures (respectively Tmin, Tmax and Tavg) at European stations (http://eca.knmi.nl/dailydata/). The data set is geographically homogenized by selecting the stations on the basis of (i) the simultaneous availability of Tavg, Tmin and Tmax data, (ii) the availability of more than 80% of daily values between 1 January 1948 and 28 February 2010, (iii) a selection of only one station per grid cell of 0.75° × 0.5° size. This method is similar to that used in previous studies [Vautard and Yiou, 2009; Yiou et al., 2007], and retains here 230 stations over Europe. Anomalies are computed by removing at each station the 1961–1990 daily climatology, and in order to better quantify their amplitude, normalized anomalies relative to the mean and the standard deviation (s) of the 1949–2010 anomalies distribution are used.
[8] The “flow‐analogues” method, used in section 5 to
estimate daily temperatures observed during similar flow conditions in past winters, was developed by Yiou et al. [2007] and consists as follows: for each day of winter 2010, ten flow‐analogues are selected among winters 1949 to 2009 in a 30‐day window centered on this given day. The selection is made on the basis of maximizing the Spear-man’s correlation of daily Z500 NAE maps. Then, for each station, the daily “analog” temperature anomaly is defined as the median of daily temperature anomalies of the ten
flow‐analogue days. Using rather Euclidean distance or linear correlation for Z500 ranking, five or twenty flow‐ analogues, and the mean in analog temperature computation does not change our results in a significant manner.
3.
Extreme Persistence of Daily NAO
− Conditions
During Winter 2010
[9] Winter 2010 is characterized by an exceptional
Northern Hemisphere mean atmospheric circulation [Wang et al., 2010]. The Z500 anomaly exhibits a strong zonal hemispheric pattern, with anomalously high (low) pressures over the pole (mid‐latitudes) (Figure 1a). Such a structure corresponds to a negative phase of the Arctic Oscillation (AO) [Thompson and Wallace, 1998]. In particular L’Heureux et al. [2010] highlighted that the negative AO of December 2009 was a record.
[10] Wintertime European temperatures are largely
con-trolled by the NAO [e.g., Hurrell, 1995; van Loon and Rogers, 1978], which can be interpreted, even if controver-sial, as the regional signature of the AO [e.g., Ambaum et al., 2001]. Over the NAE domain, the winter 2010 hemispheric zonal structure is associated with an extremely negative phase of the NAO, even constituting a record of NAOi since winter 1824, almost 3s below average (Figure 1b). Negative NAO events usually favor the development and persistence of North‐Atlantic atmospheric blockings [e.g., Shabbar et al., 2001]. This is the case of winter 2010 which has the 2nd highest blocking frequency since 1949 (Figure 1c, freq = 33%), close to the record of the winter 1963 (freq = 34%). Moreover the winter 2010 SDI value is the 6th lowest Figure 1. (a) Geopotential height at 500mb (Z500) anomaly averaged over winter 2010 above 20°N (from NCEP). Units: m. Labeled gray contours indicate standard deviations levels. (b) Normalized 1824–2010 time series (bars) and spline‐smoothing (line) of NAOi. Winter 2010 is indicated by the blue dashed line. (c) Normalized 1949–2010 time series of NAOi (bars), SDI (gray) and North‐Atlantic blocking days frequency (black). Winter 2010 values are indicated by dashed lines. Levels are inversed for blockings, see right axis. NAOi differ from Figures 1b to 1c since normalizing periods differ.
CATTIAUX ET AL.: COLD WINTER 2010 IN EUROPE L20704
L20704
recorded since 1949, which confirms the exceptional character of the winter 2010 dynamics at European scale (Figure 1c). Blocking frequency and SDI are significantly correlated with NAOi (respectively r =−0.73 and r = 0.73, p − value < 1%).
[11] Seasonal values of NAOi are closely linked to daily
occurrences of NAE weather regimes presented in Figure 2. The first (third) regime is indeed generally connected to the positive (negative) phase of the NAO, the second one is referred to as Scandinavian Blocking and the fourth one as Atlantic Ridge [e.g., Michelangeli et al., 1995]. Winter 2010 extreme NAO is thus caused by both a record frequency of NAO− occurrences over winters 1958–2010 (63/90 days, 8 more days than the previous record in winter 1966) and a very low frequency of NAO+ occurrences (5/90 days, the 3rd lowest after 1969, 3/90, and 1963, 4/90). Although referring to very different quantifications of the NAO, sea-sonal NAOi and frequencies of NAO+ (NAO−) regimes are highly correlated (r = 0.8 (−0.75), p − values < 1%).
In addition, while positive (negative) phases of the NAO dominate winters 1980–1995 (1995–2010), we found no significative ( p− values < 5%) trends in any seasonal index or weather regime frequency over the last three decades.
4.
How Cold Was Winter 2010 in Europe?
[12] Winter 2010 European temperatures were on average
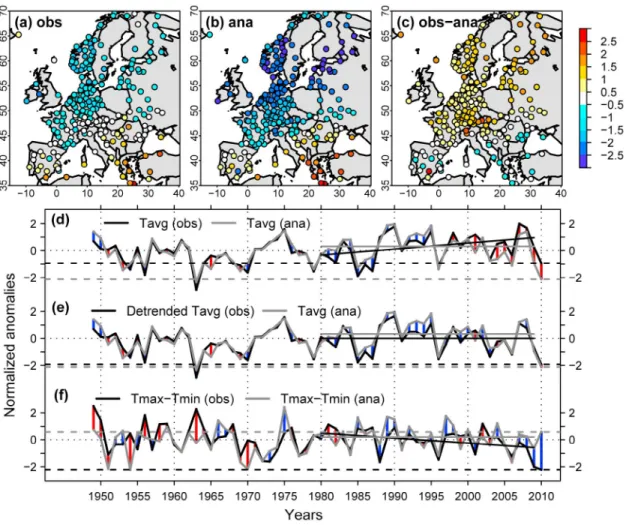
anomalously cold (Figure 3a), with largest negative anomalies (about−1.5s) over North‐Western Europe while milder conditions prevailed over Southern Europe. This seesaw latitudinal pattern is entirely consistent with the canonical signature of the negative NAO [Hurrell, 1995]. More generally, Wang et al. [2010] showed that the winter 2010 negative NAO was responsible for the quadripole structure in NAE temperature anomalies (warm over Canada/ Greenland and North Africa/Middle East, cold over United States and Eurasia).
Figure 2. (a–d) Winter weather regimes as computed from Z500 by [Cassou, 2008]: NAO+, Scandinavian Blocking, NAO− and Atlantic Ridge. Units: m. Percentages represent each regime frequency over the computation period (1974– 2007). (e–h) Frequencies of occurrence of each regime over 1958–2010. Units: days/90 (left axis) and s (right axis). Winter 2010 values are highlighted in red and mean 1950–2010 frequencies are indicated.
CATTIAUX ET AL.: COLD WINTER 2010 IN EUROPE L20704
[13] Averaged over all European stations the winter 2010
anomaly of daily mean temperature is−1.3°C, corresponding to a departure of −0.9s from the 1949–2010 distribution (Figure 3d). As in previous studies [e.g., van Loon and Rogers, 1978], we find high correlations between Euro-pean temperatures and both the phase and amplitude of the NAO (e.g., r = 0.70 for Tavg–NAOi and r = 0.75 for Tavg– NAO+ regime frequency, both p − values < 1%), and that most of cold peaks are associated with significantly low NAOi or NAO+ frequency (not shown). Note that the fre-quency of NAO− regime is less significantly anti‐correlated with temperatures (r = −0.56, p − value < 1%) since cold events can also be linked to Scandinavian blockings or Atlantic Ridge conditions (Figure 2).
[14] Winter 2010 ranks as the 13th coldest winter since
1949 over Europe, far behind the cold record of 1963 (−4.0° C, −2.9s) despite comparable atmospheric dynamics indi-ces. Winter 1963 indeed experienced the 3rd lowest NAOi since 1824 (Figure 1b), and the 2nd lowest NAO+ regime frequency (Figure 2e). However cold temperatures of winter 1963 seem caused by both NAO− and strong Scandinavian
blockings, while NAO− largely dominates in winter 2010 (Figure 2).
5.
Temperatures in Flow
‐Analogues
of Winter 2010
[15] For 84% of stations (193/230) flow‐analogues
sam-pled in past winters were associated with significantly colder daily mean temperature (Tavg) anomalies than observed in winter 2010 (Figures 3b and 3c). Only a few stations in Southern Europe exhibit a higher analog temperature than observed. The maximal departure is found over the Alps region, where observed temperatures were close to average while analog anomalies reach−2s. Averaged over all sta-tions, past flow‐analogues of winter 2010 were associated with a negative temperature normalized anomaly reaching −2.1s, the 2nd coldest analog anomaly close behind winter 1963 (−2.3s, see Figure 3d). In other words the daily atmospheric dynamics of the winter 2010 was favorable to a temperature anomaly comparable in amplitude to the cold record of winter 1963.
Figure 3. Winter 2010 normalized (a) observed and (b) analog Tavg anomaly (from ECA&D stations). (c) Difference between Figures 3a and 3b. (d) Normalized 1949–2010 time series of observed (analog) Tavg anomaly in black (gray) line. Red (blue) segments indicate positive (negative) observed–analog differences. Winter 2010 values are indicated by dashed lines. 1980–2009 linear trends are added. (e) Same as Figure 3d with the 1980–2009 linear trend removed from observed Tavg time series. (f) Same as Figure 3d for normalized Tmax–Tmin time series.
CATTIAUX ET AL.: COLD WINTER 2010 IN EUROPE L20704
L20704
[16] Analog temperatures of winters 1949 to 2010 are well
correlated to observed ones (r = 0.85, p− value < 1%) but miss the recent warming trend (linearly estimated to 0.44s/ decade over 1980–2009, p − value = 3%), since no signif-icant tendency is found in recent circulations (Figure 3d). Nine of the past ten winters exhibit positive differences between observed and analog temperatures, and winter 2010 departure is the 3rd highest of the whole period, behind 2008 and 2000. This inconsistency between recent European temperatures and changes in the North Atlantic atmospheric dynamics has been recently highlighted in other studies [Cattiaux et al., 2010; Vautard and Yiou, 2009; Yiou et al., 2007] and is also found in future climate projections [Stephenson et al., 2006; van Ulden et al., 2007]. Sub-tracting the 1980–2009 trend from observed Tavg time series ranks winter 2010 in 2nd position with −1.9s, which is similar to the analog anomaly (Figure 3e), suggesting the long‐term trend in European temperatures to cause the departure between temperatures and dynamics in winter 2010.
[17] Winter 2010 cold anomaly is stronger for maximal
(daytime, −1.2s) than minimal (nighttime, −0.7s) tem-peratures, which even constitutes a negative record in terms of diurnal range (−2.2s of the Tmax‐Tmin distribution) within a longer‐term decreasing tendency (−0.37s/decade over 1980–2009, Figure 3f). This observed reduction of wintertime diurnal range is consistent with future climate projections that generally suggest a higher warming in minimal than maximal winter temperatures, due to the higher contribution of long‐wave than short‐wave net downward surface radiative flux for that season [Vose et al., 2005]. Analog temperatures do not exhibit any significant ten-dency in recent diurnal ranges, and even exhibit a higher maximal than minimal temperature anomaly in winter 2010 (Figure 3f). The record dirunal range of winter 2010 may be linked to the unusual snow cover highlighted by Seager et al. [2010], modifying albedo and daytime surface energy budget (not shown).
6.
Conclusions
[18] Our findings indicate that the cold – albeit not
exceptional – temperature anomaly of winter 2010 was mostly caused by an extreme persistence of the negative phase of the NAO. However similar dynamics were generally associated with even colder temperatures in past winters, so that the winter 2010 mean temperature expected from the sole atmospheric circulation is comparable to the cold record of winter 1963. Winter 2010 appears to be a remarkable event within a longer‐term tendency: observed temperature anoma-lies have been quasi‐systematically warmer than flow‐ analogues ones over the past two decades, which probably results from background climate warming [Yiou et al., 2007; Cattiaux et al., 2010]. The fact that the positive departure of observed temperatures from flow‐analogues is larger for minimal than for maximal temperatures is consistent with radiative consequences of increasing greenhouse gases concentrations.
[19] Thus winter 2010 can be considered as an
exam-ple of a cold extreme superimposed on a warming climate. Since (i) climate projections suggest the European warm-ing will continue in future decades, and (ii) the extreme
dynamics of winter 2010 was one of the most favorable to cold weather since the 1820s, this winter could be one of the coldest of the 21st century.
[20] Acknowledgments. We thank R. Seager and two anonymous referees for insightful remarks that helped clarify the manuscript. This work was supported by the French ANR CHEDAR project.
References
Ambaum, M., B. Hoskins, and D. Stephenson (2001), Arctic Oscillation or North Atlantic Oscillation?, J. Clim., 14, 3495–3507.
Cassou, C. (2008), Intraseasonal interaction between the Madden–Julian Oscillation and the North Atlantic Oscillation, Nature, 455(7212), 523–527, doi:10.1038/nature07286.
Cattiaux, J., R. Vautard, and P. Yiou (2010), North‐atlantic SST amplified recent wintertime european land temperature extremes and trends, Clim. Dyn., doi:10.1007/s00382-010-0869-0, in press.
Charney, J. (1947), The dynamics of long waves in a baroclinic westerly current, J. Atmos. Sci., 4(5), 136–162.
Hurrell, J. (1995), Decadal trends in the North Atlantic Oscillation: Regional temperatures and precipitation, Science, 26, 676–679. Jones, P., T. Jonsson, and D. Wheeler (1998), Extension to the North
Atlantic Oscillation using early instrumental pressure observations from Gibraltar and south‐west Iceland, Int. J. Climatol., 17(13), 1433–1450. Kistler, R., et al. (2001), The NCEP/NCAR 50‐year reanalysis, Bull. Am.
Meteorol. Soc., 82(2), 247–268.
Klein‐Tank, A., et al. (2002), Daily dataset of 20th‐century surface air temperature and precipitation series for the European climate assess-ment, Int. J. Climatol., 22, 1441–1453, doi:10.1002/joc.773. Legras, B., and M. Ghil (1985), Persistent anomalies, blocking and
varia-tions in atmospheric predictability, J. Atmos. Sci., 42(5), 433–471. L’Heureux, M., A. Butler, B. Jha, A. Kumar, and W. Wang (2010),
Unusual extremes in the negative phase of the Arctic Oscillation during 2009, Geophys. Res. Lett., 37, L10704, doi:10.1029/2010GL043338. Michelangeli, P., R. Vautard, and B. Legras (1995), Weather regimes:
Recurrence and quasi stationarity, J. Atmos. Sci., 52(8), 1237–1256. Osborn, T. (2006), Recent variations in the winter North Atlantic Oscillation,
Weather, 61(12), 63.
Philipp, A., et al. (2007), Long‐term variability of daily North Atlantic‐ European pressure patterns since 1850 classified by simulated annealing clustering, J. Clim., 20(16), 4065–4095.
Reinhold, B., and R. Pierrehumbert (1982), Dynamics of weather regimes: Quasi‐stationary waves and blocking., Mon. Weather Rev., 110, 1105–1145.
Seager, R., Y. Kushnir, J. Nakamura, M. Ting, and N. Naik (2010), Northern Hemisphere winter snow anomalies: ENSO, NAO and the winter of 2009/10, Geophys. Res. Lett., 37, L14703, doi:10.1029/ 2010GL043830.
Shabbar, A., J. Huang, and K. Higuchi (2001), The relationship between the wintertime North Atlantic Oscillation and blocking episodes in the North Atlantic, Int. J. Climatol., 21(3), 355–369, doi:10.1002/joc.612. Stephenson, D., et al. (2006), North Atlantic Oscillation response to
tran-sient greenhouse gas forcing and the impact on European winter climate: A CMIP2 multi‐model assessment, Clim. Dyn., 27(4), 401–420, doi:10.1007/s00382-006-0140-x.
Thompson, D., and J. Wallace (1998), The Arctic Oscillation signature in the wintertime geopotential height and temperature fields, Geophys. Res. Lett., 25(9), 1297–1300.
Tibaldi, S., and F. Molteni (1990), On the operational predictability of blocking, Tellus, Ser. A, 42(3), 343–365.
van Loon, H., and J. Rogers (1978), The seesaw in winter temperatures between Greenland and northern Europe. Part I: General description, Mon. Weather Rev, 106(3), 296–310.
van Ulden, A., et al. (2007), Circulation statistics and climate change in central Europe: Prudence simulations and observations, Clim. Change, 81, 179–192.
Vautard, R. (1990), Multiple weather regimes over the North Atlantic— Analysis of precursors and successors, Mon. Weather Rev., 118(10), 2056–2081.
Vautard, R., and P. Yiou (2009), Control of recent European surface cli-mate change by atmospheric flow, Geophys. Res. Lett., 36, L22702, doi:10.1029/2009GL040480.
Vose, R. S., D. R. Easterling, and B. Gleason (2005), Maximum and min-imum temperature trends for the globe: An update through 2004, Geo-phys. Res. Lett., 32, L23822, doi:10.1029/2005GL024379.
Walker, G. (1924), Correlation in seasonal variation of weather, IX, Mem. India Meteorol. Dep., 24(9), 275–332.
CATTIAUX ET AL.: COLD WINTER 2010 IN EUROPE L20704
Wang, C., H. Liu, and S. Lee (2010), The record‐breaking cold tempera-tures during the winter of 2009/2010 in the Northern Hemisphere, Atmos. Sci. Lett., doi:10.1002/asl.278.
Yiou, P., and M. Nogaj (2004), Extreme climatic events and weather regimes over the North Atlantic: When and where?, Geophys. Res. Lett., 31, L07202, doi:10.1029/2003GL019119.
Yiou, P., R. Vautard, P. Naveau, and C. Cassou (2007), Inconsistency between atmospheric dynamics and temperatures during the exceptional
2006/2007 fall/winter and recent warming in Europe, Geophys. Res. Lett., 34, L21808, doi:10.1029/2007GL031981.
C. Cassou, Cerfacs, CNRS, 42 avenue Gaspard Coriolis, F‐31057 Toulouse CEDEX, France.
J. Cattiaux, V. Masson‐Delmotte, R. Vautard, and P. Yiou, LSCE, UMR 8212, IPSL, CEA‐CNRS‐UVSQ, Orme‐des‐Merisiers Bat 701, F‐91191 Gif‐sur‐Yvette CEDEX, France. ([email protected])
F. Codron, LMD, IPSL, CNRS‐Ecole Polytechnique‐ENS‐UPMC, 4 place Jussieu, F‐75252 Paris CEDEX 05, France.
CATTIAUX ET AL.: COLD WINTER 2010 IN EUROPE L20704
L20704
![Figure 2. (a–d) Winter weather regimes as computed from Z500 by [Cassou, 2008]: NAO+, Scandinavian Blocking, NAO− and Atlantic Ridge](https://thumb-eu.123doks.com/thumbv2/123doknet/13031352.381890/4.918.235.686.84.662/figure-winter-weather-regimes-computed-scandinavian-blocking-atlantic.webp)